

Abstract
Cement sheath is considered an important barrier throughout the life cycle of the well. The integrity of the cement sheath plays a vital role in maintaining the integrity of wells. Cement’s ability to seal the annular space or a wellbore, also known as cement sealability, is an important characteristic of the cement to maintain the well integrity. It is believed that placing cement in the annular space or wellbore can totally prevent any leakage; however, that is debatable. The reason why cement cannot completely prevent fluid leakage is that cement is considered as a porous medium, and also flaws in cement, such as microannuli, channels, and fractures, can develop within the cement sheath. Furthermore, the complexity of casing/cement and cement/formation interaction makes it very difficult to fully model the fluid migration. Hence, fluid can migrate between formations or to the surface. This article presents a numerical model for gas flow in cement sheath, including the microannulus flow. A parametric study of different variables and their effect on the leakage time is carried out, such as the microannulus gap size, cement matrix permeability, cement column length, and cement porosity. In addition, it presents leakage scenarios for different casing/liner overlap length with the existence of microannulus. The leakage scenarios revealed that the cement matrix permeability, microannulus gap size, and cement length can highly impact the leakage time; however, cement porosity has a minimal effect on the leakage time. In addition, modeling results revealed that the casing/liner overlap length should not be less than 300 ft, and the casing pressure duration should be beyond 30 min to detect any leak.
1. Introduction
Cement sheath plays a key role in maintaining the integrity of a well throughout the well’s life cycle. During the drilling and completion phase of wells, cement integrity becomes more crucial due to the dangerous consequences that might occur when the cement integrity fails.1,2 The ability of cement to seal the annular space plays a critical role in maintaining the well’s integrity by preventing the movement and migration of subsurface fluid and gases to the surface and adjacent formations. Cement sealability can be defined as the ability of cement to seal and prevent fluid propagation through its matrix. Cement sealability strongly depends on the cement sheath properties such as, but not limited to, permeability, thickening time, static gel strength, and unconfined compressive strength.3 Some of these properties are more important than the others during the setting phase of the cement. Cement permeability is a crucial property to resist fluid and gas movement through the cement sheath. Ultra-low permeable cement is desired to prevent fluid flow through the cement and provide excellent zonal isolation.4 Gas can propagate through annular cement if the cement is permeable.
Annular gas flow through and around the cement can occur during the setting phase of the cement, especially in gas prone zones, and this phenomenon is known as gas migration. Annular gas flow can result in catastrophes (i.e., loss of well control, broaching of shallow formation, or a blowout). Annular gas flow is sometimes encountered before installing the blowout preventer.2 Gas can migrate in the cemented annulus if the set cement is permeable and has poor bonding with the formation or casing. In other words, the existence/development of microannuli (circumferential fractures), induced fractures, and channels (even with an ultra-low permeable cement matrix) allows the gas to migrate through these features rather than the cement matrix. Hence, permeable cemented annulus poses many challenges as it endangers the well’s integrity. Therefore, wellbore leakage pathways of uncontrolled formation fluids need to be identified because they provide information on how they can be managed. Potential wellbore leakage pathways can be developed due to faulty completion operation or changes in the well over a long period.5 Crow et al.6 claimed that the defective completion operation could result from poor cement placement, poor bonding of cement to the casing/rock surface, and cement degradation. More causes for the potential leakage pathways are discussed in the next section. The leakage pathways allow gas to migrate through the cement, even if the cement matrix has a low permeability. Some of these leakage pathways for the set cement are shown in Figure 1.
Figure 1.

Leakage pathways in the cement sheath.
Gas migration phenomenon has been a major concern since the 1960s. Gas migration has been considered one of the root causes for most of the incidents that occurred in the oil and gas wells, especially during drilling operations. This phenomenon, particularly in shallow formations, can endanger the integrity of wells. In offshore drilling operations, the use of liners and liner hangers in shallow formations, instead of full casing strings, is more susceptible to gas migration. Liner hangers consist of sealing assembly which acts as a barrier to prevent fluid entry from the wellbore. Liners are hung above the last casing shoe, and they are cemented in place. The distance between the top of the liner and casing shoe is known as liner/casing overlap length.
The cement sheath within the casing/liner overlap and the liner hanger’s seal assembly are considered as a dual barrier system for maintaining the integrity of wells.7,8 Moore et al.9 reported that 30–50% of the seal assembly in the overlap failed, and that is according to a survey conducted in 1999 on operators working in the Gulf of Mexico (GoM). A loss of well control incident occurred in the Main Pass Block (MP-295) in the GoM in 2013.10 The well had a dual barrier system in the annulus (seal assembly and cement). The crew encountered a gas kick, and the dual barrier system failed allowing the gas kick to pass through the seal assembly and the cement within the casing/liner overlap. The gas flowed into a shallow sand formation below the conductor casing. Therefore, not only can the seal assembly fail but also the cement sheath, especially if the cement has flaws such as channels or microannuli. Not only does the cement placed within the casing and the liner leak but also that between the casing and cement. Casing cement can leak through the cement matrix and cement flaws causing gas accumulation above the cement column which results in a sustained casing pressure (SCP).
Limited experimental and modeling studies have been conducted to investigate the cement sealability and to understand the leak through the developed pathways.11−19 Therefore, more experimental and numerical studies are needed to confirm the oil well cement’s ability to seal the annulus. It is supposed to form a barrier that can prevent fluid propagation and movement. In this study, a numerical gas leakage model was developed in MATLAB. This leakage model does not only consider the flow through cement itself but also through the microannulus. The novelty in this work is that the gas flow is considered in both cement and microannulus where no previous studies have considered. Some researchers only considered the flow through the cement matrix, whereas others considered the flow through microannulus only.
2. Literature Review
2.1. Leakage Pathway Development on the Short and Long Term
Cement does not thoroughly hydrate in hours or days; it takes a long time to hydrate fully. As the cement hydrates, the slurry volume starts to reduce due to the reaction between water and the chemical compounds. This reduction in the cement volume is known as cement shrinkage. According to Yodsudjai and Wang,20 cement shrinkage occurs due to several reasons such as hydration, thermal contraction, and phase transition. Volume reduction of cement can vary between 1 and 6% depending on the design of the cement slurry.20,21
For gas migration to occur, two conditions must happen that will allow the gas to flow through and around the cement sheath.22 These conditions are (i) underbalanced conditions and (ii) a potential leakage pathway along the cement column. Four forms of wellbore leakage pathways can be developed. These forms are channels within the cement sheath, pathways at the casing/cement interface (i.e., microannuli), pathways at the cement/rock interface, and fractures in a damaged formation. According to Bois et al.,23 there are three mechanisms associated with the leakage pathway development through cement and at the casing/cement interface: (i) cement placement; (ii) liquid-state hydration; and (iii) solid-state hydration, as summarized in Figure 2.
Figure 2.

Leakage pathway development in the short and long term.
Several factors influence the development of leakage pathways during cement placement.23−27 Mud channels can form a potential pathway once they dehydrate, resulting in cracks. Another factor is poor casing cleaning, which might lower the hydraulic bond between the cement and casing, resulting in microannulus development. Also, cement injection pressure might exceed the formation fracture pressure, hence damaging the formation and creating a leakage pathway.
Several researchers have addressed void development during the liquid-state hydration of cement slurry.28−30 High fluid loss of cement slurries can result in void spaces within the cement matrix, resulting in the development of channels within the cement sheath. The fluid loss of cement slurry not only influences the development of leakage pathways but also the free fluids.31 Both contribute to the development of voids within the cement sheath and voids at the interface of the cement/rock surface.
Hydration reactions continue even after the cement is fully solidified (solid-state hydration). The development of leakage pathways during solid-state hydration has been discussed in the literature.32−35 The shrinkage of cement and reduction in slurry pore pressure can lead to the development of cracks and/or microannulus. In addition, the wellbore fluid density and temperature changes can damage the cement sheath and create flaws such as cracks within the cement or microannulus. Pressure and thermal cycling can also result in debonding at the casing/cement interface, which can serve as a potential leakage pathway.
2.2. Experimental and Modeling Studies for Gas Leakage in Cement Sheath
Researchers have been working to understand the causes of gas leakage and find a solution to this problem. Over the years, especially in the last 4 years, the experimental investigation of gas leakage in cemented annulus has gained recognition as an applied approach to evaluate cement sealability. Table 1 shows a summary of the recent experimental studies of gas leakage in cement columns.
Table 1. Experimental Studies of Gas Leakage in Cement Columns.
| author | research study |
|---|---|
| Stormont et al.39 | studied the effect of confining pressure on microannulus response |
| Gomez et al.40 | studied the effect of confining pressure on microannulus size |
| Opedal et al.41 | studied the sealability of neat Class G cement |
| Stormont et al.13 | extensively investigated the effect of confining and casing pressures on hydraulic aperture size |
| Ahmed et al.18 | investigated the ability of cement to act as a secondary barrier in case of failure of the seal assembly |
| Al Ramadan et al.19 | studied the sealability of neat cement and the effect of anti-gas migration additive to prevent gas leakage |
| Corina et al.12 | evaluated cement sealability at varying temperatures when using anti-gas migration additives |
| Kwatia et al.3 | evaluated the sealability of different cement recipes that can prevent gas migration |
| Corina et al.42 | studied the effect of pipe roughness on the sealing ability of cement plugs |
| Kremieniewski et al.43 | formulated new cement slurries that can prevent gas migration in gas wells |
To better recognize the gas migration mechanisms in cement, researchers started to model gas flow through annular cement and cement plugs whereas others tried to predict the gas migration empirically.36,37 Various models of gas flow through cement have been published in the literature. Some researchers modeled (analytically and numerically) the pressure buildup related to SCP, whereas others attempted to model gas leakage through cement flaws38 and in CO2 sequestration. Table 2 summarizes the numerical and analytical studies of gas leakage in cement columns.
Table 2. Numerical and Analytical Studies of Gas Leakage in Cement Columns.
| author | research study |
|---|---|
| Xu and Wojtanowicz44 | numerical model to study SCP |
| Huerta et al.45 | numerical model to quantify CO2 leakage |
| Tao et al.16 and Tao et al.46 | modified the aforementioned model to obtain the effective system permeability |
| Rocha-Valadez et al.15 | analytical solution for an SCP numerical model |
| Aas et al.17 | analytical leakage model through microannulus |
| Ford et al.47 | leakage calculator based on analytical models |
| Stormont et al.13 | analytical leakage model for gas flow through microannulus |
| Al Ramadan et al.11 | analytical leakage model for gas flow through microannulus in cement plugs |
| Al Ramadan et al.48 | developed leakage scenarios based on an analytical model to investigate the optimum casing/liner overlap length |
3. Methodology
The model was derived based on the diffusivity equation for the linear flow. To model the gas flow through cement, the pressure squared method was used to overcome the limitation of the basic form of the diffusivity equation. The finite volume approach was implemented to solve the partial differential equation (PDE) with the discretization details as given in the Appendix. Following are the mathematical derivations, domain descriptions, boundary conditions, and model limitations.
Fluid flow in porous media is usually described through Darcy’s law which is written as
| 1 |
where u is the velocity vector, μ is the fluid viscosity, P is the pressure, and k is the permeability tensor. Gas flow in cement is laminar and no adsorption takes place; hence, the non-Darcy and Knudsen effects were neglected. Transportation of fluids in a porous medium can be described through mass conservation (i.e., the continuity equation), which is described mathematically as
| 2 |
where ρ is the fluid density, ϕ is the cement porosity, and t is the time. The equation simply states that the mass entering a control volume minus the mass exiting is equal to mass accumulation. Notice that both the fluid and cement compressibility can be written as
| 3 |
| 4 |
| 5 |
where cr is the cement compressibility, cf is the fluid compressibility, and ct is the total compressibility. The density of gas can also be written as
| 6 |
where M is the gas molecular weight, z is the gas compressibility factor, T is the temperature, and R is the universal gas constant. Substituting the definitions of velocity and density into eq 2, manipulating, and rearranging it results in the following PDE
| 7 |
If the product of μz is assumed to be constant, which is valid up to 2000 psi according to Lee and Wattenbarger,49 and substituting the definitions of compressibility, the following equation can be obtained
| 8 |
Figure 3a shows a schematic diagram of a 3D casing annulus consisting of cement and a microannulus. The gas flows from the bottom to the top through the cement and microannulus gap which is highlighted in red. The microannulus gap is assumed to surround the cement and inner casing area as shown in Figure 3c. Because the system is axisymmetric and no angular flow was assumed, the solution is similar in the theta direction. Hence, only a stripe perpendicular to the theta direction was considered (see Figure 3b) which simplifies the problem and saves the computational time. The 2D domain considers only the cement and microannulus gap which was gridded logarithmically. The logarithmic grids were used because the microannulus gap can vary between a couple of micrometers to 100 μm. With these small gaps, it is unreasonable to use a uniform gridding system because it will lead to a high mesh density, resulting in high computational time and sometimes leading to solution instability. Based on the simplified 2D domain (see Figure 3b), eq 8 can be written as
| 9 |
where x is the cement length direction and y is the cement width direction. To solve the PDE, the following initial and boundary conditions were implemented based on the 2D stripe:
-
1.
The initial pressure in the cement column is equal to the system pressure before gas leakage (i.e., gas injection)
| 10 |
-
2.
Injection pressure at the inlet is assumed to be constant
| 11 |
-
3.
Pressure at the outlet is assumed to be constant
| 12 |
-
4.
No flow condition was assumed in the other boundaries
| 13 |
where L is the cement column length and n is the normal vector. Notice that the permeability of the microannulus gap, kma, is related to the gap width, w, through the following equation
| 14 |
Figure 3.
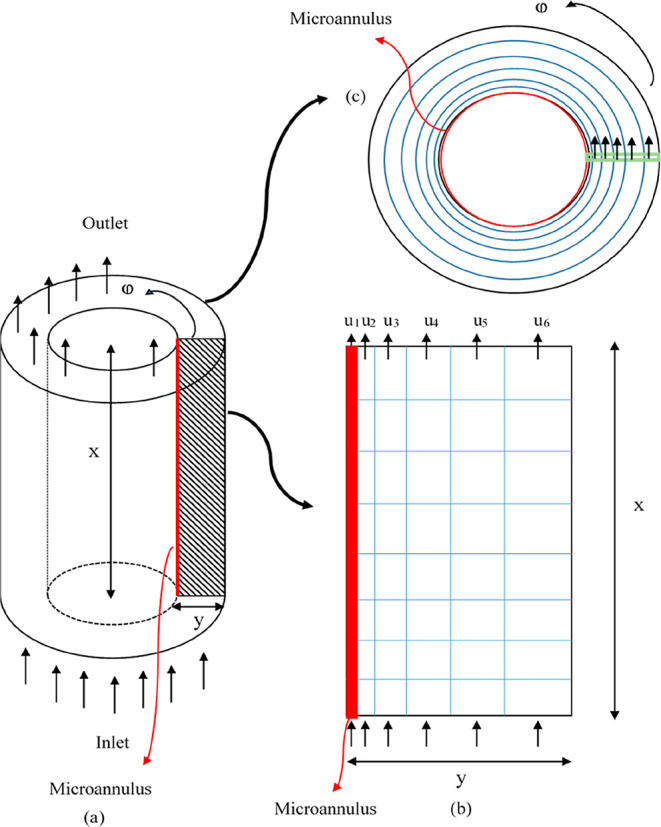
Leakage model (a) 3D annular casing cement; (b) side view of the simulated stripe with the logarithmic grid system; and (c) top view of the system.
The pressure squared method is limited to a system pressure of 2000 psi. After 2000 psi, the solution will start to deviate from the real solution. This is one of the limitations of the developed model. This model assumes the isothermal transient flow of gas. This assumption is valid in the experimental setup where the temperature is usually kept constant. Also, in field simulations of relatively small column height where temperature variations are negligible. In addition, the cement sheath is assumed to have no liquid within its pore spaces due to the hydration process that took place earlier.50 It is only valid for the single phase flow. In addition, only a small stripe of the annulus is considered to simulate the gas leakage in the cement column; that is why the axisymmetric flow is assumed. The flow rate of the full annular space is then calculated based on the outer and the inner diameters of the casing and liner strings.
4. Model Validation and Verification
Prior to model validation, the mesh size was investigated by refining its size and comparing it with a very fine mesh to examine its convergence. The model was then validated by using an analytical solution of the diffusivity equation. The analytical solution used to compare the results from the model developed is the pressure squared analytical equation. Assuming a steady state condition and no microannulus gap, the analytical equation used is
| 15 |
where q is the gas flow rate, A is the cross-sectional area, L is the cement column length, Pin is the inlet pressure, Pout is the outlet pressure, and Po is the ambient pressure. The input data used in this model are shown in Table 3. The casing/liner overlap length can vary between 50 and 500 ft;51 therefore, the cement column length was chosen to be 50 ft. Casing and liner diameters were chosen based on a real well that is presented in the case study.10 The porosity and permeability values of cement were selected based on the experimental investigation.11,52
Table 3. Input Data Used for Model Validation.
| input data | field unit |
|---|---|
| cement column length | 50 ft |
| casing inner diameter | 22 inch |
| liner outer diameter | 18 inch |
| cement thickness | 2 inch |
| cement porosity | 0.2 |
| cement permeability | 0.0001 mD |
| inlet pressure | 1000, 1250, 1500, 1750, and 2000 psi |
| outlet pressure | 500 psi |
| initial pressure | 500 psi |
| temperature | 110 °F |
| nitrogen viscosity | 0.01946 cP |
| number of grids in the x-direction | 1524 |
| number of grids in the y-direction | 50 |
Figure 4 shows a comparison between the analytical and numerical solutions, where the normalized flow rates against different inlet pressures of 1000, 1250, 1500, 1750, and 2000 psi, were examined. The pressure squared method is valid up to 2000 psi with an error of less than 0.2%.
Figure 4.

Normalized flow rate for analytical and numerical solutions vs pressure.
The developed numerical model was also verified with the experimental work that was conducted by Al Ramadan et al.11 The authors fabricated a wellbore setup that has an artificial annulus. They placed cement into the artificial annulus to examine the sealability of the cement sheath, mimicking the cement within the casing/liner overlap. The wellbore setup is 3 ft long with a casing diameter and liner diameter of 6 in and 4.5 inch, respectively. The full description of the experimental work can be found in the aforementioned article.
The pressure decline curve was used to estimate the cement permeability. The model was fed with the experimental data. Cement permeability of 0.006 mD was reported by the authors for the experiment used for model verification. The length of cement column is 3 ft. The setup had a casing diameter of 6 inch and liner diameter of 4.5 inch, and they were used in the input data. Two unknown parameters were varied to match the pressure decline curve: the cement porosity and microannulus gap size. Figure 5 shows the pressure decline curves for the experimental data and the model. The cement porosity and microannulus gap size that were used to get this match was 17% and 10 μm, respectively. The model is in agreement with the experimental data with a root mean square error of 2.63.
Figure 5.

Pressure decline match of the experimental data.
5. Results and Discussion
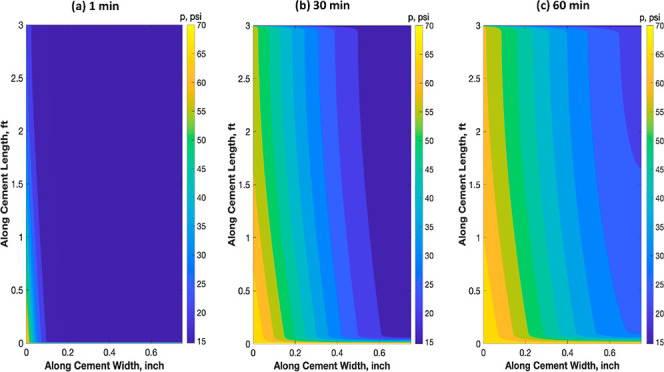
This section focuses on discussing some parameters that impact the leakage time of the gas within the cement sheath considering the microannulus gap. Also, a field case scenario is developed and discussed. The importance of the microannulus gap arises because the fluid flow in the gap before it propagates through the cement sheath. Figure 6 shows the simulation of gas flow, considering a previous experimental study. This figure shows the cement column’s pressure distribution at different time frames: 1, 30, and 60 min. In these figures, the inlet is at the bottom, and the outlet is at the top. Also, the casing string is on the right, and the liner string is on the left (no-flow boundary conditions). One might notice that the gas is injected from the bottom and the microannulus gap exists in the left (adjacent to the liner string). Because the microannulus is considered a highly permeable streak, the gas will favor flowing through this path and then the gas will propagate through the cement matrix. This is why the pressure propagates first to the left side and then pressure waves move inside the cement sheath. The length orthogonal to the microannulus represents the cement thickness (the clearance between the casing and the liner). From these figures, it can be observed that the gas propagates and is leaked during the first 10 min of gas injection. As the pressure propagates more inside the cement sheath, the flow rate starts to increase. This behavior might impact the width of the microannulus from a geomechanical perspective.
Figure 6.

Pressure profile within the cement sheath at different gas injection times.
5.1. Parametric Study
This section includes the parametric study of the cement matrix permeability, cement porosity, microannulus gap size, and casing/liner overlap length with regard to how they impact the leakage time. The leakage time is defined as “the time it takes the gas to travel from the top to bottom of the cemented annulus”.19
5.1.1. Cement Permeability
The cement sheath is considered a porous medium with porosity and permeability properties. Cement permeability is usually low; however, the permeability can increase due to cement degradation, nearby well activities, and carbonation. In this section, the impact of cement matrix permeability on the leakage time is examined.
The effect of cement matrix permeability on the leakage time is studied by varying the cement matrix permeability from 10–5 to 10–1 mD with an increment of one magnitude. A cement column length of 50 ft is used to construct the leakage scenarios. The differential pressure across the cement column is 500 psi. Cement porosity values in these scenarios were predicted using a correlation that is discussed in the next section. Nitrogen gas was used as the migrating fluid. Also, the microannulus gap size of 50 μm is assumed, where this is a typical value reported in the literature.13,17,53 The input data used in the leakage scenarios are given in Table 4.
Table 4. Input Data for Studying the Effect of Cement Matrix Permeability.
| input data | field unit |
|---|---|
| cement column length | 50 ft |
| casing diameter | 22 inch |
| liner diameter | 18 inch |
| cement thickness | 2 inch |
| cement permeability | 0.00001, 0.0001, 0.001, 0.01, and 0.1 mD |
| microannulus gap size | 50 μm |
| inlet pressure | 1000 psi |
| outlet pressure | 500 psi |
| initial pressure | 500 psi |
| temperature | 110 °F |
| nitrogen viscosity | 0.01946 cP |
| number of grids in the x-direction | 1524 |
| number of grids in the y-direction | 50 |
Figure 7 shows the impact of the cement matrix permeability on the leakage time. It is to be noted that the flow rate in this figure is at 1000 psi and 110 °F. It is evident that the cement matrix permeability plays a crucial role in zonal isolation. The leakage time decreases as the cement matrix permeability increases. The leakage time for cement matrix permeability of 0.00001 mD is almost 45 min, and it drops to 20 min for 0.0001 mD. The leakage time for 0.001, 0.01, and 0.1 mD is less than 5 min. It can be observed that the flow reaches a steady state after almost 30 min for cement matrix permeability of 0.01 and 0.1 mD. Therefore, additives should be added to reduce the permeability of the cement matrix such as latex, nanoparticles, and microsilica. This will help in mitigating and preventing gas migration through the cement sheath and maintaining the integrity of the well.
Figure 7.

Impact of cement matrix permeability on the leakage time.
5.1.2. Cement Porosity
Cement porosity effect on the leakage time is examined by varying the porosity from 24 to 34%, keeping the other parameters fixed and assuming a constant permeability. Ichim52 reported that cement porosity can vary between 7 and 35%, where cement porosity was measured as a function of time. Once the cement sets, the porosity value can be as high as 35%; however, this value gets lower up to 7% as the cement hydrates with time. Omosebi54 conducted several experiments to measure the porosity and permeability of Class H and Class G cements. Then, he combined all the results and developed two mathematical correlations. To eliminate the limitation of having a fixed value for cement matrix permeability, the developed mathematical correlation between the porosity and permeability for Class H cement was used, which is described mathematically as
| 16 |
where k is the cement permeability and ϕ is the cement porosity. This correlation is valid for Class H cement, and it assumes that the cement is hydrated and hardened. Also, it assumes that homogeneous volumetric shrinkage occurred during the setting phase of the cement, and there is no air entrapped in the cement. One limitation of this correlation is that it cannot be used for porosity values less than 23%. The input data used to construct the leakage scenarios are shown in Table 5.
Table 5. Input Data for Studying the Impact of Cement Porosity on the Leakage Time.
| input data | field unit |
|---|---|
| cement column length | 50 ft |
| casing diameter | 22 inch |
| liner diameter | 18 inch |
| cement thickness | 2 inch |
| cement porosity | 24, 26, 28, 30, 32, and 34% |
| microannulus gap size | 50 μm |
| inlet pressure | 1000 psi |
| outlet pressure | 500 psi |
| initial pressure | 500 psi |
| temperature | 110 °F |
| nitrogen viscosity | 0.01946 cP |
| number of grids in the x-direction | 1524 |
| number of grids in the y-direction | 50 |
Cement porosity changes with time as the cement hydrates. Once the cement slurry starts to solidify, large pore spaces begin to develop, resulting in high cement porosity. As the hydration reaction continues, the cement matrix expands and reduces the cement sheath’s pore spaces.52Figure 8 shows the impact of cement porosity on the leakage time. The leakage time for all the scenarios falls between 13 and 15 min as shown in Figure 9. It can be inferred that cement porosity has minimal effect on the leakage time. Nevertheless, it significantly impacts the leakage volume with lower porosity resulting in lower volumes.
Figure 8.

Impact of cement porosity on the leakage time (flow rate at 1000 psi and 110 °F).
Figure 9.

Profile is same as Figure 8 but within a closer range on both axes.
5.1.3. Microannulus Gap Size
The microannulus gap size is also known as the microannulus hydraulic aperture. The impact of the microannulus gap size on the leakage time was also studied and analyzed. The impact on the leakage time was studied by varying the microannulus gap size. Table 6 shows the input data used to build the leakage scenarios to investigate the effect of the microannulus gap size on the leakage time. In this section and the following ones, the cement porosity was assumed constant, and the cement porosity–permeability correlation was not implemented in this study because the effect of porosity is negligible.
Table 6. Input Data for Studying the Impact of Microannulus Gap Size.
| input data | field unit |
|---|---|
| cement column length | 50 ft |
| casing diameter | 22 inch |
| liner diameter | 18 inch |
| cement thickness | 2 inch |
| cement porosity | 20% |
| cement permeability | 0.001 mD |
| microannulus gap size | 10, 25, 50, 75, and 100 μm |
| inlet pressure | 1000 psi |
| outlet pressure | 500 psi |
| initial pressure | 500 psi |
| temperature | 110 °F |
| nitrogen viscosity | 0.01946 cP |
| number of grids in the x-direction | 1524 |
| number of grids in the y-direction | 50 |
The microannulus gap size was varied as follows: 10, 25, 50, 75, and 100 μm. Al Ramis et al.55 have physically measured the gap between cement and casing for a time frame of up to 12 months. The measured values are between 0 and 150 μm. In these scenarios, the differential pressure across the cement sheath is 500 psi. Figure 10 illustrates the impact of the microannulus gap size on the leakage time. It can be observed that as the microannulus gap gets bigger, the leakage time decreases. It takes less than 7 min for the gas to leak past the cement sheath for the microannulus gap size that is higher than 50 μm. Therefore, the casing/liner overlap length should not be 50 ft.
Figure 10.

Impact of the microannulus gap size on the leakage time (flow rate at 1000 psi and 110 °F).
5.1.4. Casing/Liner Overlap Length
The effect of the casing/liner overlap length on the leakage time is also investigated. The casing/liner overlap length can be between 50 and 500 ft.51 To build the leakage scenarios, the overlap length was varied between 50 and 500 ft with a 50 ft increment at different microannulus gap sizes (50, 75, and 100 μm). The cement column was exposed to 500 psi differential pressure. Table 7 shows the input data used to study the effect of the casing/liner overlap length on the leakage time.
Table 7. Input Data for Investigating the Impact of Cement Length on the Leakage Time.
| input data | field unit |
|---|---|
| cement column length | 50, 100, 150, 200, 250, 300, 350, 400, 450, and 500 ft |
| casing diameter | 22 inch |
| liner diameter | 18 inch |
| cement thickness | 2 inch |
| cement porosity | 20% |
| cement permeability | 0.001 mD |
| microannulus gap size | 50, 75, and 100 μm |
| inlet pressure | 1000 psi |
| outlet pressure | 500 psi |
| initial pressure | 500 psi |
| temperature | 110 °F |
| nitrogen viscosity | 0.01946 cP |
Figure 11 comprises 30 leakage scenarios for different casing/liner overlap lengths at 3 different microannulus gap sizes. It can be observed that the leakage time for 50 ft with different microannulus gap sizes is less than 5 min. It can also be noted that the leakage time is less than 40 min for 50–150 ft. It is obvious that as the casing/liner overlap length gets shorter, the leakage time decreases. Therefore, this can jeopardize the well integrity in case of taking a kick, where the kick moves from the wellbore and then through the cement placed within the casing/liner overlap. This scenario occurred in an actual drilling operation. This can lead to an underground blowout and contaminating freshwater zones. This is why the casing/liner overlap length is so important to stop such disasters.
Figure 11.

Leakage scenarios for different overlap lengths and microannulus gap sizes.
5.2. Field Case Study
The incident presented here took place in the Main Pass Block 295 (MP295) in the GoM in 2013. The loss of well control occurred during a drilling operation. This field case is reported in the QC-FIT report# 2014-02.10 The event’s major cause was due to gas migration through the casing hanger seal and cement sheath into a shallow sand formation.
Referring to the incident documented in the QC-FIT report, the last casing shoe was set at 1000 ft while the liner hanger was set at 700 ft, creating a 300 ft casing/liner overlap. According to 30 CFR 250.423 (a) regulation,56 the duration of the pressure test of the conductor and casing/liner strings is recommended to be 30 min. The pressure test was conducted at 900 psi for 30 min without any leak indication. Assuming the formation pressure behind the casing is 450 psi, this will create a 450 psi differential pressure on the cement column behind the casing/liner overlap. Assuming a faulty barrier system (cement with 0.001 mD permeability, a microannulus gap of 70 μm, and a faulty elastomer) was present at the time of comprising the incident. The casing, which the liner was engaged in, had a diameter of 22 inches, whereas the liner used had a diameter of 18 inches.
Prior to simulating the leakage scenario for the field case, the model was validated again. The input data used to validate the field case model are the ones used to simulate this incident, but without a microannulus. The input data are shown in Table 8.
Table 8. Input Data Used to Simulate the Field Case Scenario.
| input data | field unit |
|---|---|
| cement column length | 300 ft |
| casing diameter | 22 inch |
| liner diameter | 18 inch |
| cement thickness | 2 inch |
| cement porosity | 20% |
| cement permeability | 0.001 mD |
| microannulus gap size | 70 μm |
| inlet pressure | 900 psi |
| outlet pressure | 450 psi |
| initial pressure | 450 psi |
| temperature | 110 °F |
| nitrogen viscosity | 0.01946 cP |
| number of grids in the x-direction | 9144 |
| number of grids in the y-direction | 50 |
A leakage scenario was developed for this case during the time of pressure testing the casing/liner overlap. Some assumptions were made to create this leakage scenario. It was assumed that the cement was tight and had a permeability value of 0.001 mD. Also, the cement sheath had a microannulus gap of 70 μm.
The duration of the pressure test was 30 min. The pressure test was conducted at 900 psi for 30 min without any leak indication. Figure 12 shows the gas flow rate with time for a test duration of 150 min pressure test. It can be observed that the gas starts flowing after almost 75 min. This implies that a 30 min pressure test may not have been enough to reveal any significant leak for a 300 ft overlap. Therefore, the pressure duration should be at least 90 min for a cement column length greater or equal to 300 ft in the casing/liner overlap. This model can assess the risk in the well design by feeding the model with the required data.
Figure 12.
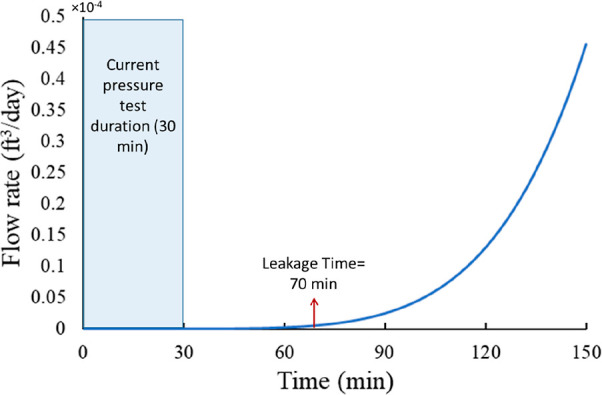
Gas flow rate with time during the pressure test conducted on the casing/liner overlap.
6. Conclusions
This study presents a gas leakage model that considers the existence of the microannulus in the cement sheath. Also, it discusses the findings from this modeling study and the impact of several parameters on the leakage time. The outcome of this research can benefit the oil and gas industry. The developed numerical model can be used as a tool for risk assessment in well design. This model can generate leakage scenarios and find the optimum liner overlap length that can be used for specific conditions. This will keep the environment safe and clean by mitigating gas migration to freshwater formations and surfaces. It will also save time and money, and it will ensure the safety of the crew and the integrity of the well. The constructed scenarios based on the developed numerical model revealed that:
The cement matrix permeability, microannulus gap size, and cement length can highly impact the leakage time.
Cement porosity has a minimal effect on the leakage time assuming other parameters are constant.
Modeling results revealed that the casing/liner overlap length should not be less than 300 ft.
It is recommended that the model is used to develop leakage scenarios to investigate the critical length of the casing/liner overlap based on the well conditions. The optimum casing/liner overlap length might vary depending on several parameters, such as the depth at which the liner is set, the anticipated pressure of the kick, and the properties of the cement sheath and microannulus.
Based on the leakage scenarios and the selected assumptions, it is recommended that the pressure test duration is increased beyond 30 min, depending on the cement column length in the casing/liner overlap. As shown from Figure 11, the dashed red horizontal line (which represents 90 min) is the proposed pressure test duration for a cement column length that is greater or equal to 300 ft in the casing/liner overlap. The proposed test duration is based on the assumptions made to develop the leakage scenarios. This duration can be investigated using the numerical model developed in this study and can be optimized depending on the conditions of the well to be tested.
Two of the parameters investigated in this article can be controlled to mitigate and prevent underground blowout and/or contamination of freshwater zones in case of getting a kick. These parameters are the cement matrix permeability and casing/liner overlap length. Cement matrix permeability can be controlled by using additives that lower the permeability of the cement and make it more intact. A longer casing/liner overlap length helps in increasing the leakage time, hence providing more time to detect and control gas kicks.
Acknowledgments
The authors would like to thank Jeff McCaskill and George Kwatia at The University of Oklahoma and Dr. Chinedum Ezeakacha at University of Louisiana Lafayette for their help and support in performing the experiments.
Glossary
Nomenclature
- °C
degree Celsius
- °F
degree Fahrenheit
- ρ
fluid density
- μ
micro/viscosity
- 2D
two dimensional
- 3D
three dimensional
- ϕ
porosity
- API
American Petroleum Institute
- BOP
blowout preventer
- BSEE
Bureau of Safety and Environmental Enforcement
- cc
cubic centimeter
- cm
centimeter
- CO2
carbon dioxide
- cP
centi-Poise
- Cf
fluid compressibility
- Cr
cement compressibility
- Ct
total compressibility
- Dx
distance between grids
- ft
foot
- ft3
cubic feet
- GoM
Gulf of Mexico
- h
hours
- inch
inches
- k
permeability
- k
permeability tensor
- kma
microannulus permeability
- L
length
- M
gas molecular weight
- m
meters
- m2
square meters
- mD
milli-Darcy
- min
minutes
- mL
milli-liters
- n
normal vector
- N2
nitrogen gas
- NORSOK
The Norwegian Shelf’s Competitive Position
- Nx
number of grids
- OCS
outer continental shelf
- P&A
plug and abandonment
- Pin
inlet pressure
- Po
initial pressure
- Pout
outlet pressure
- psi
pounds per square inch
- psig
pounds per square inch gauge
- q
flow rate
- QC-FIT
quality control failure incident team
- R
universal gas constant
- SCP
sustained casing pressure
- scf
standard cubic feet
- sec
seconds
- T
temperature
- t
time
- u
velocity vector
- w
microannulus gap width
- z
gas compressibility factor
Appendix
Governing Equations
The diffusivity equation was used to develop the leakage model in the cement column. In this model, the pressure squared method was used to solve it numerically. In this section, a brief description on how this equation was utilized to model the leakage of gas is given. The diffusivity equation for the linear flow on cartesian coordinates is given by
| 1 |
For simplification, only the discretization in the x-direction is going to be explained in detail. The other terms in the other directions follow the same steps. First of all, the solution domain is defined as it is shown below in Figure A1.
Figure A1.

Solution domain with a control volume on the second grid point.
The number of grids (Nx) is given by
| 2 |
where L is the length of the x-direction and Dx is the distance between two grids. To solve the diffusivity equation, it will be discretized using the finite volume method. Pressure distribution along the points in the x-direction will be solved implicitly. Now, P2 inside the control volume in the dashed square will be solved. The diffusivity equation is to be integrated over the control volume as follows
| 3 |
| 4 |
At this point each term is solved individually as follows
| 5 |
where PE represents the pressure at the east direction, and it is P3 for this point. Pp represents the pressure at the middle of this grid, which is P2.
| 6 |
where Pw represents the pressure at the west direction, and it is P1 for this point. Then, the permeability for each point is calculated based on the geometric average
| 7 |
| 8 |
After that, eqs 5–8 are substituted in eq 4
| 9 |
where Pn+1 is the pressure at the new time step and Pn is the pressure at the previous time step. Then, more simplification by rearranging the previous equation is done
| 10 |
| 11 |
| 12 |
| 13 |
To simplify eq 10, new terms are introduced
| 14 |
| 15 |
where S represents the source term. The final equation is going to look like the following
| 16 |
This procedure is valid for all the interior grid points. For the example shown here, this procedure is only valid for P2 and P3. The procedure is quite different for the grid points adjacent to the boundary which are P1 and P4 in this example. To solve the grid point, Pw will be equal to Pin, and PE will be equal to P2 as shown in Figure A2. Pin is a constant in this situation, that is why the number of unknowns for this grid is going to reduce from three to two unknowns. In addition, because Pin is out of the domain, the permeability will go to infinity. Once this value is substituted in the geometric averaging equation, the average permeability will be
| 17 |
Figure A2.

Solution domain with a control volume on the first grid point.
Then, aw and the source terms become
| 18 |
| 19 |
| 20 |
| 21 |
Then, the final equation for the first grid point is going to be
| 22 |
After finding all the coefficients for each grid, it becomes easier to find the pressure distribution for all the grid points at different time steps. These coefficients are assigned to a matrix (A) and the source terms are assigned to a matrix (S) as follow
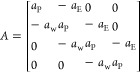 |
23 |
| 24 |
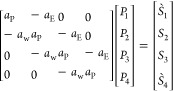 |
25 |
Finally, the pressure at each grid point can be calculated by inverting the matrix as follows
| 26 |
All the procedure presented in this section is for 1D diffusivity equation. For 2D and 3D, the procedure will be the same for the other directions. Each direction will have two new coefficients. In the model presented in this report, 2D diffusivity equation was used. For the y-direction, (aN) and (aS) were used as the coefficients for this direction, where (aN) and (aS) stand for the north and south coefficients, respectively. (aT) and (aB) were used for the z-direction, where (aT) and (aB) stand for the top and bottom coefficients, respectively.
Author Contributions
The manuscript was written through contributions of all authors.
The authors declare no competing financial interest.
References
- Kiran R.; Teodoriu C.; Dadmohammadi Y.; Nygaard R.; Wood D.; Mokhtari M.; Salehi S. Identification and evaluation of well integrity and causes of failure of well integrity barriers (A review). J. Nat. Gas Sci. Eng. 2017, 45, 511–526. 10.1016/j.jngse.2017.05.009. [DOI] [Google Scholar]
- Murray S. J.; Williamson M. D.; Gilham S.; Thorogood J. L.. Well design for shallow gas. SPE/IADC Drilling Conference; Amsterdam, Netherlands, 1995.
- Kwatia G. O.; Al Ramadan M.; Salehi S.; Teodoriu C.. Enhanced cement composition for preventing annular gas migration. ASME 2019 38th International Conference on Ocean, Offshore and Arctic Engineering; Polar and Arctic Sciences and Technology; Petroleum Technology: Glasgow, Scotland, U.K., 2019; Vol. 8. June 9–14, V008T11A067.
- Renpu W.Chapter 5-production casing and cementing. Advanced Well Completion Engineering, 3rd ed.; Gulf Professional Publishing, 2011; pp 221–294. [Google Scholar]
- Ajayi T.; Gupta I. A review of reactive transport modeling in wellbore integrity problems. J. Pet. Sci. Eng. 2019, 175, 785–803. 10.1016/j.petrol.2018.12.079. [DOI] [Google Scholar]
- Crow W.; Carey J. W.; Gasda S.; Brian Williams D.; Celia M. Wellbore integrity analysis of a natural CO2 producer. Int. J. Greenhouse Gas Control 2010, 4, 186–197. 10.1016/j.ijggc.2009.10.010. [DOI] [Google Scholar]
- Ahmed S.Evaluation of Liner Hanger Seal Assembly and Cement Sheath as a Dual Barrier System: Implications for Industry and Regulators; University of Oklahoma: Norman, Oklahoma, 2020. [Google Scholar]
- Ahmed S.; Patel H.; Salehi S. Effects of wait on cement, setting depth, pipe material, and pressure on performance of liner cement. J. Pet. Sci. Eng. 2021, 196, 108008. 10.1016/j.petrol.2020.108008. [DOI] [Google Scholar]
- Moore M. J.; Campo D. B.; Hockaday J.; Ring L.. Expandable liner hangers: Case histories. Offshore Technology Conference: Houston, Texas, 2002.
- BSEE . QC-FIT Evaluation of Seal Assembly & Cement Failures Interim Summary of Findings; Bureau of Safety and Environmental Enforcement, 2014.
- Al Ramadan M.; Salehi S.; Kwatia G.; Ezeakacha C.; Teodoriu C. Experimental investigation of well integrity: Annular gas migration in cement column. J. Pet. Sci. Eng. 2019, 179, 126–135. 10.1016/j.petrol.2019.04.023. [DOI] [Google Scholar]
- Corina A. N.; Opedal N.; Vrålstad T.; Sangesland S.. Cement plug sealing studies of silica cement systems. ASME 2019 38th International Conference on Ocean, Offshore and Arctic Engineering; Polar and Arctic Sciences and Technology; Petroleum Technology: Glasgow, Scotland, U.K., 2019; Vol. 8. 9–14 June, V008T11A056.
- Stormont J. C.; Fernandez S. G.; Taha M. R.; Matteo E. N. Gas flow through cement-casing microannuli under varying stress conditions. Geomech. Energy Environ. 2018, 13, 1–13. 10.1016/j.gete.2017.12.001. [DOI] [Google Scholar]
- Xu R.; Wojtanowicz A. K. Pressure buildup test analysis in wells with sustained casing pressure. J. Nat. Gas Sci. Eng. 2017, 38, 608–620. 10.1016/j.jngse.2016.12.033. [DOI] [Google Scholar]
- Rocha-Valadez T.; Hasan A. R. R.; Mannan S.; Kabir C. S. S. Assessing wellbore integrity in sustained-casing-pressure annulus. SPE Drill. Complet. 2014, 29, 131–138. 10.2118/169814-pa. [DOI] [Google Scholar]
- Tao Q.; Checkai D.; Bryant S.. Permeability estimation for large-scale potential CO2 leakage paths in wells using a sustained-casing-pressure model. SPE International Conference on CO2 Capture, Storage, and Utilization; Louisiana: New Orleans, USA, 2010.
- Aas B.; Sørbø J.; Stokka S.; Saasen A.; Statoil R. G.; Lunde Ø.; Phillips C.; Vrålstad T.. Cement placement with tubing left in hole during plug and abandonment operations. IADC/SPE Drilling Conference and Exhibition; Fort Worth, Texas, USA, 2016.
- Ahmed S.; Salehi S.; Ezeakacha C. P.; Teodoriu C. Evaluation of liner hanger seal assembly and cement sheath as a dual barrier system: Implications for industry standards. J. Pet. Sci. Eng. 2019, 178, 1092–1103. 10.1016/j.petrol.2019.04.017. [DOI] [Google Scholar]
- Al Ramadan M.; Salehi S.; Ezeakacha C.; Teodoriu C. Analytical and experimental investigation of the critical length in casing–liner overlap. Sustainability 2019, 11, 6861. 10.3390/su11236861. [DOI] [Google Scholar]
- Yodsudjai W.; Wang K. Chemical shrinkage behavior of pastes made with different types of cements. Constr. Build. Mater. 2013, 40, 854–862. 10.1016/j.conbuildmat.2012.11.053. [DOI] [Google Scholar]
- Chenevert M. E.; Shrestha B. K. Chemical shrinkage properties of oilfield cements. SPE Drill. Eng. 1991, 6, 37–43. 10.2118/16654-pa. [DOI] [Google Scholar]
- Stiles D.Annular formation fluid migration. In Well Cementing, 2nd ed.; Nelson E. B., Guillot D., Eds.; Schlumberger, 2006. [Google Scholar]
- Bois A.; Vu M.; Galidiolo G.; Badalamenti A.. Use of advanced gas migration model to optimize zonal isolation. AADE National Technical Conference and Exhibition; Houston, Texas, 2017.
- Carter G.; Slagle K. A study of completion practices to minimize gas communication. J. Pet. Technol. 1972, 24, 1170–1174. 10.2118/3164-pa. [DOI] [Google Scholar]
- Carter L. G.; Evans G. W. A study of cement-pipe bonding. J. Pet. Technol. 1964, 16, 157–160. 10.2118/764-pa. [DOI] [Google Scholar]
- Kremieniewski M.; Rzepka M.. Przyczyny i skutki przepływu gazu w zacementowanej przestrzeni pierścieniowej otworu wiertniczego oraz metody zapobiegania temu zjawisku. ROK LXXII, 2016; Vol. 72, pp 722–728.
- Kremieniewski M.; Błaż S.; Stryczek S.; Wiśniowski R.; Gonet A. Effect of cleaning the annular space on the adhesion of the cement sheath to the rock. Energies 2021, 14, 5187. 10.3390/en14165187. [DOI] [Google Scholar]
- Dubash N.; Frigaard I. Conditions for static bubbles in viscoplastic fluids. Phys. Fluids A 2004, 16, 4319–4330. 10.1063/1.1803391. [DOI] [Google Scholar]
- Stewart R. B.; Schouten F. C. Gas invasion and migration in cemented annuli: Causes and cures. SPE Drill. Eng. 1988, 3, 77–82. 10.2118/14779-pa. [DOI] [Google Scholar]
- Pinto G. H. V. P.; Martins A.; Rocha J.; Martinelli A. New methodology for gas migration prediction before oilwell cementing. Braz. J. Pet. Gas 2012, 6, 67. 10.5419/bjpg2012-0006. [DOI] [Google Scholar]
- Webster W. W.; Eikerts J. V.. Flow after cementing: A field and laboratory study. SPE Annual Technical Conference and Exhibition; Las Vegas, Nevada, 1979.
- Ladva H. K. J.; Craster B.; Jones T. G. J.; Goldsmith G.; Scott D. The cement-to-formation interface in zonal isolation. SPE Drill. Complet. 2005, 20, 186–197. 10.2118/88016-pa. [DOI] [Google Scholar]
- Bybee K. The cement-to-formation interface in zonal isolation. J. Pet. Technol. 2005, 57, 41–44. 10.2118/0805-0041-jpt. [DOI] [Google Scholar]
- Bois A.-P.-P.; Garnier A.; Rodot F.; Saint-Marc J.; Aimard N. How to prevent loss of zonal isolation through a comprehensive analysis of microannulus formation. SPE Drill. Complet. 2011, 26, 13–31. 10.2118/124719-pa. [DOI] [Google Scholar]
- Bois A.-P.; Garnier A.; Galdiolo G.; Laudet J.-B. Use of a mechanistic model to forecast cement-sheath integrity. SPE Drill. Complet. 2012, 27, 303–314. 10.2118/139668-pa. [DOI] [Google Scholar]
- Sutton D. L.; Paul R.; Sabins F. L.. New evaluation for annular gas-flow potential. Oil Gas J. 1984, 82(). [Google Scholar]
- Wilkins R. P.; Free D.. A new approach to the prediction of gas flow after cementing. SPE/IADC Drilling Conference; New Orleans, Louisiana, 1989.
- Al Ramadan M.Experimental, analytical, and numerical investigations of gas leakage through annular cement. PhD Dissertation, University of Oklahoma, Norman, Oklahoma, 2020. [Google Scholar]
- Stormont J. C.; Ahmad R.; Ellison J.; Reda Taha M. M.; Matteo E. N.. Laboratory measurements of flow through wellbore cement-casing microannuli. 49th U.S. Rock Mechanics/Geomechanics Symposium; San Francisco, California, 2015.
- Gomez S. P.; Sobolik S. R.; Matteo E. N.; Reda Taha M.; Stormont J. C. Investigation of wellbore microannulus permeability under stress via experimental wellbore mock-up and finite element modeling. Comput. Geotech. 2017, 83, 168–177. 10.1016/j.compgeo.2016.10.001. [DOI] [Google Scholar]
- Opedal N.; Corina A. N.; Vrålstad T.. Laboratory test on cement plug integrity. ASME 2018 37th International Conference on Ocean, Offshore and Arctic Engineering; Polar and Arctic Sciences and Technology; Petroleum Technology, 2018; Vol. 8. V008T11A071.
- Corina A. N.; Opedal N.; Vrålstad T.; Skorpa R.; Sangesland S. The effect of casing-pipe roughness on cement-plug integrity. SPE Drill. Complet. 2020, 35, 237–251. 10.2118/194158-pa. [DOI] [Google Scholar]
- Kremieniewski M.; Wiśniowski R.; Stryczek S.; Orłowicz G. Possibilities of limiting migration of natural gas in boreholes in the context of laboratory studies. Energies 2021, 14, 4251. 10.3390/en14144251. [DOI] [Google Scholar]
- Xu R.; Wojtanowicz A. K.. Diagnostic testing of wells with sustained casing pressure-an analytical approach. Canadian International Petroleum Conference; Calgary, Alberta, 2003.
- Huerta N.; Checkai D.; Bryant S.. Utilizing sustained casing pressure analog to provide parameters to study CO2 leakage rates along a wellbore. SPE International Conference on CO2 Capture, Storage, and Utilization; San Diego, California, USA, 2009.
- Tao Q.; Checkai D.; Huerta N.; Bryant S.. Model to predict CO2 leakage rates along a wellbore. SPE Annual Technical Conference and Exhibition; Florence, Italy, 2010.
- Ford E. P.; Moeinikia F.; Lohne H.; Arild Ø.; Majoumerd M. M.; Fjelde K. K.. Leakage calculator for plugged and abandoned wells. SPE Bergen One Day Seminar; Bergen, Norway, 2017.
- Al Ramadan M.; Salehi S.; Teodoriu C.. Robust leakage modeling for plug and abandonment applications. ASME 2019 38th International Conference on Ocean, Offshore and Arctic Engineering; Polar and Arctic Sciences and Technology; Petroleum Technology: Glasgow, Scotland, U.K., 2019; Vol. 8. 9–14 June, V008T11A054.
- Lee W. J.; Wattenbarger R. A.. Gas Reservoir Engineering; Society of Petroleum Engineers, 1996. [Google Scholar]
- Koenders E. A. B.; van Breugel K. Numerical modelling of autogenous shrinkage of hardening cement paste. Cem. Concr. Res. 1997, 27, 1489–1499. 10.1016/s0008-8846(97)00170-1. [DOI] [Google Scholar]
- API BULLETIN E3 . Environmental Guidance Document: Well Abandonment and Inactive Well Practices for US Exploration and Production Operations, 1st ed.; Washington, DC, 1993.
- Ichim A.Experimental Determination of Oilfield Cement Properties and their Influence on Well Integrity; University of Oklahoma, 2017. [Google Scholar]
- Boukhelifa L.; Moroni N.; James S. G.; Le Roy-Delage S.; Thiercelin M. J.; Lemaire G.. Evaluation of cement systems for oil and gas well zonal isolation in a full-scale annular geometry. IADC/SPE Drilling Conference; Dallas, Texas, 2004.
- Omosebi O.Mechanical Degradation of Well Cement in HPHT Carbonic Acid Environment: Experimental Studies and Mathematical Modeling; University of Oklahoma: Narman, OK, 2016. [Google Scholar]
- Al Ramis H.; Teodoriu C.; Bello O.; Al Marhoon Z. High definition optical method for evaluation of casing - cement microannulus (CCMA). J. Pet. Sci. Eng. 2020, 195, 107719. 10.1016/j.petrol.2020.107719. [DOI] [Google Scholar]
- What are the Requirements for Pressure Testing Liners?; Dallas, TX, 2004. CFR 250.425.