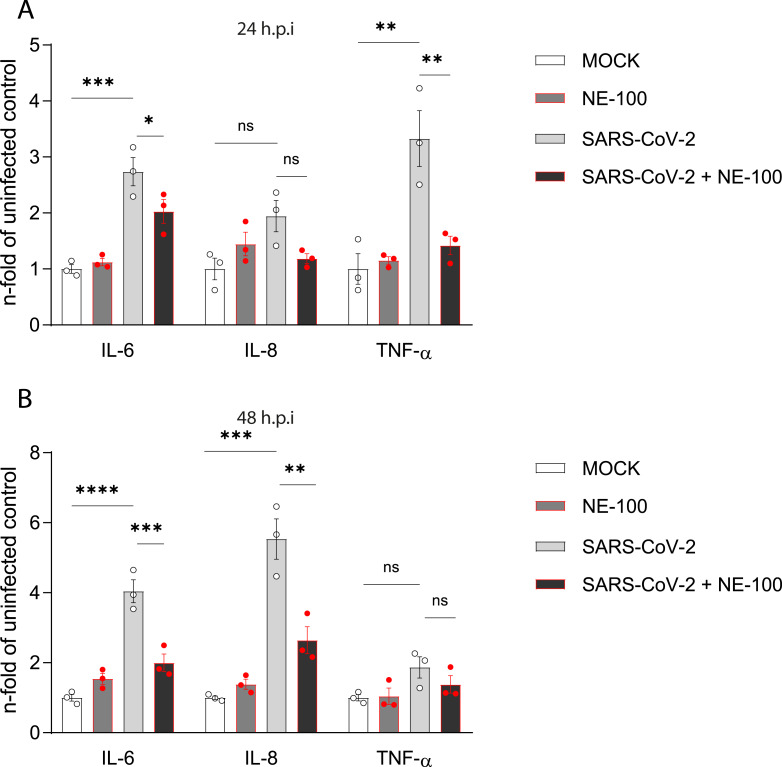
Figure 3. NE-100 decreases cytokine release that follows SARS-CoV-2 infection in hiPSC-CMs.
(A and B) hiPSC- hiPSC-CMs were pre-treated or not with NE-100 1 µM and infected with SARS-CoV-2. Supernatants were analyzed by ELISA for IL-6, IL-8 and TNF-α at 24 h.p.i (IL-6 p = 0.0006 and p = 0.0395; IL-8 p = 0.0661 and p = 0.1426; TNF-α p = 0.0033 and p = 0.0077) (A) and 48 h.p.i (IL-6 p < 0.0001 and p = 0.0009; IL-8 p = 0.0001 and p = 0.0017; TNF-α p = 0.1663 and p = 0.5359) (B) (N = 3). Data were normalized to the mean control value of each experiment and represents the mean ± SEM of fold increase, analyzed by ordinary one-way ANOVA with Holm-Sidak’s post-hoc. Data points represent independent experiments. * p < 0.05; ** p < 0.01; *** p < 0.001; **** p < 0.0001. p < 0.0001.

