Abstract
We present a new analytical platform that uses a tilted stage (60°) integrated to the Peltier cooling stage interfaced with an Environmental Scanning Electron Microscope (ESEM) to directly observe and assess the phase state of particles as a function of RH at a controlled temperature. Three types of organic particles have been studied: (a) Suwannee River Fulvic Acid (SRFA) particles, (b) lab generated soil organic particles, and (c) field-collected ambient particles. The chemical composition, morphology, and functional groups of individual particles were probed using computer-controlled scanning electron microscopy with energy-dispersive X-ray spectroscopy (CCSEM/EDX) and scanning transmission X-ray microscopy with near-edge X-ray absorption fine structure spectroscopy (STXM/NEXAFS). Results show that all three types of particles are organic-rich, but soil organic particles and ambient particles contain a considerable amount of inorganic species. The phase state can be determined based on the particle's aspect ratio (particle width/height), which we proposed for solid, semisolid, and liquid particles are 1.00–1.30, 1.30–1.85, and >1.85, respectively. We found that solid SRFA particles transition to a semisolid state at ∼90% RH and to the liquid state at ∼97% RH, in agreement with the literature. The solid soil organic particles transition to a semisolid state at ∼85% RH and to the liquid state at ∼97% RH. The solid ambient organic particles transition to a semisolid state at ∼65% RH and the liquid state at ∼97% RH. Our results indicate that this new platform can directly observe and quantitatively indicate the phase transition of field-collected particles under different ambient conditions.
We present a new analytical platform that uses a tilted and Peltier cooling stage interfaced with an environmental scanning electron microscope to directly observe and assess the phase state of individual particles as a function of relative humidity.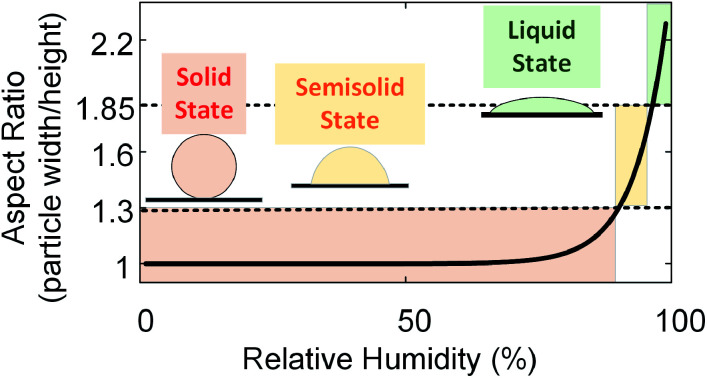
Introduction
Organic aerosol particles contribute ∼20–50% to the total atmospheric fine particle mass at continental mid-latitudes1 and as high as 90% in tropical forest areas.2 They have important but poorly constrained climate effects.3,4 One reason is they are composed of materials exhibiting a wide range of viscosities, as a result of which, they exhibit solid (viscosity >1012 Pa s), semisolid (102–1012 Pa s), or liquid (<102 Pa s) states.5–7 The viscosity of these particles depends on their source (e.g., combustion, atmospheric oxidation), material properties (e.g., hygroscopicity, oxidation states, molecular weight), and environmental factors (e.g., relative humidity, temperature).6,8–11 For example, hygroscopic particles uptake water at high relative humidity (RH), due to which they undergo changes in their viscosity and, therefore, the phase transformation from solid to semisolid and liquid state.12 Other way around, viscosity and phase state of particles affect several important atmospheric processes such as cloud condensation,12,13 pollution transport (carcinogenic compound such as polycyclic aromatic hydrocarbons can be trapped within solid particles and long-range transported),8,14 growth rate during gas–particle partitioning (slower rate for more viscous particle),15 heterogeneous ice nucleation (more viscous/solid particle can promote ice formation),5,16,17 mixing state of soot with organic particle,18 and evolution of organic particles' optical properties by affecting their reactivity and heterogeneous reaction rate (reactivity lower and reaction rate slower if more viscous/solid).19–24
Several direct and indirect techniques have been developed to measure the viscosity of atmospherically relevant submicron-sized particles and determine their phase states. Virtanen et al. presented the first evidence for the existence of organic aerosols in the amorphous solid state by measuring the bounce factor of particles.6 This technique was based on the fact that semisolid or liquid particles adhere to the hard surface upon impaction, while solid particles bounce off.6,25–29 Renbaum-Wolff et al. used poke flow and bead tracking techniques to directly measure the viscosity of the particles ranging from solid to liquid state.22 Hosny et al. used the fluorescence lifetime imaging (FLIM) technique to investigate the changes in the viscosity of SOA particles, and they reported substantial decreases in the viscosity with increasing RH and time of atmospheric oxidation.30 However, these techniques are limited to large particles or aerosol material masses and could not be extended to the sub-micron size range. Viscosity and phase state of nanoparticles has been assessed based on dimer coalescence,31–35 but this technique is limited by narrow accessible viscosity range (105–108 Pa s). Moreover, these techniques mentioned above are mainly designed based on surrogates of ambient particles, making it a challenge to apply them in the direct measurements of ambient aerosol particles viscosity.5 Furthermore, it is challenging to deploy online viscosity measurement techniques in remote sampling sites since aerosol concentration is typically low. There are very limited studies that reported remote site measurements of phase states of ambient particles. Liu et al.36 and Bateman et al.37,38 used a three-arm particle impactor apparatus to investigate the ambient particle phase state by measuring particle rebound fraction.
In recent years, efforts are being made to develop techniques involving offline analysis of phase states of particles collected on the substrate to eliminate the issue of low particle concentration and direct measurement of phase state. Lee et al. used atomic force microscopy to obtain Young's modulus and surface tension profiles of sub-micron size sucrose particles collected on the substrate as a function of RH.39 These parameters provided the assessment of the phase state of the particles. While this technique allows directly probing the aerosol particles in an atmospherically relevant size range, it is time-consuming and limits the statistics needed to represent the phase state of the particle population. In recent developments, tilt-angle scanning electron microscopy (SEM) is used to visualize the deformation particles undergo upon their impaction on the substrate, which can be used to categorize the phase state of particles.18,40,41 The tilt view SEM technique can measure particles with diameter ranges from 0.3–2 μm and viscosity ranges from 10−1 to 1012 Pa s under ambient condition.40 However, this technique is currently limited to qualitatively indicator phase state transition of sub-micron size particles.
Here, we present a new experimental platform feasible for directly observing and quantitatively indicating the phase state of particles as a function of RH. Investigation of viscosity change upon humidification can also be achieved using the platform with necessary modification, which will be our future research topic. This platform uses an environmental cell coupled with a Peltier cooling stage and scanning transmission electron microscopy (STEM) detector integrated into an environmental scanning electron microscope (ESEM). Compared to other techniques, ESEM provides a high throughput analysis. This platform is helpful in obtaining acceptable statistics to represent particle population and allows us to monitor the phase state of the particles under controlled RH conditions. However, one limitation is investigating highly volatile material because these compounds will vaporize when the chamber operates under the vacuum condition (1.2 × 10⁻⁶ torr pressure). In this study, we demonstrate the use of the new analytical platform to examine the influence of RH on the phase state of three types of particles: (a) Suwannee River Fulvic Acid (SRFA), which was widely used in the literature as a reasonable model for atmospheric Humic-Like Substances (HULIS),42–47 an important component of organic particles,3,4 with known material properties, (b) lab-generated soil organic particles under controlled conditions, which can absorb light from 200 to 1200 nm wavelength,48 (c) organic-rich ambient particle samples collected from West Bengal, India.49 All particles analyzed in this study were organic-rich and were in solid state at dry condition (spherical shape).
Experimental section
A novel platform for monitoring phase state changes in sub-micron particles
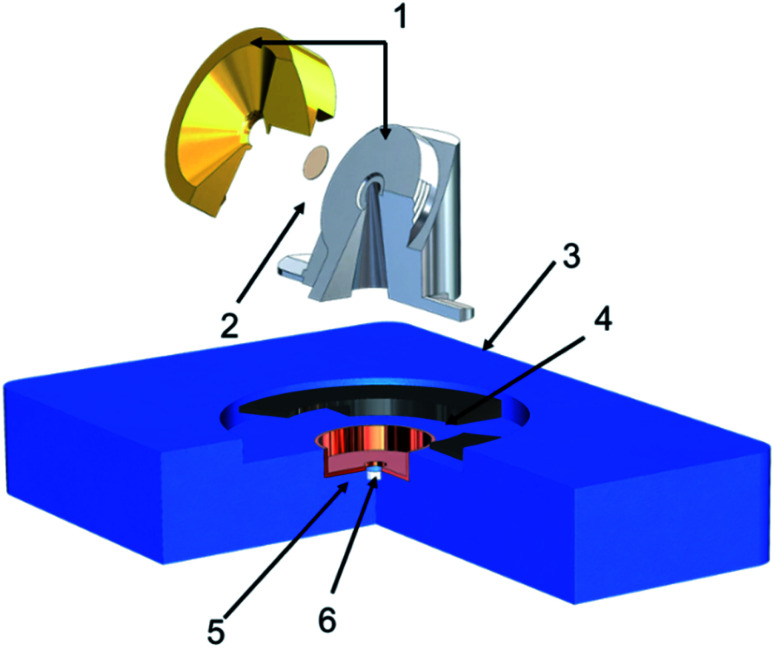
Our experimental design aimed at utilizing tilted view imaging combined with Environmental Scanning Electron Microscopy (ESEM, Quanta 3D, Thermo Fisher), which provides direct observation of changes in particle phase state as a function of RH and temperature, allowing us to indicate transition of phase state of particles. Fig. 1 shows the schematic of the new imaging platform. Our platform is equipped with a Peltier stage for temperature control (263 K to 303 K), a chamber humidifier in the combination of a STEM detector in ESEM allows imaging at controlled RH from 0% to 100% with an error less than ±1% RH. Since this study focuses on qualitatively tracking the phase state changes due to different RH, the temperature was maintained at 278 K based on our calibration. It is worth further investigating the influence of the temperature on the particle viscosity and phase state. The sample holder that could be mounted to the Peltier platform was designed with an in-built tilt of 60°. This sample holder is a two-part assembly. The base part is made of steel mounts to the platform, while the brass cap is designed to hold the grid. The holder is thermally and electrically conductive to maintain the temperature and avoid charging. Passage drilled under the grid allows the electron beam to pass through the sample and be detected by the STEM detector. STEM detector, located below the sample, collects the electron beam transmitted from the sample; this, in turn, enables seeing through the particles and keeping track of phase state heterogenicity that particle may go through with changes in environmental parameters. The holder's height and diameter were optimized to reach the shortest working distance possible (10 mm) and avoid beam scattering from holder edges. The technique utilizes tilt imaging (at 60°) to obtain the side view of the sample particles obtained by the STEM detector. The STEM detector allows the detection of electrons transmitted through the sample.
Fig. 1. Schematic showing the design of the modified grid holder mountable on Peltier stage (blue part). Numbers indicate (1) holder (2) TEM grid (3) holder mount (4) conducting base (5) STEM detector (6) Peltier stage.
Particle generation
SRFA particles were generated using a medical nebulizer (8900-7-50, Salter Labs, Inc.) by nebulizing 1 ml of ∼1 wt% SRFA solution with nitrogen flow at 5 min−1. The SRFA solution was prepared by dissolving SRFA (1S101F, International Humic Substance Society) in deionized water. Soil organic particles were generated by nebulizing treated soil organic aqueous solution. The untreated soil organic aqueous solution was collected from a puddle after rain events in the agricultural field at the Southern Great Plains site in Oklahoma.50 The untreated aqueous solution was filtered using PTFE membrane filters (Whatman, 0.45 μm pore size) to remove undissolved particles. The filtered solution was then concentrated to one-quarter of the original volume by heating at 353 K. The concentrated filtered solution was then dialyzed (12 000–14 000 Da MWCO, Ward's Scientific) against deionized water replaced at 2, 6, 18, and 36 h. Before use, the dialysis membrane was washed in a 0.02 M sodium bicarbonate solution at 333 K to remove residual sulfides. The dialysis tubing was then washed with deionized water and agitated overnight to remove residual soluble compounds present. We used sodium chloride (NaCl) particles for calibration purposes. NaCl particles were generated by nebulizing 1 ml of NaCl solution at 0.5 wt% concentration with a nitrogen flow of 5–6 lpm. Nebulized SRFA particles, soil organic particles, and salt particles were conditioned to dry conditions (<5% RH) using a diffusion dryer (model 306200, TSI, Inc.). Dried particles were subsequently deposited onto TEM grids (Tedpella, B-film) arranged on the 6th and 7th stage (aerodynamic size range 0.32–0.56 μm) of a Micro-Orifice Uniform Deposit Impactor (MOUDI, model 110R, MSP, Inc.). The ambient aerosol particles were collected from a rural site in West Bengal, India,49 collected on stage D (cutoff 0.25 μm) of a four-stage Sioutas Cascade Impactor (SKC). Samples were collected on carbon type-B films TEM grids (Ted Pella) with a flow rate of 9 lpm for 20 min. The hydrophobic TEM grids are commonly used in aerosol research to avoid bias of water uptake from the substrates. Liquid organic particles will transform to a flat shape upon impaction on the substrate surface (see Fig. S3 in ESI†). Using a different substrate might change the surface tension between the particle surface and substrate surface tension, thus, leading to a different shape of liquid particle on the substrate.51 More than one thousand particles of each sample were analyzed to get representative results.
Microscopy image acquisition and processing
The microscopy images were captured in ESEM mode using both Scanning Transmission Electron Microscopy (STEM) detector and Gaseous Secondary Electron Detector (GSED) simultaneously. Since GSED images became noisy with increasing RH, STEM images were used for analysis. To obtain the morphological profile of the particles with changing RH, we mounted samples one by one on the novel platform. Selected areas on the sample were exposed to secondary electron and gradually increasing RH at an interval of 5–10% RH, and STEM images were collected. For each sample discussed in this study, 5 imaging areas with good particle loading and close to each other were selected, and their positions were saved so that we will not lose their position when we move between each area. The beam was deflected to spots other than the predefined 5 spots. RH was controlled at the desired level. Measurements were performed after the system has been stabilized for about 2 min. The image of each predefined spot was taken after parking the beam at each spot for 2 minutes. SEM was operated at 20 kV, 480 pA current, and a working distance of 10 mm. The microscope was operated in ESEM mode during imaging, allowing imaging at high pressure arising due to chamber humidification and water vapor pressure ranging from 0.08–6.50 torr (corresponds to 0–100% RH at 278 K). Water vapor was generated by flowing ultra-pure nitrogen gas through a bubbler containing DI water. In this mode, imaging is restricted to low voltages (≤20 kV) to prevent potential charging of the sample due to higher voltage. Collected STEM images were analyzed with the ImageJ software, where we measured the height and width of the particles and then calculated their aspect ratio (width/height). Details of aspect ratio calculation are provided in the ESI.†
Particle analysis
We performed computer-controlled scanning electron microscopy with energy-dispersive X-ray (CCSEM/EDX) to characterize the morphology and elemental composition of individual soil organic particles and ambient particles collected on transmission electron microscopy grids.52 Measurements were carried out using an FEI Quanta digital field emission gun environmental SEM equipped with an EDX spectrometer (EDAX, Inc.). The EDX spectrometer allows X-ray detection of elements. Experiments were performed at 20 kV, 480 pA current. The SEM images give information about the physical properties of the particles, such as shape, morphology, and size (area equivalent diameter). From X-ray spectra, the relative atomic ratios of 15 elements (C, N, O, Na, Mg, Al, Si, P, S, Cl, K, Ca, Mn, Fe, Zn) of individual particles can be quantified, which can be used to determine the chemical composition of collected particles. We utilized scanning transmission X-ray microscopy with near-edge X-ray absorption fine structure (STXM/NEXAFS) spectroscopy at beamline 5.3.2 of the Advanced Light Source (ALS) at the Lawrence Berkley National Laboratory to probe the chemical bonding of carbon functional groups of all three types of particles. STXM uses a focused soft X-ray beam generated from the synchrotron light source. Multiple stacks of images were acquired by raster scanning the sample at fixed photon energy and recording the intensities of the transmitted X-rays at each pixel.53 STXM images were acquired using a 25 nm zone plate that focuses the monochromatic soft X-ray beam to spot size.
Results and discussions
Chemical imaging of particles
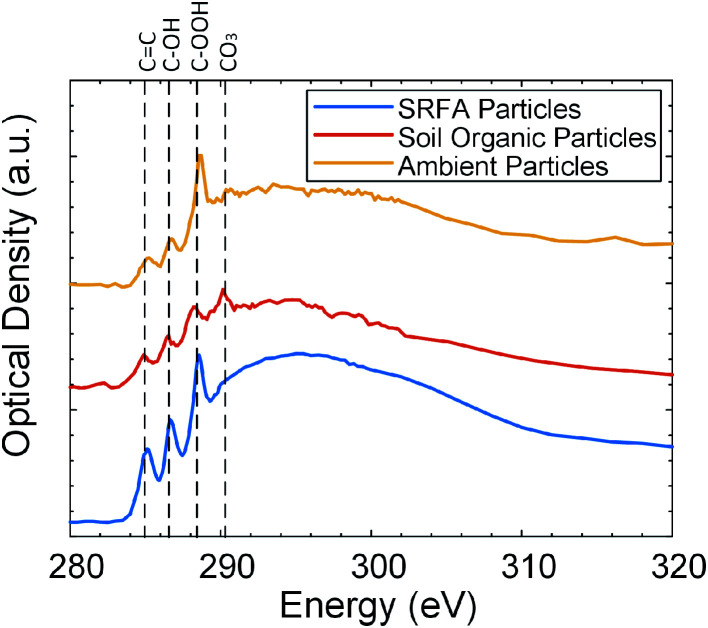
The viscosity of organic particles at the same temperature and RH determines their phase state54 and depends on the number of functional groups that the trend in viscosity increase with an additional functional group is COOH ≈ C–OH > C O > CH.31 Therefore, it is worthwhile to investigate the chemical composition and carbon bonding of organic particles. We performed microscopy and X-ray absorption spectroscopy to characterize the elemental composition and carbon bonding of each particle type (SRFA particles, soil organic particles, and field-collected ambient particles). Fig. 2 shows the STXM/NEXAFS carbon K-edge spectrum of three particle types. The relative abundances of seven peaks (C C, C O, CH, NH(C O), COOH, C–OH, and CO3) in each particle type were analyzed by performing spectral deconvolution and non-linear least-squares fitting of each peak associated with specific functionality to determine the area under each peak,55,56 and the results are shown in the Fig. S4.† As shown in Fig. 2, the STXM/NEXAFS spectrum of SRFA particles obtained in this study is similar to our previously reported spectrum.48,57 As shown in Fig. 2 and S4,† for both ambient particles and SRFA particles, the most intense peak is R–COOH (288.5 eV), followed by R(C O)/C–OH (286.5 eV), and then the C C sp2 (285.4 eV) peak, indication our SRFA particles and ambient particles are dominated by organic carbon. CO3 (290.4 eV) peak in the spectrum of soil organic particles is prominent, indicating that our soil organic particles contain inorganic species.55,58,59 The elemental composition of soil organic particles has been further investigated with CCSEM/EDX. As shown in Fig. S5,† soil organic particles are dominated by carbonaceous with Ca, suggesting the presence of soluble calcium carbonate. The CO3 peak also appears in the STXM/NEXAFS spectrum of ambient particles, but with a significantly smaller amount, indicating a relatively minor contribution of inorganic carbonate species in the ambient particles.55,58,59 Fig. S6† shows the overall CCSEM/EDX derived size-resolved particle composition of ambient particles, which are dominated by carbonaceous and mixed particles with potassium and sulfur. For this study, we only focus on the phase state of carbonaceous particles. Moreover, as shown in Fig. S4,† the relative intensities of RCOOH, R(C O)/C–OH, and C C sp2 peaks of soil organic particles follow the same order as these of ambient particles and SRFA particles. Overall, STXM/NEXAFS spectrums show that all these particles are organic-rich, but soil organic particles and ambient particles contain fractions of inorganic species. Since SRFA contains the highest abundance of COOH functional groups and no inorganic species, we expect SRFA to have the highest viscosity at the same temperature and RH and need higher RH to transition from solid state to semisolid state.
Fig. 2. Carbon spectra comparison of Suwannee River Fulvic Acid (SRFA) particles (blue), soil organic particles (red), and field-collected ambient particles (yellow) inferred from STXM/NEXAFS.
Dynamic observation of phase state of laboratory-generated particles
We used the platform at different conditions to probe the dynamic changes in the shape of particles, which is a qualitative indicator of the phase state of particles. This is because transitioning the phase state from solid to liquid-like encourages the wetting of substrate by particle material, which results in the change of the shape. Prior to measurements, we validated the platform by performing the water uptake experiments on NaCl particles collected on TEM grids. Fig. S7† shows the images of NaCl particles collected at 1%, 60%, 70%, and 76% RH at 278 K. As indicated from the images, NaCl particles did not show any sign of water uptake until RH reached 76%, where we observed NaCl particle changing shape from cubic to spherical. This result is consistent with NaCl's deliquescence point at 278 K,60 thus, validating our method.
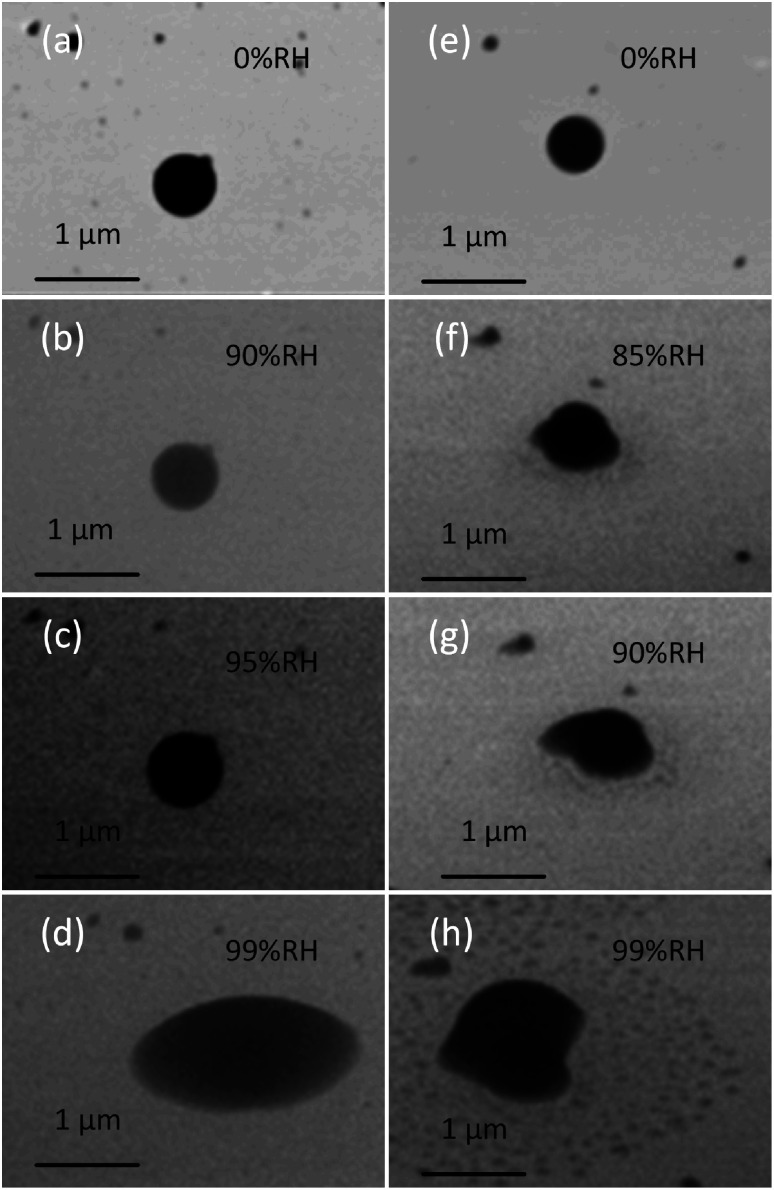
We applied this platform to observe the phase state directly by investigating the shapes of three types of particles at different RH, providing us a qualitative way to indicate the phase state of particles. Typically, solid, semi-solid, and liquid organic particles are spherical, dome-like shape, and flat shape, respectively, once they impact the surface of a substrate.5 This section focuses on the two lab-generated particles (SRFA particles and soil organic particles). These particles are selected because they maintain their spherical shape upon impaction on the substrate, suggesting their initial solid-phase state at dry condition prior to the measurements.5Fig. 3 shows the typical dynamic ESEM images of (a–d) SRFA particles and (e–h) soil organic particles at different RH. As shown in Fig. 3, both SRFA particle and soil organic particle start with spherical, indicating they are solid in dry condition. With increasing RH, the shape of particles changed from spherical to dome-like shape, and eventually to a flat shape, demonstrate the water uptake process that particles transfer from the solid state to the semisolid state (at ∼90% RH and ∼85% RH for SRFA and soil organic particles, respectively), and they eventually changed to the liquid state (at ∼97–99% RH for SRFA and soil organic particles).5 Moreover, at liquid state, the soil organic particle appears an irregular shape due to inorganic substances with ununiformed hygroscopicity and/or nanoparticles close to it, which were not visible before water uptake, thus, complicating the shape of liquid soil organic particles.
Fig. 3. Representative example images of dynamic observations of morphology changes as a result of water uptake by (a–d) SRFA particles (e–h) soil organic particles. These images show significant changes in the particle shape that could be observed directly by tilt view.
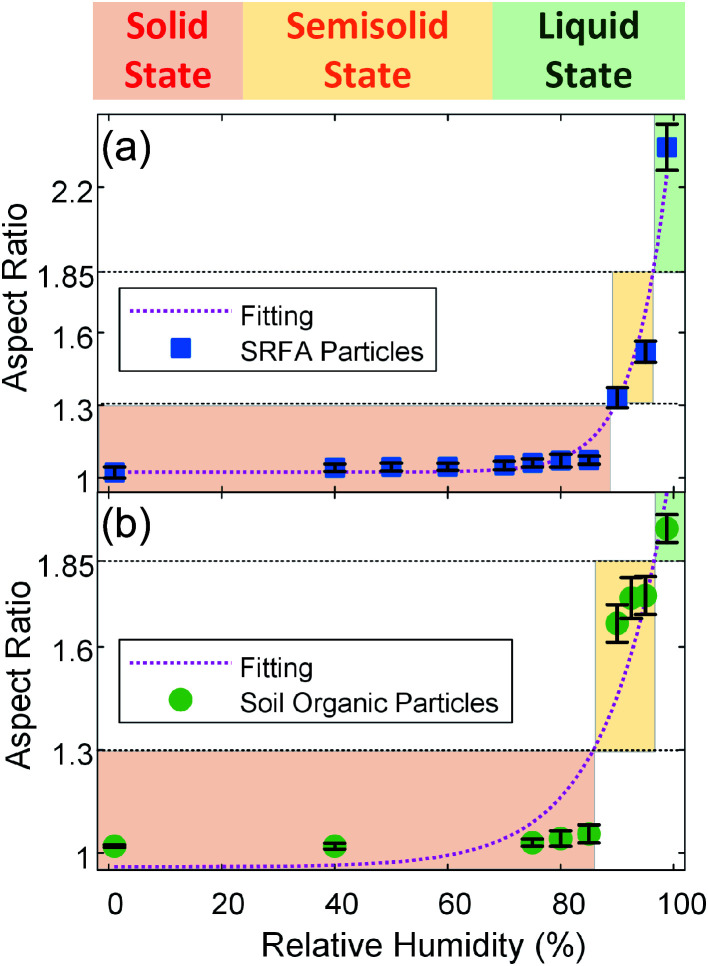
This newly-developed platform provides a quantitative indication of the changes in the phase state of particles by measuring their aspect ratios (particle width/height ratio) (see ESI†). Solid organic particles being minimally deformable, having aspect ratios ∼1.5,18,41 Changing the phase state of organic particles from solid (spherical) to semisolid (dome-like shape) and/or liquid states (flat shape) increases their deformability, and, hence, an aspect ratio larger than 1 is attained, making the aspect ratio an indicator of the phase state of organic particles.5,18,41 To quantify the aspect ratio of both types of particles, we carried out a subsequent analysis of these images. Fig. 4 shows the aspect ratio of the (a) SRFA particles and (b) soil organic particles, averaged over the number of particles, as a function of RH, providing additional evidence of phase change for both particle types. As shown in Fig. 4, the average aspect ratio of these two types of particles increases with increasing RH, which indicates the progressing water uptake and transitioning of phase state from initially solid state (aspect ratio ∼1) to semisolid and eventually change to liquid states (aspect ratio >1). Furthermore, aspect ratio and RH are well correlated and exhibit an exponential curve functional dependence (aspect ratio = A × exp(B × RH) + C) for both particle types.
Fig. 4. Aspect ratio of the (a) SRFA particles and (b) soil organic particles averaged over the number of particles (>100) analyzed. Error bars indicate the standard error. The shaded region corresponds to the different phase state (red: solid state; yellow: semisolid state; green: liquid state). The black dotted lines are proposed thresholds of aspect ratio where solid to semisolid transition (aspect ratio = 1.30) and semisolid to liquid transition (aspect ratio = 1.85) occur. The dotted magenta lines are an exponential-decay fit (SRFA particles: aspect ratio = 1.12 × 10⁻⁷ exp(0.16 RH) + 1.02, R2 = 0.9715; soil organic particles: aspect ratio = 1.59 × 10⁻⁴ exp(0.089 RH) + 0.96, R2 = 0.8558).
Specifically, the aspect ratios of SRFA particles are nearly identical below ∼89% RH, suggesting at 278 K, SRFA particles uptake a minimal amount of water and maintain a solid state over the range of RH. After this point, the aspect ratio of SRFA particles started to steeply increase, indicating rapid uptake of water and the phase transition from solid state to semisolid state. The RH where SRFA particle transition from solid state to semisolid state has been reported by several studies. For example, Brooks et al. reported that SRFA airborne with different diameters (50, 100, and 200 nm) at dry condition is almost no water uptake observed with RH increasing until ∼85% RH at room temperature.43 Svenningsson et al.,61 Hatch et al.,62 and Dinar et al.42 have further confirmed this by observing a sharp increase in SRFA airborne partials' size at ∼85% RH at room temperature. Since solid SRFA particle at lower temperature needs higher RH to transition to the semisolid state,47 our results of SRFA particles are in good agreement with the literature, indicating that our system can be used to qualitatively investigate the phase state change of particles due to RH change.
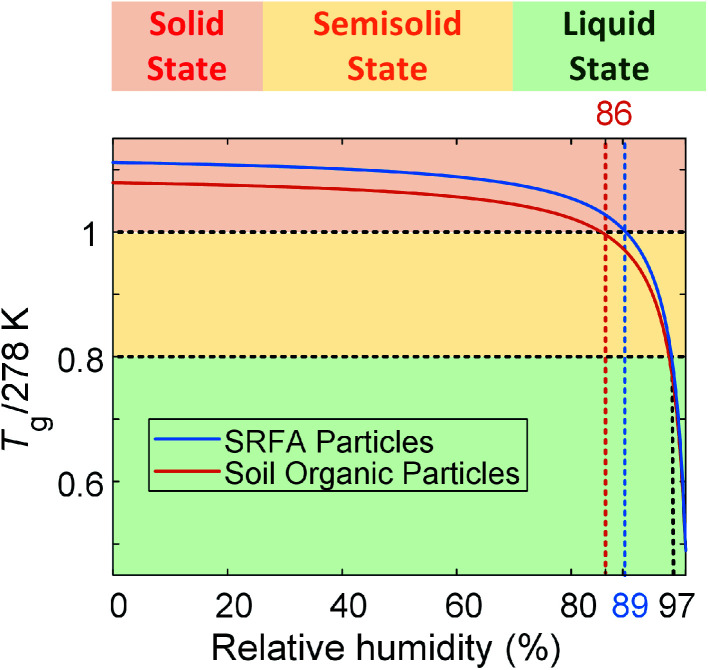
On the other hand, the transition from semisolid state to liquid state is not straightforward to indicate from the aspect ratio since the aspect ratio threshold for semisolid and liquid organic particles has not been reported in the literature. Therefore, we applied the ratio of the glass transition temperature (Tg), which is the temperature when a transition between solid and semisolid states occurs,9 to the measurement temperature (T, 278 K in this study) (Tg/T). The Tg/T has been suggested by Shiraiwa et al.11 and Schmedding et al.63 as a good indicator of the phase state of organic particles. They proposed that organic particles maintain solid state when Tg/T ≥ 1, semisolid state when 1 > Tg/T ≥ 0.8, and liquid state when Tg/T ≤ 0.8.11,63 Thus, we adopted the suggested thresholds of Tg/T to help us predict the phase state of particles. We calculated the Tg of SRFA particles as a function of RH9,47 (see ESI†). The Tg/T ratio as a function of RH was plotted in Fig. 5. As shown in Fig. 5, the Tg/T ratio of SRFA particles reaches 1 at ∼89% RH, suggesting SRFA particles transition from solid state to semisolid state when RH is ∼89%, consistent with our conclusion based on aspect ratio and results from other studies.42,47,61,62 The corresponding aspect ratio is 1.30. The Tg/T ratio decreased to 0.8 when RH increased to ∼97%, indicating that SRFA particles transition from semisolid state to liquid state at 97% RH and 278 K, resulting in the aspect ratio ∼1.85.
Fig. 5. Predicted glass transition temperature as a function of relative humidity for SRFA particles and soil organic particles. The calculation is shown in the ESI.†.
The change in aspect ratio for soil organic particles is not significant until ∼86% RH, indicating that soil organic particles are in solid state at 278 K below 86% RH. With increasing RH, we observed a sharp increase in the aspect ratio, indicating that soil organic particles were in the semisolid phase state. Like SRFA particles, we calculated the Tg of soil organic particles (see ESI†) and plotted Tg/T of soil organic particles as a function of RH (Fig. 5). We used the same thresholds of Tg/T introduced before to predict the phase state of soil organic particles. As shown in Fig. 5, at 278 K, soil organic particles transition from solid state to semisolid state at ∼86% RH, consistent with our conclusion based on aspect ratio, and the corresponding aspect ratio is 1.30. Compared with SRFA particles, soil organic particles phase transitions occur at the same aspect ratio (∼1.30) but lower RH. This is consistent with our expectation since soil organic particles contain inorganic composition (e.g., soluble potassium or sodium carbonate) and a lower abundance of COOH group (Fig. S4†), which decreases the RH where the phase transition of organic particles occurs.27,31,44 Moreover, soil organic particle transition from semisolid state to liquid state at ∼97% RH when Tg/T = 0.8, resulting in the aspect ratio of ∼1.85, consistent with that of SRFA particles. Thus, we propose that organic particles are in solid state when their aspect ratios are below 1.30, in semisolid state when their aspect ratios are between 1.30 and 1.85, and in liquid state when their aspect ratios are higher than 1.85. Therefore, our results of lab-generated particles indicate our setup of the custom-built tilted stage in combination with the ESEM is feasible for direct observation and provide a quantitative indicator for investigating the phase-state change of the lab-generated organic particle due to change in the RH.
Dynamic observation of phase state of field-collected ambient particles
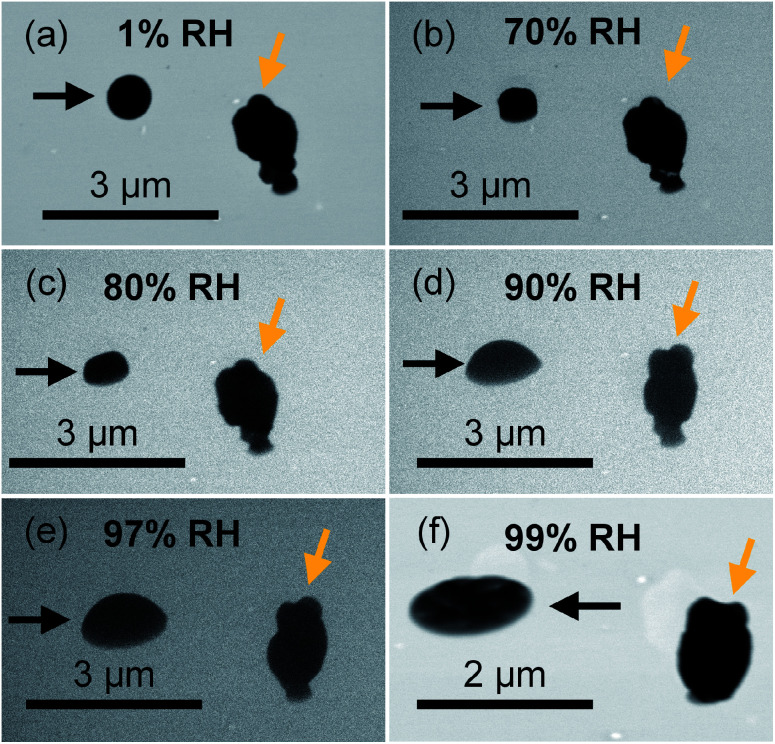
We further utilized the new platform to investigate the evolution of the phase state of ambient particles as a function of RH. In this study, we focused on the ambient particles that are organic-rich and spherical at dry conditions (similar to particle indicated by the black arrow in Fig. 6(a)), which are typically in the solid state (aspect ratio ∼1) at dry condition.5 Unlike lab-generated organic particles with consistent composition in each particle, ambient particle contains variable particle types and chemical compositions in each particle are highly variable. As discussed in the previous section, ambient particles comprise internal and external mixtures with various other atmospheric species with different molecular compositions and hygroscopicity, resulting in highly variable phase states in the same condition. Fig. 6 shows direct observations of the phase-state transition of two typical ambient particles (particles indicated by black and orange arrows). As shown in Fig. 6, ambient particles exhibit different morphologies (i.e., particles indicated by black and orange arrows) with selective water uptake. With increasing RH, the shape of the particle (indicated by the black arrows) changed from a spherical shape (RH < 70%) to a dome-like shape (70% < RH < 97%), and eventually to a flat shape (RH > 97%), demonstrate the particle transmitted from the solid state to the semisolid state, and eventually changed to the liquid state.5 Therefore, our platform is feasible for direct observation of the phase state of ambient organic particles. On the other hand, the shape of the irregular shape particles (indicated by the orange arrow), which is inorganic-rich, does not change until RH higher than 97%, indicating phase transition only occurs at RH above 97% (Fig. 6(e)).
Fig. 6. Representative dynamic observation of phase changes as water uptake by field-collected particles at (a) 1% RH, (b) 70% RH, (c) 80% RH, (d) 90% RH, (e) 97% RH, and (f) 99% RH. Particles indicated by black arrows are examples of organic-rich particles, which show a solid phase state particle transit to semisolid state at 70% RH. Particles indicated by orange arrows are examples of ambient particles contain inorganic species, which we did not investigate in this study.
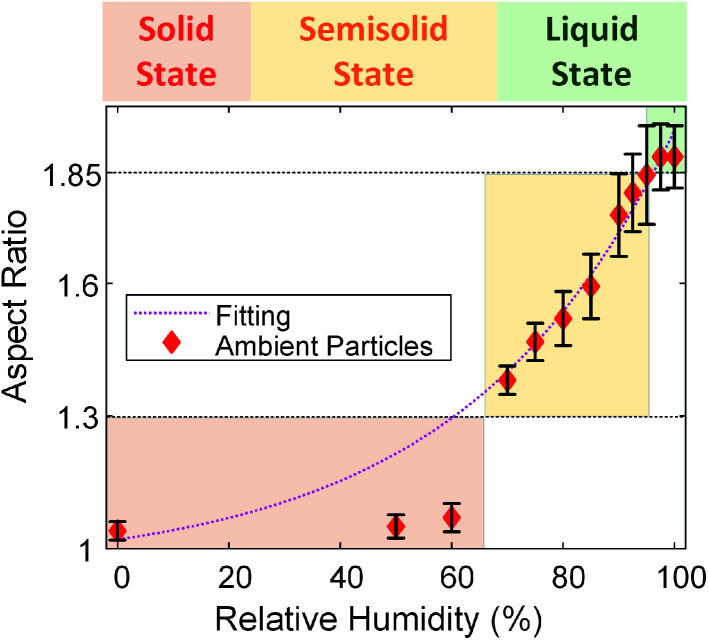
Similar to SRFA particles and soil organic particles, we quantified the changes in the aspect ratio of these selected ambient particle samples (organic-rich and spherical at the dry condition) from dynamic ESEM images. Fig. 7 shows the averaged aspect ratio of these selected ambient particles as a function of RH. As shown in Fig. 7, the average aspect ratio of selected ambient samples increases with increasing RH and exhibits the exponential trend as a function of RH (the dotted magenta line). This is consistent with our observation of SRFA particles and soil organic particles, thus further confirmed that the viscosity of organic particles would decrease with increasing RH at the same temperature.5 On the other hand, unlike the aspect ratio of SRFA particles and soil organic particles (Fig. 4), which shows a clear transition between solid and semisolid state, the aspect ratio of ambient particles does not have an obvious transition point. Thus, we applied the previously proposed thresholds to determine the phase transition points. As shown in Fig. 7, the aspect ratio gradually increases to 1.30, corresponding to RH ∼65%, indicating these particles transition from a solid state to a semisolid state at ∼65% RH. Since we have shown in the previous section that ambient particles contain a considerable amount of inorganic species and fewer abundances COOH groups, we expect ambient particles to transition from solid state to semisolid state at lower RH than SRFA particles and organic soil particles at the same condition.27,44 After this point, the aspect ratio steeply increases to 1.85 when RH increases from ∼65% to ∼97%, indicating that the selected ambient particles transition from semisolid state to the liquid state at ∼97% RH. The phase states of ambient particles are not well understood, and one of the limitations is the variable in the ambient conditions (temperature and RH).11,29,36–38,64 Liu et al. found ambient particles in Beijing, China, the transition from semisolid state to liquid state when RH is 60%.36 Bateman et al. reported that sub-micrometer ambient particles (diameters <1 μm) over the tropical rainforest of central Amazonia were liquid for relative humidity greater than 80% temperatures between 296 and 300 K.37 Schum et al. predicted that aerosols in the free troposphere were mainly solid due to lower temperature and RH.64 These results suggest that ambient particles can be solid, semi-solid, and liquid states based on ambient temperature and RH. Our new platform can be utilized to probe the transition of phase states of ambient particles at different environmental conditions.
Fig. 7. Aspect ratio of the selected field-collected particles averaged over the number of particles analyzed (more than 1000 particles). Error bars indicate the standard error. The shaded region corresponds to the different phase state (red: solid state; yellow: semisolid state; green: liquid state). The dotted black lines are suggested threshold of aspect ratio where solid to semisolid transition (aspect ratio = 1.30) and semisolid to liquid transition (aspect ratio = 1.85) occur. The dotted magenta lines are an exponential-decay fit (aspect ratio = 0.070 exp(0.027 RH) + 0.95, R2 = 0.9755).
Conclusions
In this study, a high-throughput analytical platform that combines tilt view SEM imaging (at 60°) interfaced with ESEM was developed to directly observe the evolution in the organic particle phase state with increasing RH. By controlling the temperature at 278 K and varying RH, three types of organic particles have been studied: (a) Suwannee River Fulvic Acid (SRFA) particles, (b) soil organic particles generated in the lab under controlled conditions, and (c) ambient samples collected from West Bengal, India. The chemical composition and morphology of each type of particle have been probed by applying CCSEM/EDX and STXM/NEXAFS. We found that all three types of particles are organic-rich, but soil organic particles and ambient particles contain a considerable amount of inorganic species. The new platform provided direct observation of the phase state of the individual particle. Moreover, the phase state transition can be observed by measuring the aspect ratio with established thresholds for phase states based on the measurements and predicted Tg of SFRA particles and soil organic particles. Specifically, we proposed that solid to semisolid transition occurs when aspect ratio = 1.30, and semisolid to liquid transition occurs when aspect ratio = 1.85. We quantitatively indicated ambient organic particle transition from solid state to semisolid state at ∼65% RH by applying these thresholds. This result is lower than that of SRFA particles and soil organic particles due to more inorganic species in the ambient particles. Ambient organic particle transition from semisolid state to liquid state at ∼97%. Therefore, our results indicate that the new platform can directly observe and qualitatively indicate the phase state of field-collected ambient particles with high particle statistics, which is challenging to measure in situ in remote sampling sites due to low concentration and sampling feasibility. Moreover, the phase state of ambient particles depends on the ambient temperature and RH, which is not well documented and limits the understanding of the climate effects of ambient particles. Thus, our platform can be used to study the phase states of ambient particles at different ambient conditions. In the future, we will use the same system with the poke-flow technique using the integrated micromanipulator in the ESEM to quantitatively investigate the changes in the viscosity due to different RH and temperature.
Conflicts of interest
There are no conflicts to declare.
Supplementary Material
Acknowledgments
The research presented here was performed at Environmental Molecular Sciences Laboratory (EMSL), a national scientific user facility sponsored by the U.S. Department of Energy's (U.S. DOE) Office of Biological and Environmental Research and located at the Pacific Northwest National Laboratory (PNNL). PNNL is operated by the U.S. Department of Energy by Battelle Memorial Institute. This work was funded by the U.S. Department of Energy Office of Science, Office of Biological and Environmental Research with EMSL through the capability development funding. The CCSEM/EDX and phase state analyses were performed at EMSL. STXM/NEXAFS analysis at beamline 5.3.2 of the Advanced Light Source at LBNL is supported by the Director, Office of Science, and Office of Basic Energy Sciences of the U.S. Department of Energy.
Electronic supplementary information (ESI) available: Glass transition temperature prediction; tilted image correction; schematic diagram of the tilted particles and their projection; figure of simplified typical side view of semisolid and liquid particle on a tilted stage (tilted angle = α); figure of the relative abundances of seven peaks (C C, C O, CH, NH(C O), COOH, C–OH, and CO3) in SRFA particles, soil organic particles, and ambient particles; figure of particle composition of the soil organic particle sample using CCSEM/EDX analysis; figure of particle composition of the ambient sample using CCSEM/EDX analysis; typical example images of changes in morphology as a result of water uptake by NaCl particles. See DOI: 10.1039/d1ra02530a
References
- Kanakidou M. Seinfeld J. H. Pandis S. N. et al. . Atmos. Chem. Phys. 2005;5:1053–1123. doi: 10.5194/acp-5-1053-2005. [DOI] [Google Scholar]
- Jimenez J. L. Canagaratna M. R. Donahue N. M. et al. . Science. 2009;326:1525–1530. doi: 10.1126/science.1180353. [DOI] [PubMed] [Google Scholar]
- Laskin A. Laskin J. Nizkorodov S. A. Chem. Rev. 2015;115(10):4335–4382. doi: 10.1021/cr5006167. [DOI] [PubMed] [Google Scholar]
- Saleh R. Curr. Pollut. Rep. 2020:706. [Google Scholar]
- Reid J. P. Bertram A. K. Topping D. O. et al. . Nat. Commun. 2018;9:956. doi: 10.1038/s41467-018-03027-z. [DOI] [PMC free article] [PubMed] [Google Scholar]
- Virtanen A. Joutsensaari J. Koop T. et al. . Nature. 2010;467(7317):824–827. doi: 10.1038/nature09455. [DOI] [PubMed] [Google Scholar]
- Virtanen A. Kannosto J. Kuuluvainen H. et al. . Atmos. Chem. Phys. 2011;11(16):8759–8766. doi: 10.5194/acp-11-8759-2011. [DOI] [Google Scholar]
- Shrivastava M. Lou S. Zelenyuk A. et al. . Proc. Natl. Acad. Sci. U. S. A. 2017;114(6):1246–1251. doi: 10.1073/pnas.1618475114. [DOI] [PMC free article] [PubMed] [Google Scholar]
- Koop T. Bookhold J. Shiraiwa M. Pöschl U. Phys. Chem. Chem. Phys. 2011;13(43):19238–19255. doi: 10.1039/C1CP22617G. [DOI] [PubMed] [Google Scholar]
- Li Y. Day D. A. Stark H. Jimenez J. L. Shiraiwa M. Atmos. Chem. Phys. 2020;20(13):8103–8122. doi: 10.5194/acp-20-8103-2020. [DOI] [Google Scholar]
- Shiraiwa M. Li Y. Tsimpidi A. P. et al. . Nat. Commun. 2017;8:15002. doi: 10.1038/ncomms15002. [DOI] [PMC free article] [PubMed] [Google Scholar]
- Hodas N. Zuend A. Mui W. Flagan R. C. Seinfeld J. H. Atmos. Chem. Phys. 2015;15(9):5027–5045. doi: 10.5194/acp-15-5027-2015. [DOI] [Google Scholar]
- Liu P. Song M. Zhao T. et al. . Nat. Commun. 2018;9:4076. doi: 10.1038/s41467-018-06622-2. [DOI] [PMC free article] [PubMed] [Google Scholar]
- Zelenyuk A. Imre D. Beránek J. et al. . Environ. Sci. Technol. 2012;46(22):12459–12466. doi: 10.1021/es302743z. [DOI] [PubMed] [Google Scholar]
- Shiraiwa M. Seinfeld J. H. Geophys. Res. Lett. 2012;39(24):L24801. doi: 10.1029/2012GL054008. [DOI] [Google Scholar]
- Murray B. J. Wilson T. W. Dobbie S. et al. . Nat. Geosci. 2010;3(4):233–237. doi: 10.1038/ngeo817. [DOI] [Google Scholar]
- Berkemeier T. Shiraiwa M. Pöschl U. Koop T. Atmos. Chem. Phys. 2014;14(22):12513–12531. doi: 10.5194/acp-14-12513-2014. [DOI] [Google Scholar]
- Sharma N. China S. Bhandari J. et al. . Geophys. Res. Lett. 2018;45(20):11473–11482. doi: 10.1029/2018GL079404. [DOI] [Google Scholar]
- Pöschl U. Shiraiwa M. Chem. Rev. 2015;115(10):4440–4475. doi: 10.1021/cr500487s. [DOI] [PubMed] [Google Scholar]
- Liu P. Li Y. J. Wang Y. et al. . ACS Cent. Sci. 2018;4(2):207–215. doi: 10.1021/acscentsci.7b00452. [DOI] [PMC free article] [PubMed] [Google Scholar]
- Kuwata M. Martin S. T. Proc. Natl. Acad. Sci. U. S. A. 2012;109(43):17354–17359. doi: 10.1073/pnas.1209071109. [DOI] [PMC free article] [PubMed] [Google Scholar]
- Renbaum-Wolff L. Grayson J. W. Bateman A. P. et al. . Proc. Natl. Acad. Sci. U. S. A. 2013;110(20):8014–8019. doi: 10.1073/pnas.1219548110. [DOI] [PMC free article] [PubMed] [Google Scholar]
- Berkemeier T. Steimer S. S. Krieger U. K. et al. . Phys. Chem. Chem. Phys. 2016;18(18):12662–12674. doi: 10.1039/C6CP00634E. [DOI] [PubMed] [Google Scholar]
- Marshall F. H. Miles R. E. H. Song Y. C. et al. . Chem. Sci. 2016;7(2):1298–1308. doi: 10.1039/C5SC03223G. [DOI] [PMC free article] [PubMed] [Google Scholar]
- Bateman A. P. Belassein H. Martin S. T. Aerosol Sci. Technol. 2014;48(1):42–52. doi: 10.1080/02786826.2013.853866. [DOI] [Google Scholar]
- Bateman A. P. Bertram A. K. Martin S. T. J. Phys. Chem. 2015;119(19):4386–4395. doi: 10.1021/jp508521c. [DOI] [PubMed] [Google Scholar]
- Li Y. J. Liu P. F. Bergoend C. Bateman A. P. Martin S. T. Aerosol Sci. Technol. 2017;51(3):388–396. doi: 10.1080/02786826.2016.1263384. [DOI] [Google Scholar]
- Jain S. Petrucci G. A. Aerosol Sci. Technol. 2015;49(6):390–399. doi: 10.1080/02786826.2015.1036393. [DOI] [Google Scholar]
- Pajunoja A. Hu W. Leong Y. J. et al. . Atmos. Chem. Phys. 2016;16(17):11163–11176. doi: 10.5194/acp-16-11163-2016. [DOI] [Google Scholar]
- Hosny N. A. Fitzgerald C. Vyšniauskas A. et al. . Chem. Sci. 2016;7(2):1357–1367. doi: 10.1039/C5SC02959G. [DOI] [PMC free article] [PubMed] [Google Scholar]
- Rothfuss N. E. Petters M. D. Environ. Sci. Technol. 2017;51(1):271–279. doi: 10.1021/acs.est.6b04478. [DOI] [PubMed] [Google Scholar]
- Rothfuss N. E. Petters M. D. Aerosol Sci. Technol. 2016;50(12):1294–1305. doi: 10.1080/02786826.2016.1221050. [DOI] [Google Scholar]
- Marsh A. Petters S. S. Rothfuss N. E. et al. . Phys. Chem. Chem. Phys. 2018;20(22):15086–15097. doi: 10.1039/C8CP00760H. [DOI] [PubMed] [Google Scholar]
- Kasparoglu S. Li Y. Shiraiwa M. Petters M. Atmos. Chem. Phys. 2021;21:1127–1141. doi: 10.5194/acp-21-1127-2021. [DOI] [Google Scholar]
- Rothfuss N. E. Petters S. S. Champion W. M. Grieshop A. P. Petters M. D. Aerosol Sci. Technol. 2019;53(9):998–1011. doi: 10.1080/02786826.2019.1623379. [DOI] [Google Scholar]
- Liu Y. Wu Z. Wang Y. et al. . Environ. Sci. Technol. Lett. 2017;4(10):427–432. doi: 10.1021/acs.estlett.7b00352. [DOI] [Google Scholar]
- Bateman A. P. Gong Z. Liu P. et al. . Nat. Geosci. 2016;9(1):34–37. doi: 10.1038/ngeo2599. [DOI] [Google Scholar]
- Bateman A. P. Gong Z. Harder T. H. et al. . Atmos. Chem. Phys. 2017;17(3):1759–1773. doi: 10.5194/acp-17-1759-2017. [DOI] [Google Scholar]
- Lee H. D. Ray K. K. Tivanski A. V. Anal. Chem. 2017;89(23):12720–12726. doi: 10.1021/acs.analchem.7b02755. [DOI] [PubMed] [Google Scholar]
- O'Brien R. E. Neu A. Epstein S. A. et al. . Geophys. Res. Lett. 2014;41:4347–4353. doi: 10.1002/2014GL060219. [DOI] [Google Scholar]
- Wang B. Harder T. H. Kelly S. T. et al. . Nat. Geosci. 2016;9(6):433–437. doi: 10.1038/ngeo2705. [DOI] [Google Scholar]
- Dinar E. Taraniuk I. Graber E. R. et al. . J. Geophys. Res. 2007;112(5):D05211. [Google Scholar]
- Brooks S. D. DeMott P. J. Kreidenweis S. M. Atmos. Environ. 2004;38(13):1859–1868. doi: 10.1016/j.atmosenv.2004.01.009. [DOI] [Google Scholar]
- Chan M. N. Chan C. K. Environ. Sci. Technol. 2003;37(22):5109–5115. doi: 10.1021/es034272o. [DOI] [PubMed] [Google Scholar]
- Slade J. H. Shiraiwa M. Arangio A. et al. . Geophys. Res. Lett. 2017;44(3):1583–1591. doi: 10.1002/2016GL072424. [DOI] [Google Scholar]
- Parsons M. T. Knopf D. A. Bertram A. K. J. Phys. Chem. A. 2004;108(52):11600–11608. doi: 10.1021/jp0462862. [DOI] [Google Scholar]
- Wang B. Lambe A. T. Massoli P. et al. . J. Geophys. Res. 2012;117(16):D16209. [Google Scholar]
- Veghte D. P. China S. Weis J. et al. . ACS Earth Space Chem. 2017;1(8):511–521. doi: 10.1021/acsearthspacechem.7b00071. [DOI] [Google Scholar]
- Bhandari J. China S. Chandrakar K. K. et al. . Sci. Rep. 2019;9:11824. doi: 10.1038/s41598-019-48143-y. [DOI] [PMC free article] [PubMed] [Google Scholar]
- Fraund M. Bonanno D. China S. et al. . Atmos. Chem. Phys. 2020;20:11593–11606. doi: 10.5194/acp-20-11593-2020. [DOI] [Google Scholar]
- Bracco G. and Holst B., Surface Science Techniques, ed. G. Bracco and B. Holst, Springer, Berlin, New York, 1st edn, 2013, vol. 51 [Google Scholar]
- Laskin A. Wietsma T. W. Krueger B. J. Grassian V. H. J. Geophys. Res. 2005;110(10):D10208. doi: 10.1029/2004JD005206. [DOI] [Google Scholar]
- Moffet R. C., Tivanski A. V. and Gilles M. K., in Fundamentals and Applications in Aerosol Spectroscopy, ed. R. Signorell, J. P. Reid, Taylor and Francis Books, Inc., Boca Raton, FL, 2011, pp 419–462 [Google Scholar]
- Koop T. Bookhold J. Shiraiwa M. Pöschl U. Phys. Chem. Chem. Phys. 2011;13(43):19238–19255. doi: 10.1039/C1CP22617G. [DOI] [PubMed] [Google Scholar]
- Moffet R. C. Henn T. Laskin A. Gilles M. K. Anal. Chem. 2010;82(19):7906–7914. doi: 10.1021/ac1012909. [DOI] [PubMed] [Google Scholar]
- Moffet R. C. Henn T. R. Tivanski A. V. et al. . Atmos. Chem. Phys. 2010;10(3):961–976. doi: 10.5194/acp-10-961-2010. [DOI] [Google Scholar]
- Tivanski A. V. Hopkins R. J. Tyliszczak T. Gilles M. K. J. Phys. Chem. A. 2007;111(25):5448–5458. doi: 10.1021/jp070155u. [DOI] [PubMed] [Google Scholar]
- Laskin A. Moffet R. C. Gilles M. K. et al. . J. Geophys. Res. 2012;117(15):D15302. [Google Scholar]
- Moffet R. C. Rödel T. C. Kelly S. T. et al. . Atmos. Chem. Phys. 2013;13(20):10445–10459. doi: 10.5194/acp-13-10445-2013. [DOI] [Google Scholar]
- Feldman S. R., in Kirk-Othmer Encyclopedia of Chemical Technology, John Wiley & Sons, Inc., New York, 2011 [Google Scholar]
- Svenningsson B. Rissler J. Swietlicki E. et al. . Atmos. Chem. Phys. 2006;6(7):1937–1952. doi: 10.5194/acp-6-1937-2006. [DOI] [Google Scholar]
- Hatch C. D. Gierlus K. M. Zahardis J. Schuttlefield J. Grassian V. H. Environ. Chem. 2009;6(5):380–388. doi: 10.1071/EN09083. [DOI] [Google Scholar]
- Schmedding R. Rasool Q. Z. Zhang Y. et al. . Atmos. Chem. Phys. 2020;20(13):8201–8225. doi: 10.5194/acp-20-8201-2020. [DOI] [PMC free article] [PubMed] [Google Scholar]
- Schum S. K. Zhang B. Dzepina K. et al. . Atmos. Chem. Phys. 2018;18(19):14017–14036. doi: 10.5194/acp-18-14017-2018. [DOI] [Google Scholar]
Associated Data
This section collects any data citations, data availability statements, or supplementary materials included in this article.


