Abstract
C/BiOBr composite materials were synthesized via a simple one-step solvothermal method, with C derived from biochar, which was prepared from the low-cost straw. The samples were characterized by SEM, XRD, XPS and PL. The 2% C/BiOBr composite material showed a noticeable adsorption and photocatalysis synergistic effect to remove CIP. The adsorption rate and degradation rate were 1.45 times and 1.8 times that of BiOBr. The adsorption kinetics and isotherms of CIP on C/BiOBr were analyzed with the pseudo-second-order kinetic and Langmuir models. The degradation efficiency was 96.8% after 60 min of irradiation. High stability and degradability were still maintained after four cycles. The Bi–O–C bond accelerated electron transition and inhibited the rapid photogenerated electron pair recombination. In the degradation process of CIP, ˙O2− and h+ played a significant role. Experiments proved that C/BiOBr is practical and feasible for the degradation of CIP under the synergistic effect of adsorption and photocatalysis.
1. The C-loaded BiOBr was synthesized via a one-step solvothermal method. 2. C/BiOBr showed an obvious synergistic effect of adsorption and photocatalysis on the degradation of ciprofloxacin.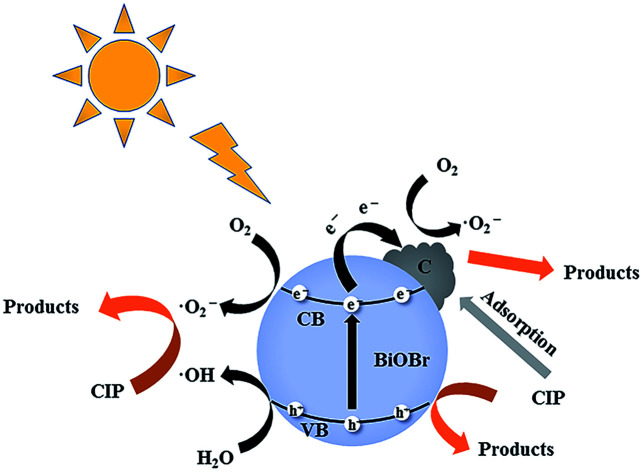
Introduction
Recently, the abuse of antibiotics has resulted in their dramatic accumulation in the environment. Among these antibiotics ciprofloxacin (CIP) is a representative fluoroquinolone antibiotic with antibacterial effects.1,2 Most studies have reported that animals rarely absorb CIP, and most of it is passively excreted from the body through metabolism and then enter the biosphere cycle after sewage treatment.3,4 The accumulation of CIP causes a potential damage to the ecological environment and human health, producing drug-resistant pathogens.5 Therefore, there is an urgent need to find an efficient treatment method to remove CIP from the environment.6 The conventional treatment technology for removing CIP in wastewater cannot yield satisfactory results. Physical adsorption only transfers CIP to the absorbent and cannot wholly degrade CIP. Physical adsorption solely cannot solve the problem fundamentally, and biodegradation cannot achieve the long-term effective removal of CIP in wastewater.7
Photocatalytic oxidation technology has become the most suitable method to degrade CIP in wastewater due to its high efficiency and environmental protection. TiO2 is the most common photocatalytic material, which has been applied in the field of photocatalysis.8–10 However, it only responds to ultraviolet light, resulting in its low utilization of sunlight. Visible light accounts for 43% of the sunlight. To improve solar utilization and visible light-responsiveness photocatalysts have attracted more and more attention. In recent years, many Bi-based compounds are considered due to their high responsiveness to visible light.11–13 Furthermore, bismuth oxyhalides (BiOX, X = Cl, Br, and I) are investigated widely because of their high photocatalytic activity, outstanding stability and the advantages of a simple preparation process.14 Among them, BiOBr is composed of a unique structure of [Bi2O2]2+ layers interleaved with double Br layers, which is conducive to the separation of photogenerated carriers – holes and electrons.15,16 Besides, BiOBr effectively utilizes sunlight and responds to visible light due to its band gap (∼2.72 eV).17 However, the low efficiency of photogenerated electron–hole pair separation still limits its application.18
To promote the separation efficiency of electron–hole pairs, BiOBr is composited with C3N4,19 TiO2,20 Ag,21,22 Bi2WO6,23 BiOX24,25 and graphene oxide.26 Nevertheless, many researchers have found that CIP absorbed quickly on the surface of the catalyst to achieve rapid degradation by the combination of photocatalysts and carbon materials because added carbon materials also inhibit the recombination of electrons and holes.27,28 Chang et al. synthesized a 3D–3D flowerlike bismuth bromide/graphene hydrogel composite material by a two-step hydrothermal method. Further, the composite showed excellent adsorption capacity and photocatalytic efficiency and completely removed potassium butyl xanthate in 85 min.29 Patil et al. successfully synthesized a BiOBr–graphene oxide (BiOBr–GO) nanocomposite by the sonochemical method, which enhanced adsorption and photocatalytic performance under ultraviolet and visible light irradiation, and the removal rate of green TOC was 91.7%.30 However, the high cost and complicated synthesis process are distinct disadvantages of these carbon materials. Therefore, it is necessary to develop low-cost, abundant and renewable alternatives to prepare carbonaceous materials. To date, biochar is applied extensively to treat wastewater due to its abundant functional groups, larger specific surface area and low price.
Herein, biochar was prepared by a simple high-temperature pyrolysis process from agricultural waste corn straw, and was composited with BiOBr by a one-step solvothermal method, which was rarely reported. With CIP as the target degradation product, the adsorption capacity and photocatalytic performance of the C/BiOBr composite materials were systematically studied under visible light, and the adsorption behaviour and photocatalytic degradation performance of the C/BiOBr composite were evaluated through related characterization and experimental analysis. Meanwhile, the reusability of the C/BiOBr composite and the active species that played a role in the degradation process of CIP were determined, and a possible photocatalytic mechanism for the photocatalytic degradation of CIP was provided.
Experimental
Materials
The materials used were ciprofloxacin (C17H18FN3O3, >98%), bismuth nitrate pentahydrate (Bi(NO3)3·5H2O), cetyltrimethylammonium bromide (CTAB), straw, ethylene glycol, absolute ethanol, benzoquinone, isopropyl alcohol, disodium ethylenediamine, hydrochloric acid and sodium hydroxide. All chemicals were purchased from Sinopharm Chemical Reagent Co., Ltd. Experimental water is secondary distilled water.
Sample preparation
Biochar was prepared by a type method. Clean and dry straw was smashed using a pulveriser and passed through 60 meshes. The straw powder was heated to 500 °C at 10 °C min−1 under a nitrogen atmosphere and kept for 3 h. After cooling, it was ground to pass 100 meshes.
The C/BiOBr powder was synthesized by a one-step solvothermal method. 1 mmol Bi(NO3)3·5H2O was dispersed completely in 40 mL ethylene glycol solvent to form transparent homogeneous solution A under magnetic stirring at room temperature. Different mass ratios of biochar (1% C, 2% C, 3% C and 4% C) were added to solution A and dispersed by ultrasonic treatment. Then 1 mmol CTAB was added and disposed by ultrasonication for 20 min. The mixture was put into a Teflon-lined stainless steel autoclave at 120 °C for 12 h. The product was collected, and washed alternately with absolute ethanol and deionized water six times. Finally, the obtained solid was dried in an oven at 60 °C. The samples were marked as 1% C/BiOBr, 2% C/BiOBr, 4% C/BiOBr and 6% C/BiOBr, respectively. The pure BiOBr powder was prepared via the above method, without adding biochar.
Characterization
An X-ray powder diffraction analyser (XRD, Rigaku Rotaflex) was used to test the crystal phase, crystallinity and grain size of the synthesized samples, with Cu Kα at a scan rate (2θ) of 10° min−1, an accelerating voltage of 40 kV and a current of 100 mA. The morphology and size of the sample were studied using a scanning electron microscope analyser (SEM, JSM-6510), and an energy dispersive spectrometer (EDS) equipped with a SEM was used to analyse the composition of elements in the material micro-area. The surface properties of samples were measured by X-ray photoelectron spectroscopy (XPS, Escalab250Xi) and the photoluminescence (PL) spectra of samples were recorded on an FLS920 fluorescence spectrometer with an excitation wavelength of 250 nm.
Adsorption experiment
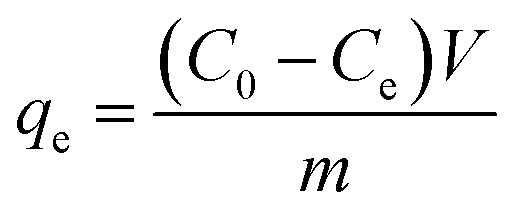
The experiment was carried out in the dark, batch adsorption experiments were conducted by adding 50 mg of photocatalyst to 100 mL of the CIP solution in a sealed beaker, and 0.1 mol L−1 NaOH or 0.1 mol L−1 HCl was added to adjust the pH value of the solution. 4 mL of CIP solution was taken out every 10 min, and then filtered with a 0.22 μm membrane to collect the filtrate. The adsorption kinetics of CIP on C/BiOBr was measured with different initial concentrations of CIP (5, 10, 20, 30, 40 and 50 mg L−1) at 25 °C. The concentration of CIP was determined using a UV spectrophotometer at 274 nm, and the formula was as follows:
 |
1 |
where qe (mg g−1) is the adsorption amount of CIP in equilibrium. C0 (mg L−1) is the initial concentration of CIP. Ce (mg L−1) is the concentration of CIP in equilibrium. V (L) is the volume of CIP solution. m (g) is the mass of biochar.
Photocatalytic activity
Under irradiation with a 500 W xenon lamp in a sealed photocatalytic reactor, 50 mg of the photocatalyst was added to 100 mL of CIP solution (10 mg L−1). Before starting the photocatalysis experiment, the solution was stirred in the dark for 60 min to reach the adsorption–desorption equilibrium. After irradiation, 3.5 mL of the mixture was taken out every 10 min and filtered with a 0.22 μm membrane to remove the photocatalyst particles. Then the concentration change of CIP was measured using an ultraviolet-visible spectrophotometer at 274 nm.
Results and discussion
Characterization of samples
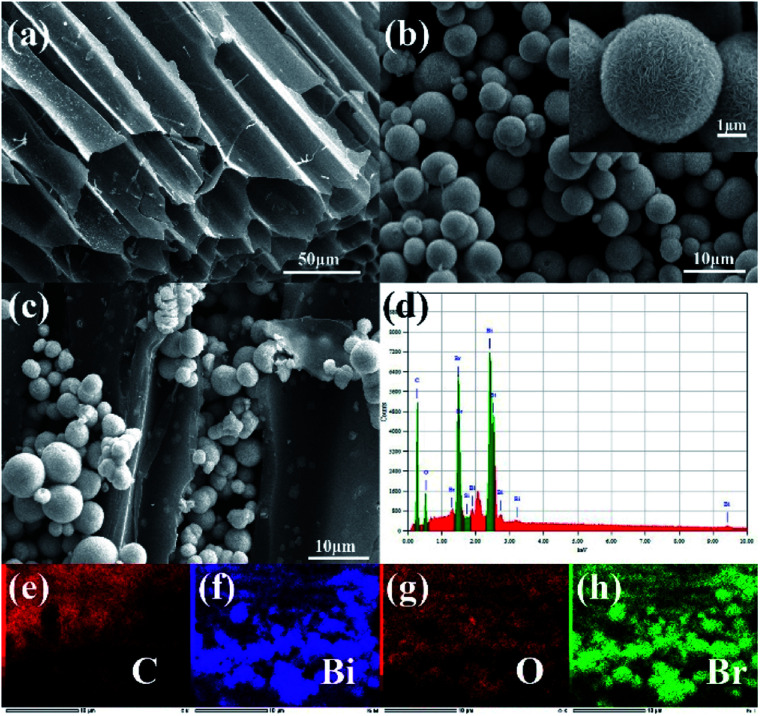
The structure and morphology of the composite material were analysed using a scanning electron microscope (SEM). Fig. 1a is a SEM image of straw biochar. There were many irregular tunnels in biochar, which might facilitate adsorption and photoreaction. Pure BiOBr and 2% C/BiOBr are shown in Fig. 1b and c, respectively. The pure BiOBr showed a flower sphericity formed, which was composed of irregular nanosheets and the diameter was 2–8 μm. In Fig. 1c, some flower spherical BiOBr was grown on the biochar, which proved that the biochar successfully loaded BiOBr. Fig. 1d shows the EDS image of 2% C/BiOBr. The peak of C was sharp, indicating that the 2% C/BiOBr sample does not incorporate other elements. More than that, the elemental mapping images illustrated that C, Bi, O and Br elements were distributed throughout the scan area of 2% C/BiOBr (Fig. 1e–h).
Fig. 1. SEM images of samples: (a) straw biochar, (b) pure BiOBr, and (c) 2% C/BiOBr, (d) EDS spectrum of 2% C/BiOBr and (e–h) EDS-mapping of 2% C/BiOBr.
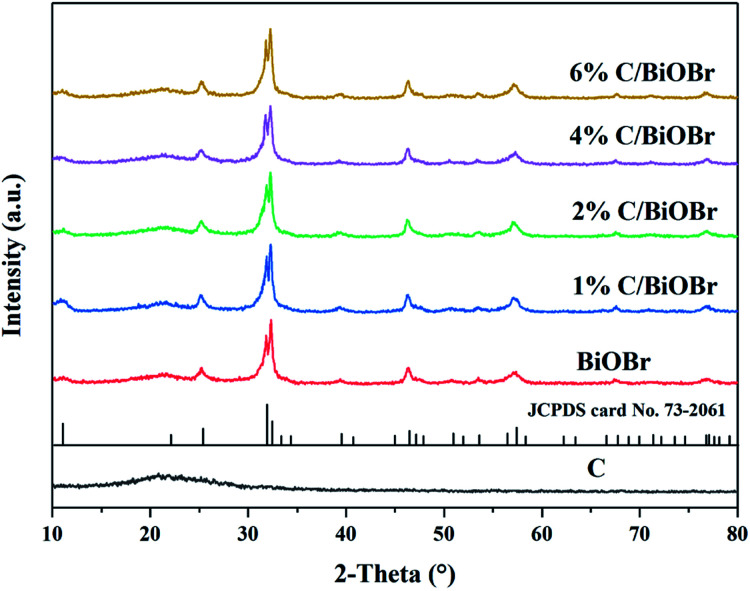
The crystal phase and structure of samples were detected by XRD. Fig. 2 shows the XRD patterns of pure BiOBr and C/BiOBr photocatalysts. The diffraction peaks of pure BiOBr were attributed to tetragonal BiOBr (JCPDS card no. 73-2061).31 The diffraction angle 2θ was 10.9°, 25.3°, 31.8°, 32.3°, 46.3° and 57.3°, corresponding to the (001), (011), (012), (110), (020) and (212) crystal planes of BiOBr. There was no other peak in the spectrum. The characteristic peaks of the composite were compared with those of the pure BiOBr, and there was no apparent difference, indicating that C in C/BiOBr might be amorphous carbon. The figure also confirmed that the biochar was amorphous carbon because there was no clear and sharp peak.32 As the amount of biochar increased, the peaks of C/BiOBr did not change obviously, indicating that biochar synthesis might occur on different exposed surfaces.
Fig. 2. XRD spectra of samples.
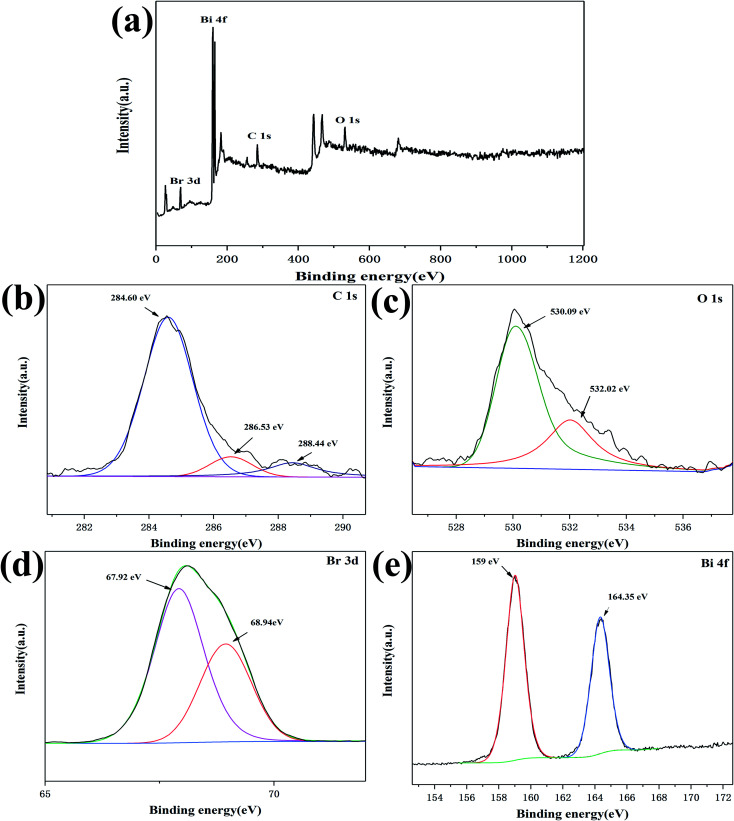
To further explore the surface chemical composition and element valence of the C/BiOBr composite material, XPS analysis was performed on 2% C/BiOBr. As shown in Fig. 3a, the 2% C/BiOBr composite material was composed completely of C, O, Bi and Br elements. The peaks of C are shown in Fig. 3b, with distributed binding energies of 284.60 eV, 286.53 eV and 288.44 eV, respectively.
Fig. 3. XPS spectrum of the 2% C/BiOBr photocatalyst: (a) survey spectra, (b) C 1s, (c) O 1s, (d) Br 3d, and (e) Bi 4f.
The strong peak at 284.60 eV related to the sp2 hybridized C–C bond of the carbon matrix.33 The other two peaks at 286.53 eV and 288.44 eV correspond to C–O and C O bonds, indicating that C–O–Bi might be formed between C and BiOBr, which was beneficial to the charge transfer during light excitation.34 The efficient charge transfer prevented light-induced electron–hole recombination in order to enhance the photocatalytic activity.35 The peaks of O 1s appeared at 530.09 eV and 532.02 eV, respectively. The peak at 530.09 eV was attributed to the Bi–O bond, and another peak should be attributed to the C–O bond (Fig. 3c),28 which was caused by the interaction between carbon and BiOBr.36 In Fig. 3d, the two peaks (67.92 eV and 68.94 eV) were Br 3d3/2 and Br 3d5/2, respectively, indicating that the sample contained Br−. The double peaks of Bi 4f7/2 at 159 eV and Bi 4f5/2 at 164.35 eV proved that Bi3+ existed in the sample (Fig. 3e).37 According to the results of XPS and XRD, the sample was C/BiOBr.
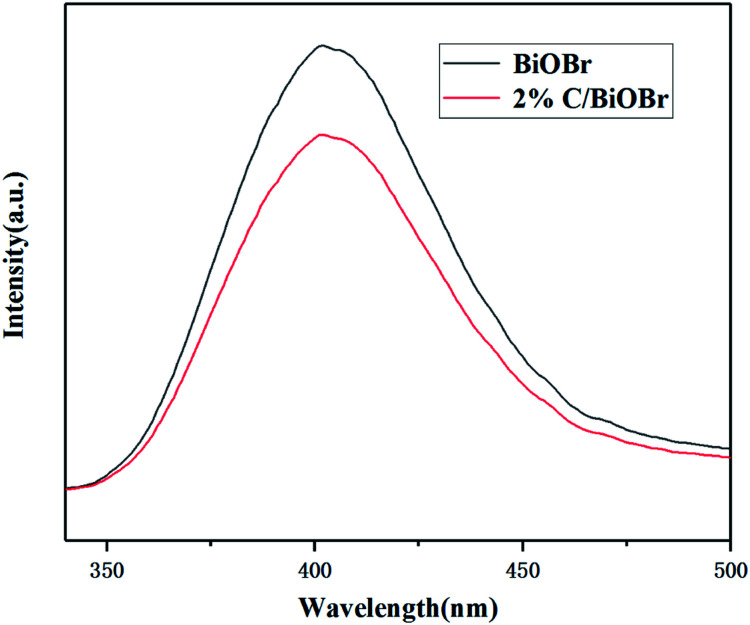
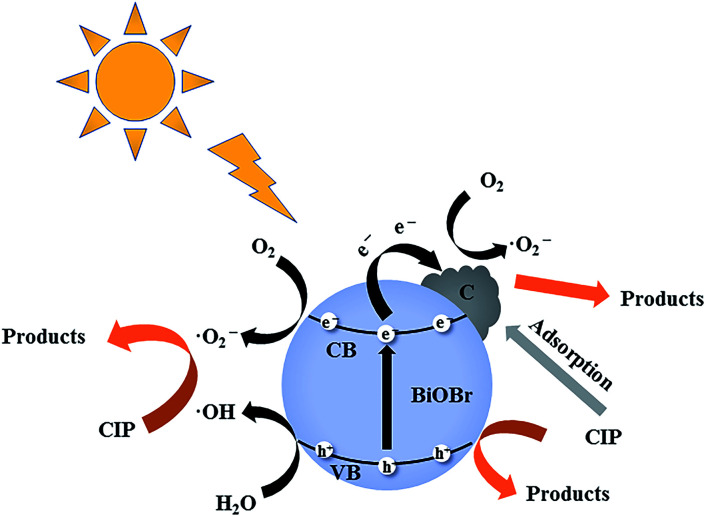
PL spectra analysis was used to reveal the separation, migration and recombination of photogenerated electrons and holes under light irradiation. Weak intensity of PL usually indicates a lower recombination rate of electron–hole pairs and better photocatalytic performance. Fig. 4 shows the PL spectra of BiOBr and 2% C/BiOBr composite material. It could be found that compared with BiOBr, the emission peak intensity of 2% C/BiOBr was much lower, which reflected that there was less recombination of electron–hole pairs in the 2% C/BiOBr sample. The effective migration of light-induced carriers in 2% C/BiOBr is attributed to the presence of carbon components, which quickly accepted and transferred electrons from the conduction band (CB) of BiOBr through the Bi–O–C bond, effectively inhibiting the recombination of photogenerated electrons and holes.
Fig. 4. PL spectra of BiOBr and 2% C/BiOBr composites.
Adsorption experiment
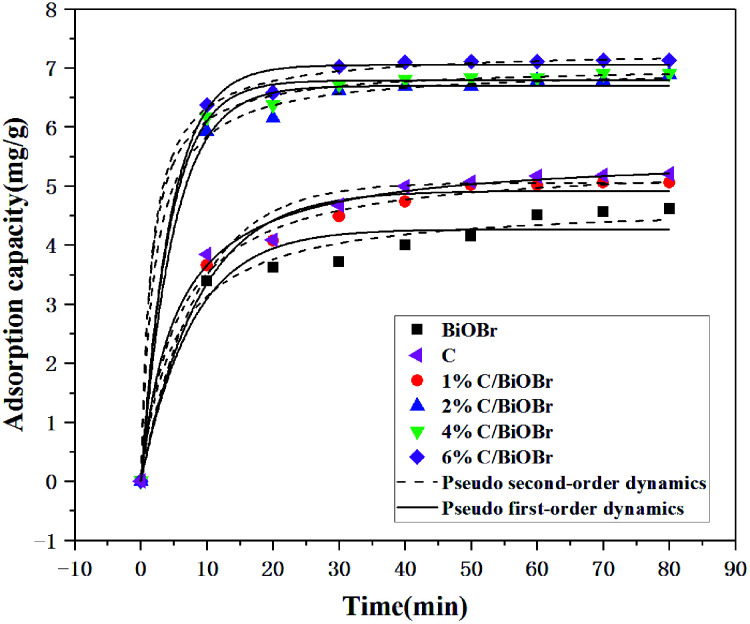
Fig. 5 shows the adsorption kinetic curves with a concentration of 10 mg L−1 CIP on different samples. The absorbed amount of CIP increased rapidly in the initial 10 min, and the adsorption rate rose slightly and levelled off from 10 to 60 min. The adsorption capacity of BiOBr and C was 4.62 mg g−1 and 5.21 mg g−1, respectively. The maximum adsorption capacity of 1% C/BiOBr, 2% C/BiOBr, 4% C/BiOBr and 6% C/BiOBr was 5.05 mg g−1, 6.89 mg g−1, 6.91 mg g−1 and 7.13 mg g−1 respectively. The adsorption capacity of composite materials is greater than that of BiOBr, and the adsorption capacity of 1% C/BiOBr was not as strong as that of C due to the introduction of too little C, indicating that the addition of a proper amount of biochar could enhance its adsorption capacity because the introduction of biochar with a tunnel structure provided more adsorption sites, increasing its adsorption capacity. However, with the increase of the biochar loaded to 4% and 6%, the adsorption capacity of C/BiOBr composite materials did not rise noticeably. Because the sample adsorbs the same concentration of CIP to reach adsorption saturation, even if the amount of biochar was increased, its adsorption capacity was basically unchanged. Therefore, the adsorption performance of 2% C/BiOBr was mainly analysed.
Fig. 5. Effect of contact time on the adsorption of CIP onto samples.
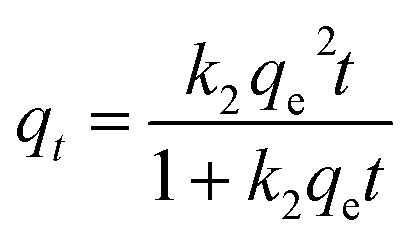
To better analyse the adsorption mechanism, the samples were fitted with the pseudo-first-order kinetic equation and pseudo-second-order kinetic equation to describe the adsorption process, and the formula was as follows:
 |
2 |
 |
3 |
where qt (mg g−1) is the adsorption amount of CIP at time t. qe (mg g−1) is the adsorption amount of CIP at equilibrium. k1 (min−1) is the pseudo-first-order adsorption rate constant. k2 (g mg−1 min−1) is the pseudo-second-order adsorption rate constant.
The effect of contact time on the adsorption of CIP onto samples is shown in Fig. 5. The kinetic parameters are listed in Table 1. The pseudo-first-order and pseudo-second-order kinetic equations were used to evaluate the adsorption characteristics of samples to CIP, but the coefficient determination (R2) of the pseudo-second-order kinetic equation was better than that of the pseudo-first-order kinetic equation, illustrating that the pseudo-second-order kinetic equation was in accordance with adsorption characteristics of the samples to CIP, which extremely approximate the experimental and the chemical adsorption process was primary affected by the adsorption rate analysis, and the adsorption capacity was proportional to the active sites on the composite materials,38 chemical adsorption also showed that the composite materials involved exchange and sharing of electrons in the CIP adsorption process.39
Related parameters of the pseudo-first-order kinetic equation and pseudo-second-order kinetic equation.
| Sample | Qe (mg g−1) | Pseudo-first-order model | Pseudo-second-order model | ||||
|---|---|---|---|---|---|---|---|
| k 1 (min−1) | q e (mg g−1) | R 2 | k 2 (g mg−1 min−1) | q e (mg g−1) | R 2 | ||
| BiOBr | 4.62 | 0.1284 | 4.2676 | 0.9468 | 0.0423 | 4.7049 | 0.9766 |
| C | 5.21 | 0.1167 | 5.0588 | 0.9762 | 0.0349 | 5.5489 | 0.9922 |
| 1% C/BiOBr | 5.05 | 0.1139 | 4.9185 | 0.9800 | 0.0341 | 5.4144 | 0.9952 |
| 2% C/BiOBr | 6.89 | 0.2015 | 6.6982 | 0.9925 | 0.0717 | 6.9979 | 0.9981 |
| 4% C/BiOBr | 6.91 | 0.2284 | 6.7891 | 0.9955 | 0.0948 | 7.024 | 0.9990 |
| 6% C/BiOBr | 7.13 | 0.2230 | 7.0517 | 0.9953 | 0.0882 | 7.3010 | 0.9986 |
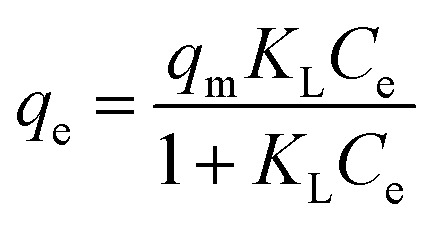
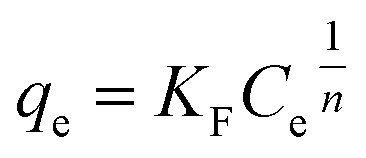
According to the result of adsorption, the adsorption capacity of BiOBr and 2% C/BiOBr composite material was studied when the initial concentration of CIP was 5 mg L−1, 10 mg L−1, 20 mg L−1, 30 mg L−1, 40 mg L−1 and 50 mg L−1, and Langmuir and Freundlich isotherm models fitted the experimental data; the formula is as follows:
 |
4 |
 |
5 |
where qm (mg g−1) is the theoretical maximum adsorption capacity. Ce (mg L−1) is the concentration of ciprofloxacin at equilibrium. KF is the equilibrium constant of the Freundlich isotherm equation. KL (L mg−1) is the equilibrium constant of the Langmuir isotherm equation. n is the adsorption intensity constant.
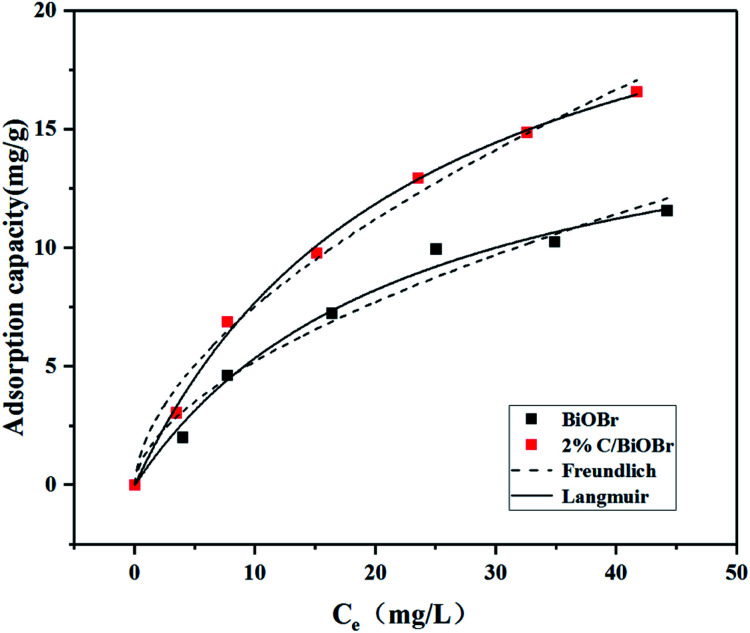
As shown in Fig. 6, the adsorption capacity of BiOBr and 2% C/BiOBr was evaluated by Langmuir and Freundlich isotherms. The parameters of the isotherms are listed in Table 2. Comparing the correlation coefficient (R2) of the Freundlich model and Langmuir model, the latter was more suitable for describing the adsorption behaviour of BiOBr and 2% C/BiOBr to CIP, indicating that the adsorption of various adsorbates to CIP was single-layer adsorption with homogeneous adsorption sites.
Fig. 6. Adsorption isotherms of BiOBr and 2% C/BiOBr for CIP.
Related parameters of Langmuir and Freundlich adsorption isotherm models.
| Sample | Langmuir | Freundlich | ||||
|---|---|---|---|---|---|---|
| K L (L mg−1) | q m (mg g−1) | R 2 | K F | n | R 2 | |
| BiOBr | 0.0434 | 17.7053 | 0.9887 | 1.4240 | 1.7711 | 0.9686 |
| 2% C/BiOBr | 0.0428 | 25.6848 | 0.9974 | 2.0211 | 1.7479 | 0.9893 |
Photocatalytic degradation experiment
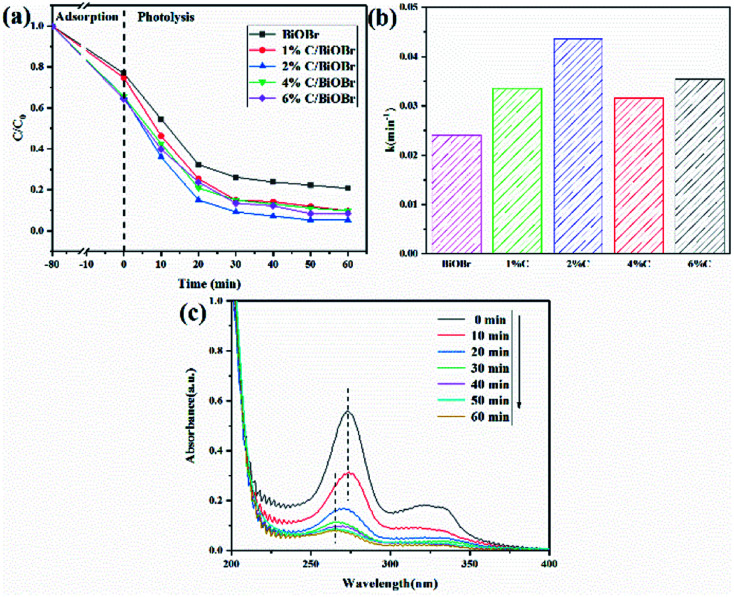
Based on the above adsorption experiment, the 2% C/BiOBr was further studied for photocatalysis. After dark adsorption for 80 minutes, BiOBr, 1% C/BiOBr, 2% C/BiOBr, 4% C/BiOBr and 6% C/BiOBr composites had 23%, 25%, 34%, 35% and 36% CIP removal rates, respectively. The adsorption capacity of this material is twice that of the adsorbent magnesium oxide nanoparticles, which means that the material has the characteristics of an adsorbent.40 After 60 minutes of photocatalysis, 2% C/BiOBr exhibited the best photocatalytic activity of 95%, which was significantly higher than that of 1% C/BiOBr (90%), 4% C/BiOBr (90%), 6% C/BiOBr (92%) and pure BiOBr (79%) (Fig. 7a). The incorporation of C improved the adsorption performance of the C/BiOBr composite materials and enhanced the photocatalytic activity of the composite materials. However, compared with 2% C/BiOBr, the photodegradability of 4% C/BiOBr and 6% C/BiOBr was reduced. This finding may be due to the fact that excessive introduction of C masks the light absorption of BiOBr. Since excess biochar rapidly reduces the light intensity over the entire depth of the reaction solution, the catalyst surface can lead to shielding, which may be called the “shielding effect”.41 Its degradation efficiency was higher than that of the biochar@ZnFe2O4/BiOBr composite material for CIP (84%), indicating that the material has better photocatalytic performance.37
Fig. 7. (a) CIP degradation curve, (b) CIP degradation rate, and (c) CIP UV adsorption spectroscopy.
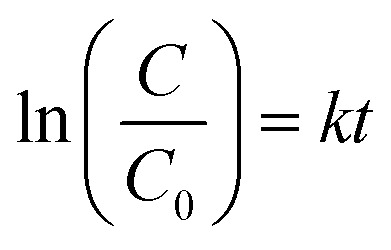
According to Fig. 7a, a pseudo-first-order kinetic model was used to fit the photocatalytic degradation rate.
 |
6 |
where C0 (mg L−1) is the CIP concentration after adsorption equilibrium. t (min) is the reaction time; C (mg L−1) is the CIP concentration at time t. k (min−1) is the apparent pseudo-first-order rate constant. According to formula (6), the photodegradation rate constant of CIP was calculated, and the result is shown in Fig. 7b. The photodegradation rate constants of pure BiOBr, 1% C/BiOBr, 2% C/BiOBr, 4% C/BiOBr and 6% C/BiOBr were 0.0241, 0.0336, 0.0435, 0.0316 and 0.03542, respectively. The photodegradation rate of 2% C/BiOBr was about 1.8 times that of pure BiOBr. Photocatalytic experiments showed that biochar could improve the photocatalytic activity of BiOBr and increased the photocatalytic speed. The blue shift of the maximum adsorption peak for the CIP was obviously observed in Fig. 7c. Rapid degradation appeared within 20 min, meaning valid decomposition of CIP. These results indicated that the introduction of a proper amount of C showed obvious adsorption-photocatalysis synergy.
Effect of the initial concentration
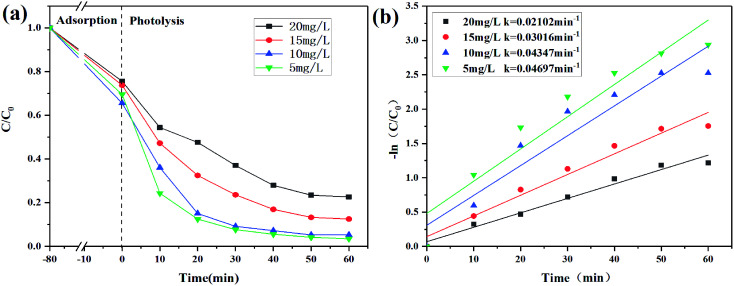
In Fig. 8a, in the case of dark adsorption, the removal efficiency first increased and then decreased with the increase of the initial concentration. The decrease in the removal efficiency of CIP at a higher initial concentration may be due to insufficient binding sites on 2% C/BiOBr for the adsorption.42 When the initial concentration of CIP was 5 mg L−1, the degradation speed was the fastest, and the degradation efficiency was 95% in 60 min. As the initial concentration of CIP increased to 10 mg L−1, its degradation rate dropped, but the degradation efficiency reached 92% in 60 min. When the initial concentration of CIP increased to 15 mg L−1 and 20 mg L−1, its degradation efficiency began to decrease, which was attributed to many CIP molecules occupying the active sites of 2% C/BiOBr, which declined its photocatalytic activity. It was also possible that the intermediates produced in the photocatalysis process competed with CIP molecules for their active sites, reducing the photocatalytic efficiency. Moreover, the results are consistent with what Kang Hu reported;43 the high concentration of CIP absorbed part of the light energy and reduced the photons of the photocatalytic composite materials. The corresponding photodegradation kinetic parameters are determined by the pseudo-first-order kinetic model (Fig. 8b).
Fig. 8. (a) Degradation curves of different initial concentrations of CIP and (b) degradation kinetics of CIP.
The effect of catalyst dosage
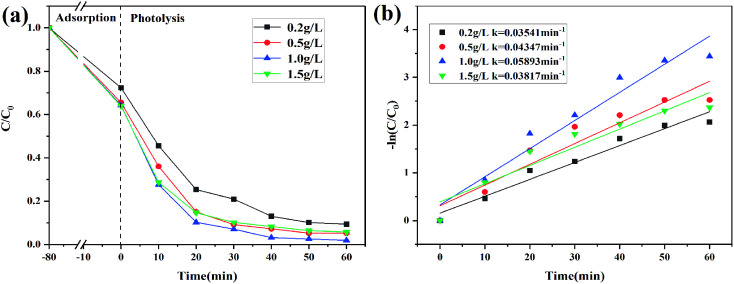
Different catalyst dosages were chosen to evaluate the photocatalytic activity of 2% C/BiOBr as shown in Fig. 9a. Under dark absorption conditions, the removal rate of CIP gradually increased and tended to be slow, which showed that the adsorbent has a limited number of active sites and reached saturation at a certain concentration.44 With the increase of the catalyst dosage from 0.2 g L−1 to 1.0 g L−1, the degradation efficiency also steadily increased. However, when the catalyst dosage was 1.5 g L−1, its degradation efficiency began to decrease, which showed that an appropriate catalyst dosage could increase its degradation efficiency because abundant catalyst dosage produced more active sites that could quickly oxidize pollutants, but the excessive catalyst dosage was accumulated in the solution which increased the opacity of the solution, affecting the photocatalyst absorption, and reduced its degradation efficiency.45 In addition, the corresponding rate constant is also presented in Fig. 9b, demonstrating that 1.0 g L−1 catalyst dosage was the optimum dosage.
Fig. 9. (a) CIP degradation curves of different catalyst dosages and (b) CIP degradation kinetics.
The effect of pH
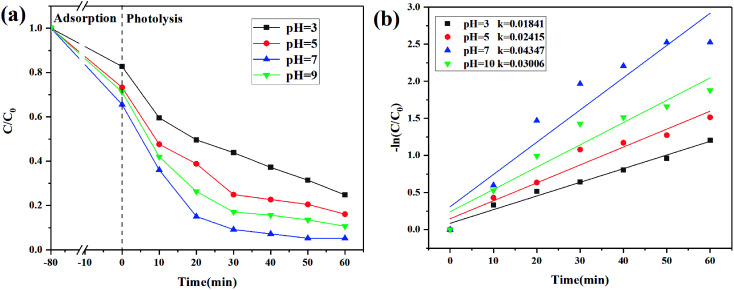
1 mol L−1 HCl and NaOH were used to adjust the pH values of CIP solution to explore the effect of pH on CIP degradation. CIP existed in different forms at different pH values. When 2 < pH < 5, the CIP molecule existed as a monovalent cation (CIP+) due to the protonation of the pyrazine ring. At pH > 9, the CIP molecule existed as an anion (CIP–COO−) due to the deprotonation of the carboxyl group. At 6 < pH < 8, CIP existed in the form of zwitterions (CIP±), which was ascribed to deprotonated carboxyl groups and protonated pyrazine rings.46,47 As shown in Fig. 10a, under dark adsorption conditions, 2% C/BiOBr had a better adsorption effect on zwitterions at pH = 7. The degradation efficiency increased sharply with the pH increased to pH < 9. Under acidic conditions, a large amount of H+ and CIP+ in the solution competed for the active sites of the catalyst, which reduced its degradation efficiency. At pH = 7, the degradation efficiency reached the highest value because under neutral conditions, CIP molecules that contained zwitterions had the lowest solubility and the highest hydrophobicity, and the hydrophobicity promoted the CIP molecules to fast reach the surface of 2% C/BiOBr so that its degradation efficiency reached the highest value. Under alkaline conditions, a large amount of OH− in the solution prevented CIP–COO− from entering the surface of the catalyst, affecting the catalytic efficiency. Besides, in Fig. 10b, the photocatalytic reaction at different pH values accorded with the pseudo-first-order reaction kinetics, and the reaction rate constant increased from 0.01841 min−1 to 0.04347 min−1 and then decreased to 0.03006 min−1 which is consistent with the situation discussed earlier. From the experimental data, the best conditions to degrade CIP were neutral conditions.
Fig. 10. (a) CIP degradation curves at different pH and (b) CIP degradation kinetics.
Stability of the catalyst
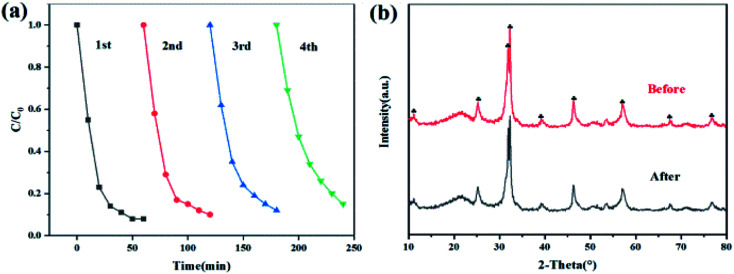
We carried out cyclic degradation experiments to explore the stability of 2% C/BiOBr. As shown in Fig. 11a, after four cycles, the photocatalyst activity still remained high (85%). The photocatalytic degradation efficiency dropped than the fresh photocatalyst due to the remaining CIP and intermediates adsorbed on the surface of the catalyst during the cycle degradation. For further exploration, XRD characterization was performed before and after four cycles of CIP degradation by 2% C/BiOBr (Fig. 11b). The diffraction peaks of 2% C/BiOBr did not change distinctly after four cycles, and there was no new diffraction peak, indicating that the crystal structure did not change. The experiments illustrated that the 2% C/BiOBr composite material had favourable stability for application in removing CIP in the environment.
Fig. 11. (a) 4 cycles of CIP degradation and (b) XRD pattern before and after 4 cycles of CIP degradation for 2% C/BiOBr.
Degradation mechanism of the catalyst
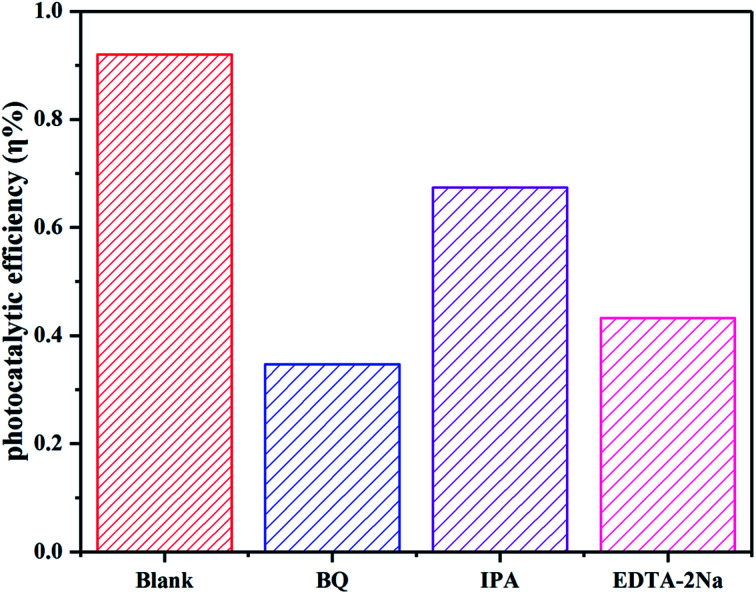
The active species capture experiments were performed in the catalytic process to explore the photocatalytic degradation mechanism. Benzoquinone (BQ), isopropyl alcohol (IPA) and disodium ethylenediamine (EDTA-2Na) were used to capture superoxide radical (˙O2−), hydroxyl radical (˙OH) and photogenerated hole (h+) quencher.48 Addition of BQ, IPA and EDTA-2Na inhibited the photocatalytic degradation efficiency with varying degrees. However, the degradation efficiency of CIP decreased obviously with adding BQ and EDTA-2Na (Fig. 12), indicating that ˙O2− and h+ played the primary roles in the photocatalytic process. But ˙OH was not the principal factor for the CIP solution degradation process.
Fig. 12. The effect of active species on the photodegradation of CIP by C/BiOBr.
Based on the above results, the C/BiOBr composite materials exhibited high adsorption capacity and photocatalytic performance at the same time, and thereby realized the synergistic effect of adsorption and photocatalysis, and a cooperative removal mechanism was proposed, as shown in Fig. 13. In the process of synergistic treatment, due to the introduction of biochar, the π–π interaction with CIP molecules quickly adsorbed them on the surface of the C/BiOBr composite material,49 thereby reduced the diffusion distance of CIP and improved the photocatalytic efficiency. In XPS analysis, C O (288.44 eV) was observed in the characteristic peak of C 1s, which may be due to the formation of the C–O–Bi bond. At the same time, there will be a certain combination of van der Waals forces between BiOBr and C, which was very beneficial for the close contact between C and BiOBr. This led to a stable C/BiOBr structure.50 According to the active species capture experiments, it was judged that ˙O2− and h+ were the main active species, so we inferred that the possible removal mechanism was because BiOBr was an oxidation-type photocatalyst with a larger work function and a lower Fermi level.51 Therefore, when C and BiOBr were in close contact, an internal electric field from C to BiOBr was formed at the interface. Once irradiated with light, due to the main induction of the internal electric field, the photogenerated electrons (e−) on the CB of BiOBr were very likely to be transferred to the surface of biochar.52 Therefore, O2 molecules and e− on the surface of biochar produced ˙O2−, and h+ was generated in the VB of BiOBr; the adsorbed CIP molecules were oxidized by free radicals (especially ˙O2−) due to the high concentration. In addition, CIP molecules (free CIP) in solution will be degraded by h+.53 In the whole process, CIP was not only adsorbed on the surface of biochar, but also established a fast electron transfer path of the Bi–O–C bond with BiOBr due to the introduction of biochar. The adsorption capacity was improved and the recombination of electrons and holes was inhibited, thus realizing the synergistic effect of adsorption and photocatalysis.
Fig. 13. Schematic diagram of the CIP photodegradation reaction mechanism of the C/BiOBr catalyst under sunlight irradiation.
Conclusions
A series of C/BiOBr composite materials were successfully synthesized by a one-step solvothermal method. The adsorption capacity and the photocatalytic capacity of the samples were significantly improved compared to that of BiOBr. The CIP adsorption capacity of 2% C/BiOBr composites was increased by 1.45 times, and the photocatalytic efficiency was increased by 1.8 times. When the initial concentration of CIP was 10 mg L−1 (1.0 g L−1 catalyst dosage and pH = 7) the degradation rate to CIP reached 96.8%. The active species capture experiment demonstrated that ˙O2− and h+ played significant roles in the photocatalytic process of CIP. Besides, after four cycles, the 2% C/BiOBr composite material still retained favourable stability. The study provided a cost-effective and high photocatalytic activity catalyst with both adsorption and catalysis synergistic mode to remove CIP from water, which is a meaningful strategy for environmental protection.
Conflicts of interest
There are no conflicts to declare.
Supplementary Material
Acknowledgments
This work was supported by the Science and Technology Department of Jilin Province (20190303086SF), (20200201011JC) and (20200201210JC).
Notes and references
- Wang C. Gao S. Zhu J. Xia X. Wang M. Xiong Y. J. Environ. Sci. (China) 2021;99:249–259. doi: 10.1016/j.jes.2020.04.026. [DOI] [PubMed] [Google Scholar]
- Qu J. Du Y. Feng Y. Wang J. He B. Du M. Liu Y. Jiang N. Mater. Sci. Semicond. Process. 2020;112:105023. doi: 10.1016/j.mssp.2020.105023. [DOI] [Google Scholar]
- Xu X. Ding X. Yang X. Wang P. Li S. Lu Z. Chen H. J. Hazard. Mater. 2019;364:691–699. doi: 10.1016/j.jhazmat.2018.10.063. [DOI] [PubMed] [Google Scholar]
- Li S. Zhang X. Huang Y. J. Hazard. Mater. 2017;321:711–719. doi: 10.1016/j.jhazmat.2016.09.065. [DOI] [PubMed] [Google Scholar]
- Ma Y. Li S. RSC Adv. 2019;9:33519–33524. doi: 10.1039/C9RA08145C. [DOI] [PMC free article] [PubMed] [Google Scholar]
- Thi Thanh Nhi L. Van Thuan L. My Uyen D. Nguyen M. H. Thu V. T. Khieu D. Q. Sinh L. H. RSC Adv. 2020;10:16330–16338. doi: 10.1039/D0RA01854F. [DOI] [PMC free article] [PubMed] [Google Scholar]
- Guo H. Jiang N. Wang H. Shang K. Lu N. Li J. Wu Y. Chemosphere. 2019;230:190–200. doi: 10.1016/j.chemosphere.2019.05.011. [DOI] [PubMed] [Google Scholar]
- Kebaili I. Boukhris I. Sayyed M. I. Tonguc B. Al-Buriahi M. S. Ceram. Int. 2020;46:25671–25677. doi: 10.1016/j.ceramint.2020.07.042. [DOI] [PMC free article] [PubMed] [Google Scholar]
- Lin B. Li S. Peng Y. Chen Z. Wang X. J. Hazard. Mater. 2020;406:124675. doi: 10.1016/j.jhazmat.2020.124675. [DOI] [PubMed] [Google Scholar]
- Wang W. Zhang J. Chen T. Sun J. Ma X. Wang Y. Wang J. Xie Z. Sci. Rep. 2020;10:6588. doi: 10.1038/s41598-020-62791-5. [DOI] [PMC free article] [PubMed] [Google Scholar]
- Hua C. L. Liu X. Y. Ren S. X. Zhang C. W. Liu W. B. Ecotoxicol. Environ. Saf. 2020;202:110897. doi: 10.1016/j.ecoenv.2020.110897. [DOI] [PubMed] [Google Scholar]
- Liang Z. Y. Zhou C. X. Yang J. Mo Q. F. Zhang Y. M. Tang Y. Inorg. Chem. Commun. 2018;93:136–139. doi: 10.1016/j.inoche.2018.05.022. [DOI] [Google Scholar]
- He Q. Ni Y. H. Ye S. Y. J. Phys. Chem. Solids. 2017;104:286–292. doi: 10.1016/j.jpcs.2017.01.020. [DOI] [Google Scholar]
- Wang Z.-Q. Wang H. Wu X.-F. Chang T.-L. J. Alloy. Compd. 2020;834:155025. doi: 10.1016/j.jallcom.2020.155025. [DOI] [Google Scholar]
- Huang S. Wang G. Liu J. Du C. Su Y. ChemCatChem. 2020;12:4431–4445. doi: 10.1002/cctc.202000634. [DOI] [Google Scholar]
- Ao Y. Tang H. Wang P. Wang C. Hou J. Qian J. Composites, Part B. 2014;59:96–100. doi: 10.1016/j.compositesb.2013.10.045. [DOI] [Google Scholar]
- Yan P. Jiang D. Tian Y. Xu L. Qian J. Li H. Xia J. Li H. Biosens. Bioelectron. 2018;111:74–81. doi: 10.1016/j.bios.2018.03.054. [DOI] [PubMed] [Google Scholar]
- Lv X. Yan D. Y. S. Lam F. L.-Y. Ng Y. H. Yin S. An A. K. Chem. Eng. J. 2020;401:126012. doi: 10.1016/j.cej.2020.126012. [DOI] [Google Scholar]
- Juntrapirom S. Anuchai S. Thongsook O. Pornsuwan S. Meepowpan P. Thavornyutikarn P. Phanichphant S. Tantraviwat D. Inceesungvorn B. Chem. Eng. J. 2020;394:124934. doi: 10.1016/j.cej.2020.124934. [DOI] [Google Scholar]
- Deng W. Pan F. P. Batchelor B. Jung B. M. Zhang P. Abdel-Wahab A. Zhou H. C. Li Y. J. Environ. Sci. Water Resour. 2019;5:769–781. [Google Scholar]
- Liu X. Cai L. Appl. Surf. Sci. 2018;445:242–254. doi: 10.1016/j.apsusc.2018.03.178. [DOI] [Google Scholar]
- Guo J. Yan D. Y. S. Lam F. L. Y. Deka B. J. Lv X. Ng Y. H. An A. K. Chem. Eng. J. 2019;378:122137. doi: 10.1016/j.cej.2019.122137. [DOI] [Google Scholar]
- Dumrongrojthanath P. Phuruangrat A. Doungarno K. Thongtem T. Patiphatpanya P. Thongtem S. Ceram. Int. 2018;44:S148–S151. doi: 10.1016/j.ceramint.2018.08.128. [DOI] [Google Scholar]
- Du M. Du Y. Feng Y. Li Z. Wang J. Jiang N. Liu Y. Cellulose. 2019;26:5543–5557. doi: 10.1007/s10570-019-02474-1. [DOI] [Google Scholar]
- Liu B. Han X. Wang Y. Fan X. Wang Z. Zhang J. Shi H. J. Mater. Sci.: Mater. Electron. 2018;29:14300–14310. doi: 10.1007/s10854-018-9564-4. [DOI] [Google Scholar]
- Allagui L. Chouchene B. Gries T. Medjahdi G. Girot E. Framboisier X. Amara A. B. h. Balan L. Schneider R. Appl. Surf. Sci. 2019;490:580–591. doi: 10.1016/j.apsusc.2019.06.091. [DOI] [Google Scholar]
- Zhao C. Li W. Liang Y. Tian Y. Zhang Q. Appl. Catal., A. 2016;527:127–136. doi: 10.1016/j.apcata.2016.09.005. [DOI] [Google Scholar]
- Shang J. Gao Y. Zhao B. Shen S. Wang X. J. Mater. Sci.: Mater. Electron. 2020;31:20858–20867. doi: 10.1007/s10854-020-04599-7. [DOI] [Google Scholar]
- Chang L. Pu Y. Shen G. Cui Y. Wei X. Cao B. Yu Y. Xu S. New J. Chem. 2020;44:2479–2488. doi: 10.1039/C9NJ06060J. [DOI] [Google Scholar]
- Patil S. P. Patil R. P. Mahajan V. K. Sonawane G. H. Shrivastava V. S. Sonawane S. Mater. Sci. Semicond. Process. 2016;52:55–61. doi: 10.1016/j.mssp.2016.05.008. [DOI] [Google Scholar]
- Alansi A. M. Al-Qunaibit M. Alade I. O. Qahtan T. F. Saleh T. A. J. Mol. Liq. 2018;253:297–304. doi: 10.1016/j.molliq.2018.01.034. [DOI] [Google Scholar]
- Geng A. Xu L. Gan L. Mei C. Wang L. Fang X. Li M. Pan M. Han S. Cui J. Chemosphere. 2020;250:126291. doi: 10.1016/j.chemosphere.2020.126291. [DOI] [PubMed] [Google Scholar]
- Zarezadeh S. Habibi-Yangjeh A. Mousavi M. Adv. Powder Technol. 2019;30:1197–1209. doi: 10.1016/j.apt.2019.03.016. [DOI] [Google Scholar]
- Tie W. Du Z. Yue H. Sarathi Bhattacharyya S. Zheng Z. He W. Hee Lee S. J. Colloid Interface Sci. 2020;579:862–871. doi: 10.1016/j.jcis.2020.06.088. [DOI] [PubMed] [Google Scholar]
- Zheng X. Xu S. Wang Y. Sun X. Gao Y. Gao B. J. Colloid Interface Sci. 2018;527:202–213. doi: 10.1016/j.jcis.2018.05.054. [DOI] [PubMed] [Google Scholar]
- Wu X. Zhang K. Zhang G. Yin S. Chem. Eng. J. 2017;325:59–70. doi: 10.1016/j.cej.2017.05.044. [DOI] [Google Scholar]
- Chen M. Dai Y. Guo J. Yang H. Liu D. Zhai Y. Appl. Surf. Sci. 2019;493:1361–1367. doi: 10.1016/j.apsusc.2019.04.160. [DOI] [Google Scholar]
- Wang H. Zhang J. Wang P. Yin L. Tian Y. Li J. Chin. Chem. Lett. 2020;31:2789–2794. doi: 10.1016/j.cclet.2020.07.043. [DOI] [Google Scholar]
- Wang W. Ding X. He M. Wang J. Lou X. Anal. Chem. 2014;86:10186–10192. doi: 10.1021/ac502440h. [DOI] [PMC free article] [PubMed] [Google Scholar]
- Igwegbe C. A. Oba S. N. Aniagor C. O. Adeniyi A. G. Ighalo J. O. J. Ind. Eng. Chem. 2021;93:57–77. doi: 10.1016/j.jiec.2020.09.023. [DOI] [Google Scholar]
- Yan Y. Sun S. Song Y. Yan X. Guan W. Liu X. Shi W. J. Hazard. Mater. 2013;250–251:106–114. doi: 10.1016/j.jhazmat.2013.01.051. [DOI] [PubMed] [Google Scholar]
- Li J. Yu G. Pan L. Li C. You F. Xie S. Wang Y. Ma J. Shang X. J. Environ. Sci. (China) 2018;73:20–30. doi: 10.1016/j.jes.2017.12.024. [DOI] [PubMed] [Google Scholar]
- Hu K. Li R. Ye C. Wang A. Wei W. Hu D. Qiu R. Yan K. J. Cleaner Prod. 2020;253:120055. doi: 10.1016/j.jclepro.2020.120055. [DOI] [Google Scholar]
- Yao Q. Fan B. Xiong Y. Jin C. Sun Q. Sheng C. Sci. Rep. 2017;7:45914. doi: 10.1038/srep45914. [DOI] [PMC free article] [PubMed] [Google Scholar]
- Ghasemipour P. Fattahi M. Rasekh B. Yazdian F. Sci. Rep. 2020;10:4414. doi: 10.1038/s41598-020-61367-7. [DOI] [PMC free article] [PubMed] [Google Scholar]
- Li H. Wu W. Hao X. Wang S. You M. Han X. Zhao Q. Xing B. Environ. Pollut. 2018;243:206–217. doi: 10.1016/j.envpol.2018.08.059. [DOI] [PubMed] [Google Scholar]
- Wang F. Feng Y. Chen P. Wang Y. Su Y. Zhang Q. Zeng Y. Xie Z. Liu H. Liu Y. Lv W. Liu G. Appl. Catal., B. 2018;227:114–122. doi: 10.1016/j.apcatb.2018.01.024. [DOI] [Google Scholar]
- Chen Z. Liang J. Xu X. He G. Chen H. J. Mater. Sci. 2020;55:6065–6077. doi: 10.1007/s10853-020-04413-z. [DOI] [Google Scholar]
- Li J. Pan L. Yu G. Li C. Xie S. Wang Y. Environ. Res. 2021;192:110258. doi: 10.1016/j.envres.2020.110258. [DOI] [PubMed] [Google Scholar]
- Xiong J. Li X. Huang J. Gao X. Chen Z. Liu J. Li H. Kang B. Yao W. Zhu Y. Appl. Catal., B. 2020;266:118602. doi: 10.1016/j.apcatb.2020.118602. [DOI] [Google Scholar]
- Li X. Xiong J. Gao X. Ma J. Chen Z. Kang B. Liu J. Li H. Feng Z. Huang J. J. Hazard. Mater. 2020;387:121690. doi: 10.1016/j.jhazmat.2019.121690. [DOI] [PubMed] [Google Scholar]
- Li X. Kang B. Dong F. Zhang Z. Luo X. Han L. Huang J. Feng Z. Chen Z. Xu J. Peng B. Wang Z. L. Nano Energy. 2021;81:105671. doi: 10.1016/j.nanoen.2020.105671. [DOI] [Google Scholar]
- Li J. Pan L. Yu G. Xie S. Li C. Lai D. Li Z. You F. Wang Y. Sci. Total Environ. 2019;654:1284–1292. doi: 10.1016/j.scitotenv.2018.11.013. [DOI] [PubMed] [Google Scholar]


