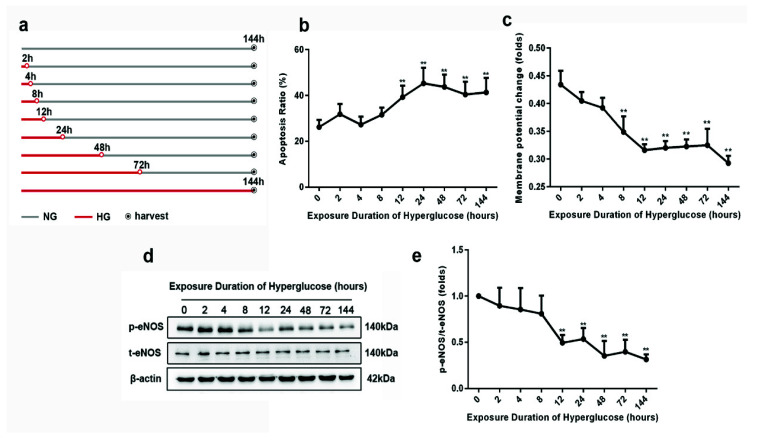
Figure 1.
Metabolic memory formation in HUVECs after different high-glucose exposure times. (a) Scheme of cell culture. (b) Apoptosis assay. (c) Depolarization of mitochondrial membrane potential (MMP). (d) The protein expression of phosphorylated eNOS and total eNOS. (e) Quantitative analysis of eNOS phosphorylation, obtained by normalization based on the ratio of phosphorated-eNOS expression to total-eNOS expression. Data are expressed as the mean ± SEM. n = 3 for each group. ** p < 0.01 vs. the normal-glucose group.

