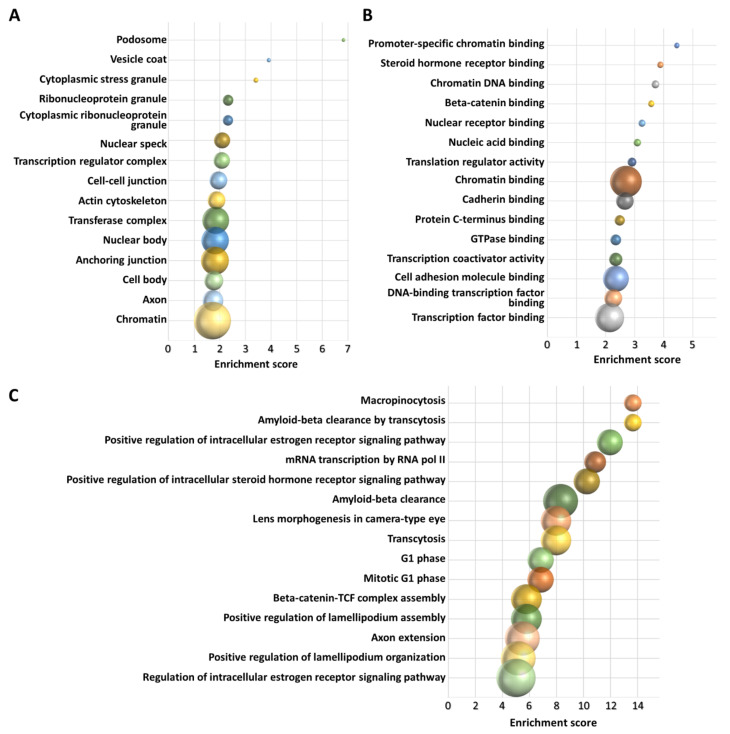
Figure 7.
The results of functional GO analysis for 3′-tRF-LeuAAG/TAG. The cellular components (A), molecular functions (B), and biological processes (C) showing the highest enrichment scores are shown in the charts. The size of each bubble indicates the number of genes implicated. Each chart is drawn in scale.

