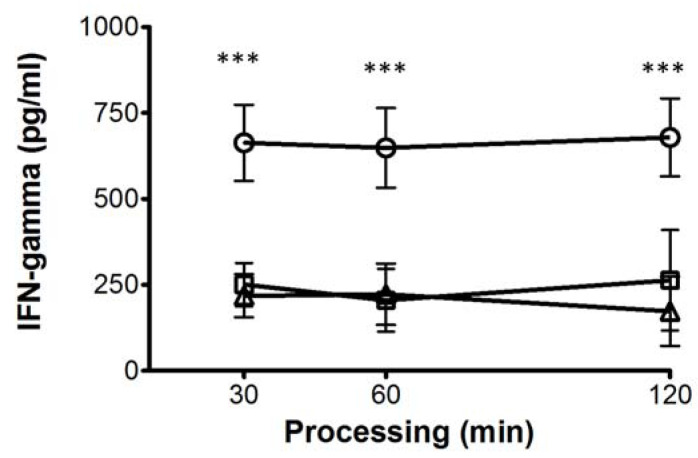
Figure 7.
Effect of high glucose concentrations on the processing and presentation of M. tuberculosis antigens by DCs. Concentration of IFN-γ in the supernatants of co-cultured CD4+ T cells in presence of 5.5 (open circles), 11 (open squares), and 30 mM (open triangles) of glucose for 6 days infected with Mtb, assayed by ELISA. Data were analyzed using Friedman test. Data were expressed as mean ± standard deviation. Differences were considered significant when *** p < 0.0001; from five independent experiments.

