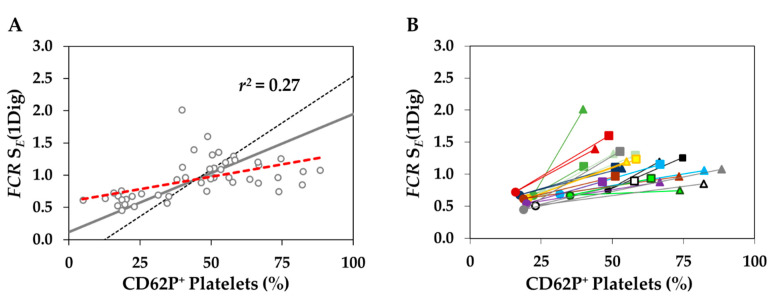
Figure 8.
The relationship between PLT activation and mitochondrial respiration of PLT in the S-pathway. Respiration of permeabilized PLT in the S-pathway (SE, expressed as FCR normalized for ET capacity E of living cells, FCR = SE/E), and PLT activation expressed as a percentage of CD62P positive cells. (A) Regression analysis according to [49] where the red dotted line represents ordinary Y/X regression and the black dotted line represents ordinate projection of abscissal regression with inverted parameters X/Y, and the grey line represents mean regression line; r2 is independent of axes inversion. (B) Data points for individual blood donors are connected by a full line from DC (triangles) to PA (circles) and WA (squares); each color indicates a different donor.

