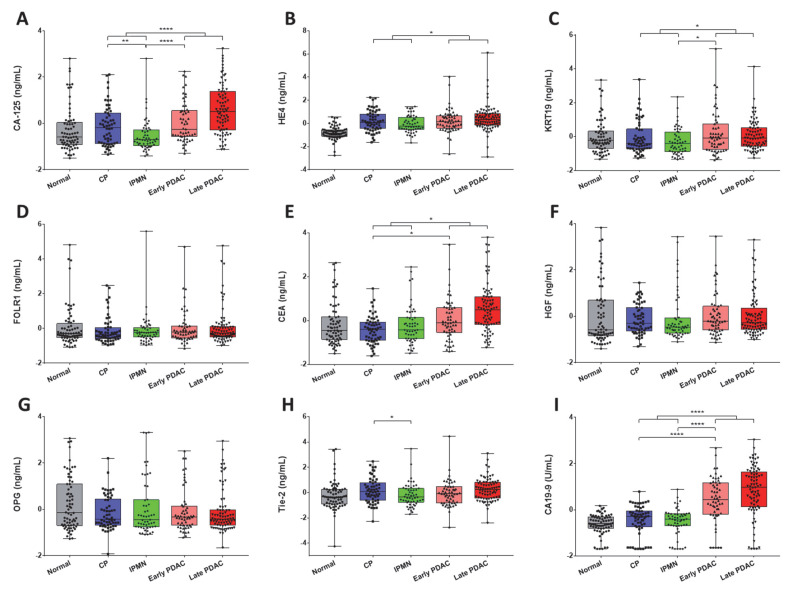
Figure 2.
Analysis of biomarkers in sera from PDAC patients, benign conditions, and healthy controls. (A–I), CA-125, HE4, KRT19, FOLR1, CEA, HGF, OPG, Tie-2, and CA19-9 in PDAC patients, benign conditions, and healthy controls are demonstrated in overlaid scatterplots and boxplots. Only serum levels of biomarkers demonstrating significant differences between CP, IPMN, and early stage PDAC, (or benign and PDAC) are asterisked (Mann–Whitney U test). Biomarker data were transformed prior to analysis (log-transformation followed by z-score). Bars indicate median value. *, p < 0.05; **, p < 0.01; ****, p < 0.0001.

