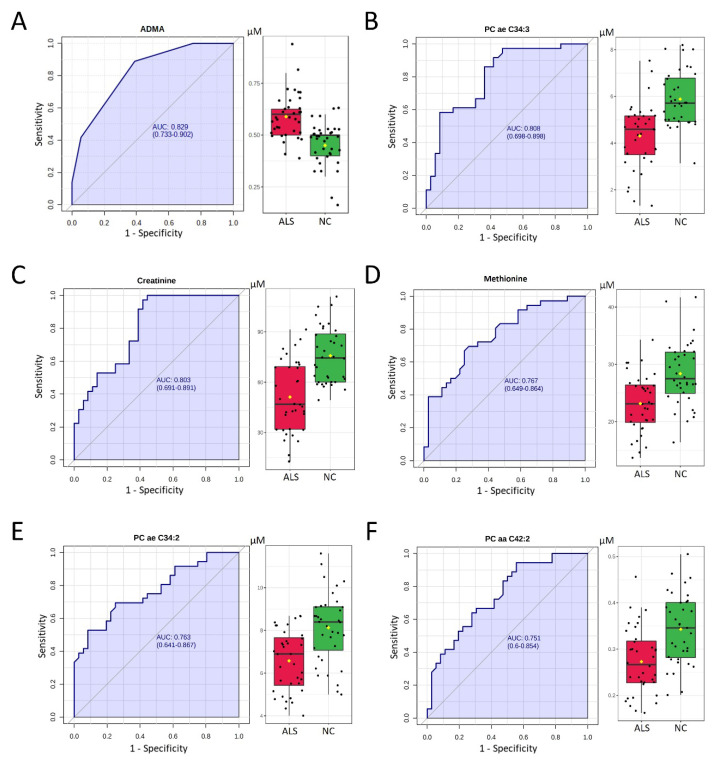
Figure 2.
Receiver operating characteristic (ROC) curve (left panel) and box plot analysis (right panel) of plasma levels of (A) asymmetric dimethylarginine (ADMA), (B) phosphatidylcholine (PC) acyl-alkyl (ae) C34:3, (C) creatinine, (D) methionine, (E) PC ae C34:2, and (F) PC acyl-acyl (aa) C42:2 for the diagnosis of amyotrophic lateral sclerosis (ALS). The area under the ROC curve (AUC) is in shadow. The black center line in the box plot denotes the median, while the blue or green boxes contain the 25th to 75th percentiles for patients with ALS or NC, respectively. The black whiskers mark the 5th and 95th percentiles, and mean values are marked with yellow dots. Two-tailed Student’s t-test. NC: age- and sex-matched controls.

