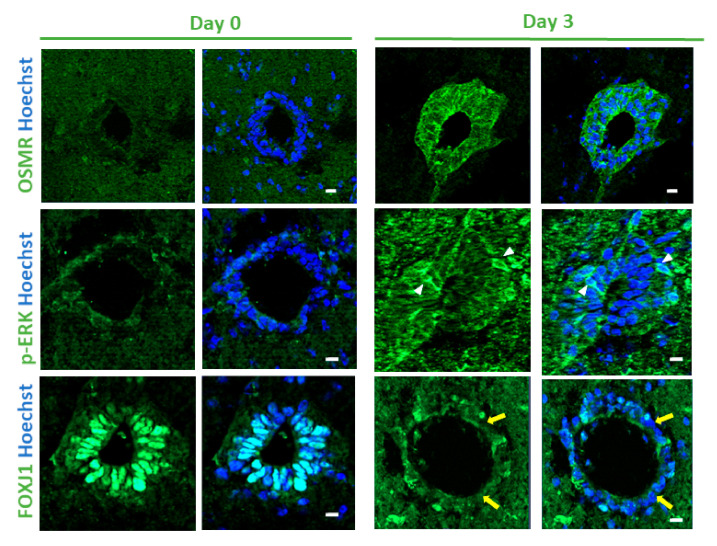
Figure 3.
Spinal cord organotypic slice cultures. Immunofluorescences for indicated proteins performed on spinal cord slices after collection (Day 0) and after 3 days in culture (Day 3). White arrowheads and yellow arrows show examples of positive and negative cells respectively. These images are representative of 3 independent experiments. (n = 4 animals, 5 sections examined per culture). Scale bars = 10 µm.

