

Synopsis
Extant anurans (frogs and toads) exhibit reduced dentition, ranging from a lack of mandibular teeth to complete edentulation, as observed in the true toads of the family Bufonidae. The evolutionary time line of these reductions remains vague due to a poor fossil record. Previous studies have demonstrated an association between the lack of teeth in edentulous vertebrates and the pseudogenization of the major tooth enamel gene amelogenin (AMEL) through accumulation of deleterious mutations and the disruption of its coding sequence. In this study, we have harnessed the pseudogenization of AMEL as a molecular dating tool to correlate loss of dentition with genomic mutation patterns during the rise of the family Bufonidae. Specifically, we have utilized AMEL pseudogenes in three members of the family as a tool to estimate the putative date of edentulation in true toads. Comparison of AMEL sequences from Rhinella marina, Bufo gargarizans and Bufo bufo, with nine extant, dentulous frogs, revealed mutations confirming AMEL inactivation in Bufonidae. AMEL pseudogenes in modern bufonids also exhibited remarkably high 86–93% sequence identity among each other, with only a slight increase in substitution rate and relaxation of selective pressure, in comparison with functional copies in other anurans. Moreover, using selection intensity estimates and synonymous substitution rates, analysis of functional and pseudogenized AMEL resulted in an estimated inactivation window of 46–60 million years ago in the lineage leading to modern true toads, a time line that coincides with the rise of the family Bufonidae.
Introduction
True toads (family Bufonidae) are an enigmatic group of vertebrates with 627 species currently recognized worldwide (Frost 2020). Various hypotheses have been formulated regarding the origin and divergence of bufonids, with scant fossil and molecular evidence pointing to a neotropical or South American origin approximately 65–105 million years ago (MYA) (Zhang et al. 2005; Marjanovic and Laurin 2007; Pramuk et al. 2008; Feng et al. 2017), followed by a rapid, global diversification, excluding Antarctica and Australia (Pramuk et al. 2008). With the exception of Gastrotheca guentheri (Wiens 2011), all anurans have reduced dentition, with complete loss of tooth development, or edentulation, occurring more than 20 times across anurans (Paluh et al. 2021), including in the family Bufonidae (Ford and Cannatella 1993; Davit-Beal et al. 2009; Paluh et al. 2021) (Fig. 1). However, the evolutionary time line and history of edentulation in bufonids remains a mystery, with a particularly depauperate fossil record further impeding scientific analysis (Pauly et al. 2004; Pramuk et al. 2008).
Fig. 1.

MicroCT scan of a Lithobates [Rana] pipiens skull showing maxillary teeth (red triangles) and edentulous mandible, while Rhinella marina exhibits complete edentulation. “Frog” is representative of nonbufonid, dentulous anurans, while “Toad” is representative of Bufonidae
Edentulation is a unique evolutionary event that is accompanied by the pseudogenization of a host of tooth-specific genes (Meredith et al. 2013). Pseudogenization renders a gene nonfunctional through accumulation of frameshift mutations and premature stop codons that disrupt the coding sequence and inactivate it (D'Errico et al. 2004). Since teeth are composed of unique tissues (enamel, dentin, and cementum) (Baranova et al. 2020), cessation of tooth development relaxes selective pressure on the nonpleiotropic genes responsible for producing them, leading to pseudogenization. Some examples of genes that have been inactivated due to edentulation include the following: ACPT (Mu et al. 2021), AMBN (Meredith et al. 2013), AMEL (Meredith et al. 2013), AMTN (Gasse et al. 2012), C4orf26 (Springer et al. 2016), dentin sialophosphoprotein (DSPP) (McKnight and Fisher 2009), ENAM (Meredith et al. 2009), KLK4 (Kawasaki et al. 2014), MMP20 (Meredith et al. 2011), and ODAM (Springer et al. 2019) (species details in Supplementary Table S1).
Three of these genes are evolutionarily related and are involved in the formation of tooth enamel—ameloblastin (AMBN), amelogenin (AMEL), and enamelin (ENAM)—coding for what are referred to as “enamel matrix proteins” (Kawasaki and Weiss 2003). Amelogenin is the most abundant protein in developing enamel, accounting for ∼90% of the organic matrix (Termine et al. 1980). AMEL is a relatively small gene of approximately 200 amino acids, 6 exons in most species (7 in humans), with a start codon in exon 2 and a stop codon in exon 7 (Fig. 2). AMEL plays a critical role during amelogenesis by forming the transient organic scaffold for hydroxyapatite crystal deposition and organization during enamel mineralization (Moradian-Oldak et al. 2003).
Fig. 2.

Conserved AMEL structure in representative tetrapod lineages. Exons are depicted as boxes and are drawn to scale; introns are lines and are not to scale. Coding regions are in full color, while non-coding regions are at 50% opacity. Represented species are Human (Homo sapiens; NCBI NM_182680.1), Mouse (Mus musculus; NCBI NM_009666.4), Bovine (Bos taurus; NCBI NM_001014984), Lizard (Anolis carolinensis; NCBI KP792754), Alligator (Alligator mississippiensis; NCBI XM_014607781.2), and Frog (Xenopus tropicalis; NCBI NM_001113681.1)
Here, we present AMEL sequences from three toad species of the family Bufonidae—the cane toad (Rhinella marina), the Asiatic toad (Bufo gargarizans), and the common toad (Bufo bufo). Through comparative analysis with each other and functional orthologs from toothed anurans, we confirm the inactivation of AMEL in Bufonidae. Furthermore, we estimate relaxed selective pressure on inactivated AMEL along with identification of deleterious mutations and increased substitution rate in the stem lineage ancestral to extant bufonids. To determine a time frame for relaxation of selection and edentulation, we employ a formula that utilized selection intensity estimates (dN/dS) in inactivated and functional AMEL, as well as estimated divergence dates of extant lineages. Our analysis of the AMEL pseudogene provides an innovative approach toward understanding the evolutionary history of edentulation in the absence of fossil data.
Materials and methods
Sequence acquisition and alignment
AMEL coding sequences from Lithobates [Rana] pipiens (NCBI AY695795.1—Wang et al. 2005), Ranoidea chloris (NCBI DQ069788.1—Diekwisch et al. 2009), and Xenopus tropicalis (NCBI NM_001113681.1—Toyosawa et al. 1998) were aligned using MUSCLE to confirm exon boundaries (https://www.ebi.ac.uk/Tools/msa/muscle/—Edgar 2004). Known AMEL sequences were then queried using BLAST+ v2.2.18 (Altschul et al. 1990) on an exon-by-exon basis against the following species: Leptobrachium leishanense (NCBI RXON00000000.1—Li et al. 2019), Limnodynastes dumerilii (NCBI WWET00000000.1—Li et al. 2020), Lithobates [Rana] catesbeianus (NCBI LIAG000000000.2—Hammond et al. 2017), Nanorana parkeri (NCBI JYOU00000000.1—Sun et al. 2015), Pyxicephalus adspersus (NCBI PZQJ00000000.1—Denton et al. 2018), and Spea multiplicata (NCBI VKOC00000000.1—Seidl et al. 2019). Exons not found by BLAST were queried on the scaffolds/contigs containing identified exons with the “Map to Reference” tool in Geneious v9.1.6 (Kearse et al. 2012). AMEL sequence from Ambystoma mexicanum (NCBI DQ069791.1—Diekwisch et al. 2009) was used as an outgroup.
Ranoidea chloris and P. adspersus AMEL exons were individually queried using BLAST against the R. marina genome assembly (NCBI ONZH00000000.1—Edwards et al. 2018). Rhinella marina exons were subsequently queried against B. gargarizans (NCBI JABFFT000000000.1—Lu et al. 2021) and the common toad (B. bufo) genome (derived from the Natural History Museum, London; Voucher: NHMUK/BMNH 2013.484: Field ID: JWS 758). For B. bufo genome assembly, Pacific Biosciences subreads uploaded (https://vgp.github.io/genomeark/Bufo_bufo/) on or prior to May 11, 2019 were assembled with Flye (commit 92b62e6) (Kolmogorov et al. 2019). Subreads were then mapped to the output assembly with BLASR (commit 4323a52) (Chaisson and Tesler 2012) and error corrected with PBDAGCon (commit 1a2f1e7) (Chin et al. 2013) twice using the map4cns pipeline (commit dd89f52; https://bitbucket.org/rokhsar-lab/map4cns). Scaffolds were numbered by size using SeqKit v0.7.2-dev (Shen et al. 2016). Only AMEL was extracted from the assembly and analyzed, following the “Embargo Data Use Policy for the International Reference Vertebrate Genomes Project (VGP) by the G10K and Affiliated Groups” that exempts “analyses of … a single locus.”
Geneious v9.1.6 (Kearse et al. 2012) was used for AMEL exon concatenation, translation, and percent identity calculation. For codon alignments, a multiple sequence alignment of the amino acid sequences was first generated using MUSCLE (Edgar 2004), and then back-translated with PAL2NAL (http://www.bork.embl.de/pal2nal/—Suyama et al. 2006).
Phylogenic analyses
A phylogenetic tree of AMEL coding sequences was generated with MrBayes v3.2 (Ronquist and Huelsenbeck 2003), with A. mexicanum as an outgroup. Analysis was run with the following parameters: Ngen = 1,000,000, Samplefreq = 500, and burnin = 500 (25%). Each analysis was allowed to run until the standard deviation for split frequencies was less than 0.01, indicating a plateau of the likelihood score. Resulting trees were merged into a 50% majority rule consensus tree. Species tree is based on relationships as described by Feng et al. (2017). Divergence time estimates were obtained from Feng et al. (2017). Maximum-likelihood phylogeny was generated with RAxML GUI v1.5 (Silvestro and Michalak 2012).
Selection analysis
The ratio of nonsynonymous to synonymous substitutions (dN/dS or ω) was estimated using the CODEML program in PAML v4.8 (Yang 2007). The ω value indicates selection pressure on a coding nucleotide sequence, such that ω significantly greater than 1 (dN > dS) infers positive selection, ω equal to 1 (dN = dS) infers neutral selection, and ω significantly less than 1 (dN < dS) infers negative or purifying selection. Within CODEML, branch-specific codon models were applied in order to analyze selective pressure on clades, using a species tree based on Feng et al. (2017). The free-ratio model (M1) is the most general and parameter-rich model, allowing for different ω values for each branch. The one-ratio model (M0) is the simplest and assumes the same ω for all branches. The two-ratio (M2) and three-ratio (M3) models are intermediate and allow for two or more ω values within the tree, based on user-specified labels. In model M2, the stem bufonid branch, which is proposed to have a mixed evolutionary history of functional and inactivated AMEL, was grouped with the pseudogenized, extant bufonids as one clade (ωs+p), while the functional frog branches were kept as the other clade (ωf). In model M3, the functional branches (ωf), the pseudogenized clade (ωp), and the stem branch leading to bufonids (ωs) were labeled separately.
CODEML analyses were performed with three different codon frequency models—CF1, CF2, and CF3. In CF1, codon frequencies are estimated from average frequencies across all three positions in a codon. In CF2, codon frequencies are estimated from mean nucleotide frequencies at each individual codon position. In CF3, codon frequencies are used as free parameters. The numbers of parameters involved in the three CF models are 3, 9, and 60, respectively (Yang 1998, 2007). Likelihood estimates for each model were analyzed using a hierarchical likelihood ratio test (LRT) [2Δl = 2(l1 − l0)], with resulting value assessed using a Chi-squared test (Yang 1998). Bonferroni corrections for multiple comparisons were applied.
Due to the disrupted coding sequences in bufonid AMEL, the codon alignment of anuran AMEL used in the CODEML analyses was pre-filtered based on the following criteria: all sites with frameshift insertions in bufonids (and associated codons), all sites unique to a single taxon (and associated codons), as well as codons unique to a single taxon, were removed. Stop codons in bufonid pseudogene sequences were recoded as missing data (Meredith et al. 2009; Springer et al. 2016). The resulting, filtered alignment contained 576 aligned positions (192 codons) from 13 taxa, including A. mexicanum as an outgroup.
Substitution rate analysis
Substitution rates were estimated using BASEML in PAML v4.8 (Yang 2007) from the above-described, filtered alignment and divergence times from Feng et al. (2017). Following the parameters of Lemey and Posada (2009), three clock models were analyzed and tested against each other for goodness of fit: clock = 0—no clock, clock = 1—single clock across the entire tree, and clock = 2—local clocks for designated branches or clades. Local clock analysis was used to calculate substitution rates for the pseudogenized bufonid branches, the stem branch to Bufonidae, and the functional branches in dentulous anurans. Results were analyzed using a LRT (Yang 1998).
Saturation analysis
Over time, genetic sequences accumulate repeated synonymous substitutions that eventually “saturate” the sequence and limit its phylogenetic signal. In dN/dS analysis, this could result in an underestimated dS and overestimated ω (Gojobori 1983). To test for saturation, we calculated the critical index of substitution (Iss.c) and the index of substitution saturation (Iss) with DAMBE7 (Xia and Xie 2001; Xia and Lemey 2009). If Iss > Iss.c, the sequence is highly saturated and inadequate for phylogenetic inquiry (Xia and Xie 2001; Xia and Lemey 2009).
Calculation of AMEL inactivation date
To estimate the date of AMEL inactivation in the lineage leading to modern bufonids, we utilized a series of equations from Meredith et al. (2009), with species divergence dates from Feng et al. (2017). A detailed description of the equations may be found in the Supplementary Methods. We used divergence dates of 9.23 MY between B. bufo and B. gargarizans, 21.56 MY between Bufo sp. and R. marina, and 64.17 MY between Bufonidae and Hylidae. The length of the stem bufonid branch was calculated by subtracting the 21.56 MY Bufo—Rhinella divergence date from the estimated bufonid—nonbufonid frog divergence time 64.17 MY, obtaining a stem length of 42.61 MY. ω and dS values were obtained from CODEML analysis using model M3 (Table 1). Inactivation date was calculated by subtracting the average estimated Tf from 64.17 (the date of divergence between Bufonidae and Hylidae).
Table 1.
Selection analysis with codon frequency models 1, 2, and 3
| Model | ω categories | ωf | ωp | ωs | LRT | 2Δln | df | P-value | |
|---|---|---|---|---|---|---|---|---|---|
| CF1 | M0: One ratio | NA | 0.23 | ||||||
| M1: Free ratio | Ω | M0 versus M2 | 59.31 | 2 | 6.6e−14 | ||||
| M2: Two ratio | ωf, ωs+p, | 0.18 | 1.1 | M0 versus M3 | 60.09 | 3 | 2.8e−14 | ||
| M3: Three ratio | ωf, ωs,ωp, | 0.18 | 1.3 | 0.84 | M2 versus M3 | 0.78 | 1 | 0.31 | |
| CF2 | M0: One ratio | NA | 0.24 | ||||||
| M1: Free ratio | Ω | M0 versus M2 | 54.36 | 2 | 7.9e−13 | ||||
| M2: Two ratio | ωf, ωs+p, | 0.19 | 1.1 | M0 versus M3 | 55.46 | 3 | 2.7e−12 | ||
| M3: Three ratio | ωp, ωf, ωs | 0.19 | 1.4 | 0.82 | M2 versus M3 | 0.075 | 1 | 0.22 | |
| CF3 | M0: One ratio | NA | 0.25 | ||||||
| M1: Free ratio | Ω | M0 versus M2 | 46.00 | 2 | 5.1e−11 | ||||
| M2: Two ratio | ωf, ωs+p, | 0.20 | 1.1 | M0 versus M3 | 46.53 | 3 | 2.1e−10 | ||
| M3: Three ratio | ωp, ωf, ωs | 0.20 | 1.3 | 0.87 | M2 versus M3 | 0.023 | 1 | 0.42 |
CF1 = codon frequency model 1, CF2 = codon frequency model 2, CF3 = codon frequency model 3.
ωf = dN/dS value from branches with functional AMEL (nonbufonid, dentulous frogs).
ωp = dN/dS value from branches with pseudogenized AMEL (Bufonidae).
ωs = dN/dS value from stem bufonid branch.
MicroCT scan segmentation and processing
MicroCT scans depicted in Fig. 1 are of the leopard frog (Lithobates [Rana] pipiens—MorphoSource identifier: 000169944) and the cane toad (R. marina—MorphoSource identifier: 000043841). Files were downloaded from www.morphosource.org and segmented in 3DSlicer v.4.2.2 (http://www.slicer.org). All figures were compiled in Adobe Photoshop and Adobe Illustrator (Adobe Systems Inc., San Jose, CA).
Results
AMEL pseudogenes in bufonidae share deleterious insertions and deletions
AMEL exons 2, 3, 5, and 6 were analyzed in three bufonid species, covering >98% of the AMEL coding sequence. At least one inactivating mutation was identified in each exon (Fig. 3). Exon 2 contains a mutated start codon in bufonids, albeit with different sequences (ACC in R. marina and GCC in B. bufo and B. gargarizans); a shared 4-bp frameshift deletion at positions 34–37; and a shared GT to GG mutation at the splice donor site for intron 2.
Fig. 3.

Nucleotide alignment of exons 2–6. Bufonid AMEL pseudogenes share deleterious mutations not found in dentulous anurans or salamander. Red box denotes loss of start codon (“ACC” in R.m. and “GCC” in B.b. and B.g.), green boxes denote frameshift deletions, blue boxes denote frameshift insertions, red text indicates premature stop codons, and purple text indicates donor and acceptor splice site mutations. Species include three members of Bufonidae (Rhinella marina, Bufo bufo and Bufo gargarizans), four nonbufonid frogs (Ranoidea chloris, Lithobates [Rana] pipiens, Xenopus tropicalis, and Scaphiopus multiplicatus), and one salamander (Ambystoma mexicanum)
Exon 3 is largely intact with the exception of a shared premature stop codon between R. marina and B. bufo, resulting from the change in reading frame introduced by the 4-bp deletion in exon 2; a 1-bp deletion at position 101 in B. bufo; a 1-bp deletion at position 73 in B. gargarizans; and a GT to TT mutation of the splice donor site for intron 3 in R. marina and B. gargarizans. Exon 5 contains two 2-bp insertions in all three bufonids at positions 113–114 and 138–139. Bufo bufo contains a premature stop codon due to the frameshift deletion in exon 3. The splice acceptor site for intron 3 and the splice donor site for intron 5 are mutated from AT to TT and from GT to AT, respectively, in all three species.
Exon 6, the largest exon, contains many indels as well as premature stop codons induced by frameshifts. The splice acceptor site for intron 5 is changed from AG to CT in R. marina and B. bufo, and from GT to CC in B. gargarizans. Among the larger deleterious mutations shared across all three bufonids are a 23-bp deletion and a 31-bp insertion. There are also a number of smaller insertions and deletions shared across all three species as well as some that are unique to individual bufonid lineages. The large number of shared, deleterious mutations indicates that AMEL is indeed pseudogenized in Bufonidae and furthermore, that inactivation occurred prior the divergence of Rhinella and Bufo approximately 21 MYA (Feng et al. 2017).
Sequence identities follow evolutionary patterns of respective lineages
We reconstructed phylogenetic trees to examine convergence in the sequences of distantly related species. The Bayesian gene tree (Fig. 4A) largely mirrored the known species topology in anurans according to Feng et al. (2017) (Fig. 4B). Two differences were the unresolved placement of X. tropicalis and the placement of L. dumerilii, with the members of Natatanura (P. adspersus, L. pipiens, L. catesbeianus, and N. parkeri), instead of Hyloidea (R. chloris, B. bufo, and R. marina) (Feng et al. 2017). Interestingly, the position of L. dumerilii in the gene tree exhibited strong support (BPP = 0.89). A maximum-likelihood phylogeny was also generated and revealed a similar topology (including position of L. dumerilii), with the exception of X. tropicalis being placed as an outgroup to the Natatanura + Hyloidea clade (Supplementary Fig. S1).
Fig. 4.

Gene phylogeny and selection intensity follows evolutionary patterns of respective lineages. (A) Bayesian phylogram generated from codon-specific alignment of AMEL. Branch labels represent Bayesian posterior probabilities (BPP) where 0.50 ≤ BPP ≤ 0.99, while unlabeled branches indicate BPP =100. Multifurcations indicate branches with BPP <0.5. Scale bar indicates the number of substitutions per site. Asterisks indicate species where the gene tree and species tree disagree. (B) Evolutionary chronogram with species relationships and divergence date estimates from Feng et al. (2017). Branches are labeled with dN and dS values, estimated in CODEML under a free-ratio model (M1) with CodonFreq = 2. The resulting ω values are included in parentheses in bold. Photo is representative of a R. marina specimen
Transient increase in substitution rate of the stem bufonid lineage
Substitution rate for the AMEL pseudogene in Bufonidae was estimated to be 0.23 ± 0.04 substitutions/site/my, whereas the estimate for functional orthologs in nonbufonid frogs was 0.13 ± 0.01. However, in the stem branch leading to extant bufonids, where it is proposed to have been functional for a period of time before pseudogenization and represents the branch on which inactivation occurred, substitution rate was 1.22 ± 0.15 substitutions/site/my (Fig. 5; Supplementary Table S2).
Fig. 5.
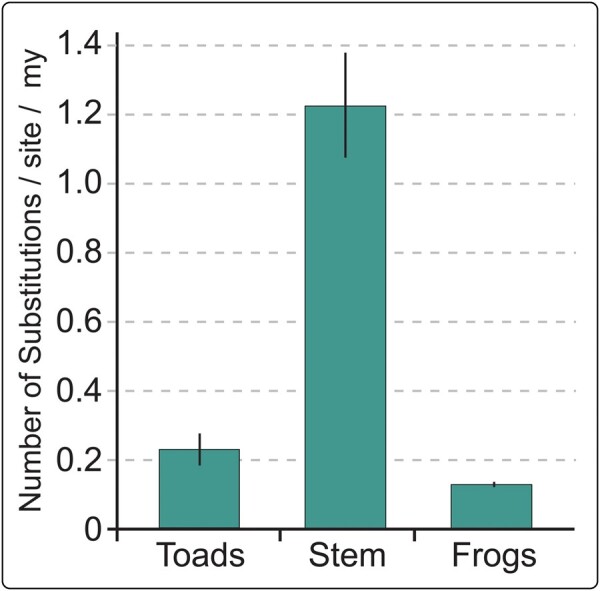
Substitution rate increase in the stem lineage to modern Bufonidae. Substitution rates were estimated under a local clock model for Toads (members of Bufonidae) (0.23 ± 0.04), the stem bufonid branch (1.22 ± 0.15), and Frogs (nonbufonid, dentulous anurans) (0.13 ± 0.01)
High sequence identity between inactivated AMEL orthologs
Sequence identity values reflected the drop in substitution rate in the extant members of Bufonidae as compared with the stem branch. Multiple sequence alignment of nucleotide sequences revealed identities of 92.84% between B. bufo and B. gargarizans, 90.09% between B. bufo and R. marina, 85.87% between B. gargarizans and R. marina. For comparison, in a pair of comparably diverged, functional orthologs in nonbufonid frogs (L. catesbeianus and L. pipiens—12.38MY) sequence identity was 94.72% (Supplementary Table S3).
Selection analysis reveals relaxed selective pressure on inactivated toad AMEL
To analyze selection intensity on the inactivated bufonid sequences, as well as functional orthologs, we first calculated substitution saturation in our dataset and found that Iss = 0.6351 and Iss.c = 0.7291, indicating little to no saturation. We then performed a series of CODEML analyses. For each codon frequency, LRT comparison of the free-ratio model (M1) against one-, two-, and three-ratio models (M0, M2, and M3 respectively) consistently exhibited a significant P-value, finding M1 as a better fit (data not shown), likely due to it being the most general and parameter rich. Therefore, subsequent analyses only compared M0, M2, and M3. Under all three codon frequencies, models M2 and M3 fit the data significantly better than M0, while M2 and M3 were not significantly different (Table 1). M2 and M3 for all three CF categories estimated ωf values between 0.18 and 0.20, indicating purifying selection in functional frog orthologs, while ωp, ωs and ωs+p values ranged between 0.82 and 1.4 (Table 1), indicating neutral to positive selection. ωp values were slightly above 1 in M3, while ωs values were slightly below (Table 1).
Estimation of AMEL inactivation date in toads
Assuming functional and inactivated AMEL have the same synonymous substitution rate (i.e., the stem branch had one synonymous substitution rate across functional and pseudogenized portions), and that the most recent common ancestor of Bufonidae and Hylidae existed 64.17 MYA (Feng et al. 2017), AMEL inactivation occurred 46.33 (48.4–44.26) MYA, or 17.84 ± 2.07 MY after the ancestral branch to Bufonidae diverged from Hylidae (Table 2). Alternatively, assuming different synonymous substitution rates for the functional and pseudogenized portions of the stem branch, inactivation was estimated to have occurred 60.69 (61.31–60.07) MYA, or 3.48 ± 0.62 MY after the Bufonidae–Hylidae divergence.
Table 2.
Estimation of initial AMEL inactivation based on the length of the stem bufonid branch
| CF1 | CF2 | CF3 | Avg ± Stdv | Date (MYA) | |
|---|---|---|---|---|---|
| 1 syn rate | |||||
| ωp = 1.3 | ωp = 1.4 | ωp = 1.3 | |||
| SL = 42.61 my | Tf = 17.58 | Tf = 20.03 | Tf = 15.92 | Tf = 17.84 ± 2.07 | 46.33 ± 2.07 |
| Tp = 25.03 | Tp = 22.58 | Tp = 26.69 | Tp = 24.77 ± 2.07 | ||
| 2 syn rate | |||||
| SL = 42.61 my | Tf = 3.27 | Tf = 4.19 | Tf = 3.0 | Tf = 3.48 ± 0.62 | 60.69 ± 0.62 |
| Tp = 39.34 | Tp = 38.42 | Tp = 39.61 | Tp = 39.13 ± 0.62 |
CF1 = codon frequency model 1, CF2 = codon frequency model 2, CF3 = codon frequency model 3.
ωp = dN/dS for pseudogenic branch category.
Tf = the amount of time that AMEL was functional on the stem branch.
Tp = the amount of time that AMEL was pseudogenic on the stem branch.
1 syn rate = single rate of synonymous substitution on functional and pseudogenic branches.
2 syn rate = two different synonymous substitution rates on functional and pseudogenic portions of stem branch.
Discussion
Here, we present the first enamel matrix protein pseudogene in an edentulous anamniote and propose, for the first time, a putative time frame for edentulation in the true toads of the family Bufonidae. Our approach involved (1) identifying and comparing bufonid AMEL sequences against functional orthologs in dentulous, nonbufonid anurans, (2) establishing that AMEL sequences in Bufonidae are indeed inactivated and under relaxed selection, and (3) estimating the date of inactivation through the analysis of selection intensity estimates for functional and inactivated AMEL orthologs.
Estimated time frame of AMEL inactivation corresponds to the rise of Bufonidae
The prevalence of shared mutations between the three bufonid species indicates, assuming the parsimony principle that these mutations, and therefore edentulation, occurred prior to the divergence of Rhinella and Bufo in the stem branch to extant Bufonidae. Furthermore, CODEML analysis revealed that the selection profile of the stem branch fits better with the pseudogenes in Bufonidae, than with non-bufonid frogs or as its own, independent category, which would indicate that inactivation occurred early in the lineage and the selection pressure that the stem branch experienced was similar to the pseudogenes. In our calculations, we estimated AMEL inactivation to have occurred approximately 46– 60 MYA in the ancestral lineage to Bufonidae. Importantly, this time frame corresponds to the estimated date of 48.9 (43.3–55.1) MYA for the rise of Bufonidae as proposed by Feng et al. (2017), indicating that AMEL inactivation would have occurred early in the history of true toads, around the time that they diverged as a clade. However, even by their own admission, divergence times estimated by Feng and colleagues were younger than those found in most other studies (Feng et al. 2017). For example, most earlier studies place the rise of Bufonidae at approximately 80–100 MYA (Zhang et al. 2005; Marjanovic and Laurin 2007; Pramuk et al. 2008). Be that as it may, the formula used to calculate inactivation dates partitions the mixed stem branch into a ratio of functional and inactivated periods that will scale to any date estimate, should more accurate dates be available in the future. Therefore, using our estimated ω values, the inactivation date of AMEL would still correspond to a time close to the rise of Bufonidae, even if shifted to an earlier or later date.
Does AMEL pseudogenization indicate enamel loss or tooth loss?
In this study, we make two assumptions: (1) that teeth were lost prior to enamel matrix protein degeneration and (2) that in amphibians, inactivation of AMEL is synonymous with complete loss of teeth, similar to whales, birds, and turtles (Meredith et al. 2009, 2011, 2013). In support of our first assumption, we presume that tooth formation stopped prior to the onset of AMEL degeneration because in cases where an enamel-specific gene experiences deleterious mutations but tooth developmental otherwise remains, a condition called amelogenesis imperfecta arises, leading to brittle, functionally deficient enamel caps on teeth (Smith et al. 2017). Teeth covered in brittle enamel are unlikely to be selected for and retained in a population long enough to then be followed by complete tooth loss as we see in bufonids. The scant scientific literature on the topic supports our proposal by revealing that the basis of tooth loss in birds and turtles lies in the loss of gene expression upstream of the odontogenic pathway, so that the stage of enamel production was never reached (Chen et al. 2000; Tokita et al. 2013). This scenario would more likely lead to enamel genes such as AMEL never being expressed, thereby allowing for deleterious mutations to accumulate with little to no negative consequence to the animal.
The only cases where enamel genes accumulate deleterious mutations while still maintaining functional tooth development are in groups such as armadillos and sloths, where the teeth are retained but have lost their enamel caps (Davit-Beal et al. 2009; Meredith et al. 2009; Ciancio et al. 2014). This brings us to our second assumption, that the date of AMEL inactivation in amphibians correlates with edentulation and not just the loss of enamel. We considered the enamel loss scenario based on amphibian enamel being remarkably thin (Diekwisch et al. 2006; Jin et al. 2009), which may allow for enamel loss without significant negative effect. However, mammalian enamel loss is often coincident with hypsodont and hypselodont tooth specializations, characterized by high crowns and complex tooth mineral surfaces for specialized food processing (Jernvall and Fortelius 2002; Kaiser et al. 2013). To the best of our knowledge, there is no evidence of such tooth modifications or enamel loss in any anuran species, and furthermore, this would be unlikely considering that anurans possess simple teeth that are seldom used for food processing (Davit-Beal et al. 2009). Therefore, a scenario where AMEL pseudogenization coincides with enamel loss only, with ancestral bufonids retaining dentin/cementum capped teeth for a meaningful portion of their evolutionary history is unlikely and AMEL pseudogenization likely coincides with complete edentulation. Nonetheless, future analysis of dentin-specific genes, such as DSPP, could shine a light on this scenario.
Was AMEL inactivation neutral or adaptive?
It is unclear whether pseudogenes form through relaxation of selective pressure or increased selection for inactivating mutations (Meredith et al. 2011; Sharma et al. 2018; Springer et al. 2019; Mu et al. 2021). According to traditional thinking, pseudogenes result from a “use it or lose it” principle, where a gene becomes nonfunctional due to relaxation of selective pressure, often attributed to disuse. However, there is an alternative “less is more” hypothesis (Olson 1999), where gene loss provides an evolutionary mechanism for phenotypic change (Sharma et al. 2018). Sharma and colleagues recently described several cases where gene loss appeared to drive adaptation, indicating that disruptive mutations may actually be the drivers of evolutionary change, as opposed to being the result (Sharma et al. 2018).
We show here that bufonid AMEL orthologs contain inactivating mutations and have recently evolved under neutral evolutionary pressure, characteristic of pseudogenes. One could argue that ωp approaching 1.4 in our selection analysis indicates positive selection toward pseudogenization; however, ω surpassing 1.0 by such a small value has previously been noted to be well within the stochastic variation in the estimate of ω (Chang et al. 2005). Furthermore, pseudogenes are expected to mutate at substantially higher rates than functional copies (Li et al. 1981; Bulmer 1986). We find here that bufonid pseudogenes mutate approximately 1.75 times the rate of functional orthologs in nonbufonid anurans. This value is small in comparison with the nearly 10-fold increase in mutation rate in the stem lineage leading to Bufonidae, suggesting a temporary acceleration in substitution rate during early bufonid evolution, potentially correlated with tooth loss and rapid accumulation of inactivating mutations. This pattern suggests an adaptive pseudogenization process that favored rapid inactivation of AMEL. However, our calculated ω values for the stem branch did not surpass 1. This could be due to early and rapid pseudogene fixation in the population, resulting in the stem branch being under neutral selection for most of its history, minimizing the effect of a small number of non-neutral, positively selected sites on the stem branch’s overall ω value. This scenario is plausible since the branch-wide ω in PAML is averaged over all sites that are unlikely to all be affected over a prolonged period of time (Yang 1997, 2007). The fact that CODEML analysis finds that models where the stem branch fits better with fully inactivated branches (M2) than the model where they are considered separate (M3) also support early pseudogene fixation.
Specialization in diet and feeding mechanism likely resulted in edentulation
Anurans are part of a select group of vertebrates that utilize ballistic tongue projection for prey capture (Nishikawa 2000; Lappin et al. 2006). In most species, the tongue is attached to the anterior of the mandible and relies on the transfer of momentum from the opening lower jaw for rapid tongue protraction (Nishikawa and Gans 1996; Lappin et al. 2006; Monroy and Nishikawa 2011). This has led to the evolution of a highly modified oral cavity with distinctive musculature in the jaws and tongue, increased flexibility in the mandibular and mentomeckelian bones, and partial or complete edentulation (Nishikawa and Gans 1996; Nishikawa and Schwenk 2001; Lappin et al. 2006; Davit-Beal et al. 2009).
Anurans primarily use “tongue prehension” for small prey and “jaw prehension” for larger prey (Monroy and Nishikawa 2011). Jaw prehension involves initial contact with the tongue, with subsequent use of the jaws and maxillary teeth in prey capture, followed by transport into the oral cavity with the help of the forelimbs (Monroy and Nishikawa 2011). Tongue prehension involves only the tongue in the capture of smaller prey, followed by direct transport into the esophagus, completely bypassing the jaws (Nishikawa 1999; Monroy and Nishikawa 2011). Generalist frogs such Lithobates [Rana] pipiens alternate between tongue and jaw prehension in response to prey size, while members of Bufonidae only utilize tongue prehension (Nishikawa and Gans 1996; Nishikawa 1999; Monroy and Nishikawa 2011). The strict use of tongue prehension has led to a series of biomechanical specializations such as elongation of the tongue (Nishikawa and Gans 1996), increased flexibility in the mandibular symphysis (Regal and Gans 1976), and specialized musculature for rapid jaw opening and tongue protraction (Nishikawa and Gans 1996; Lappin et al. 2006). By becoming tongue prehension specialists, which includes movement of food directly into the esophagus without processing, bufonids have all but eliminated the interaction of the prey item with their jaw, alleviating the need for teeth.
Moreover, when edentulation in anurans was assessed in a phylogenetic framework, repeated tooth loss events were revealed in lineages that specialize in small, invertebrate prey (Paluh et al. 2021). Such a dietary specialization, coupled with a trend toward tongue prehension, may have been the impetus for edentulation in the ancestor to modern Bufonidae. In fact, studies of stomach content and foraging habits of bufonids in natural environment have suggested that many species are myrmecophagous or ant specialists (Toft 1980; Flowers and Graves 1995; da Rosa et al. 2002; Isacch and Barg 2002; Ferreira and Teixeira 2009), with some of the larger species such as R. marina and Incilius alvarius expanding to a generalist diet that sometimes includes small vertebrates (Pizzatto et al. 2012). In expanding to a broader diet, Incilius alvarius has even evolved neopalatine odontoids to make up for the lack of teeth (Mendelson and Pramuk 1998), reminiscent of mandibular odontoids in nonbufonid frogs that prey on large prey items (Fabrezi and Emerson 2006). That said, it is interesting to note that even in a species as large as R. marina, ants and beetles dominate their diet in certain habitats that are undisturbed by humans (Zug and Zug 1979). Therefore, we propose that early specialization for tongue prehension of small prey likely provided the evolutionary pressure for rapid and complete edentulation in the ancestor to modern true toads of the family Bufonidae, with later expansion to a generalist diet in select groups.
Author contributions
J.A. conceived and designed the study. A.B.M., J.A., J.S., and T.G.H.D. generated data. J.A. and J.S. performed analyses. All authors contributed to the writing and editing of the manuscript and agree with its contents.
Funding
A.B.M. was supported by NIH grants R01GM086321, R01HD080708, T32GM007127, and T32HG000047 and a David L. Boren Fellowship.
Conflict of interest
The authors declare no conflicts of interests.
Supplementary data
Supplementary data available at ICB online.
Data availability
Data available on request.
Supplementary Material
Acknowledgments
We thank Craig Miller for comments on the manuscript. We also thank Dr Xinping Wang for help with frog amelogenins. This research used the National Energy Research Scientific Computing Center, a Department of Energy Office of Science User Facility supported by contract number DE-AC02-05CH11231. Image of R. marina in Fig. 4 courtesy of Underground Reptiles. We would also like to thank the two reviewers for their helpful comments that significantly improved the manuscript.
Contributor Information
John Shaheen, Department of Natural Sciences, University of Michigan-Dearborn, Dearborn, MI 48128, USA.
Austin B Mudd, Department of Molecular and Cell Biology, University of California, Berkeley, CA 94720, USA.
Thomas G H Diekwisch, Center for Craniofacial Research and Diagnosis, Texas A&M University, Dallas, TX 75246, USA.
John Abramyan, Department of Natural Sciences, University of Michigan-Dearborn, Dearborn, MI 48128, USA.
References
- Altschul SF, Gish W, Miller W, Myers EW, Lipman DJ. 1990. Basic local alignment search tool. J Mol Biol 215:403–10. [DOI] [PubMed] [Google Scholar]
- Baranova J, Büchner D, Götz W, Schulze M, Tobiasch E. 2020. Tooth formation: are the hardest tissues of human body hard to regenerate? Int J Mol Sci 21:4031. [DOI] [PMC free article] [PubMed] [Google Scholar]
- Bulmer M. 1986. Neighboring base effects on substitution rates in pseudogenes. Mol Biol Evol 3:322–9. [DOI] [PubMed] [Google Scholar]
- Chaisson MJ, Tesler G. 2012. Mapping single molecule sequencing reads using basic local alignment with successive refinement (BLASR): application and theory. BMC Bioinf 13:238. [DOI] [PMC free article] [PubMed] [Google Scholar]
- Chang SM, Lu Y, Rausher MD. 2005. Neutral evolution of the nonbinding region of the anthocyanin regulatory gene Ipmyb1 in Ipomoea. Genetics 170:1967–78. [DOI] [PMC free article] [PubMed] [Google Scholar]
- Chen Y, Zhang Y, Jiang TX, Barlow AJ, Amand TR, Hu Y, Heaney S, Francis-West P, Chuong CM, Maas R. 2000. Conservation of early odontogenic signaling pathways in aves. Proc Natl Acad Sci U S A 97:10044–9. [DOI] [PMC free article] [PubMed] [Google Scholar]
- Chin C-S, Alexander DH, Marks P, Klammer AA, Drake J, Heiner C, Clum A, Copeland A, Huddleston J, Eichler EE, Turner SW, Korlach J. 2013. Nonhybrid, finished microbial genome assemblies from long-read SMRT sequencing data. Nat Methods 10:563–9. [DOI] [PubMed] [Google Scholar]
- Ciancio MR, Vieytes EC, Carlini AA. 2014. When xenarthrans had enamel: insights on the evolution of their hypsodonty and paleontological support for independent evolution in armadillos. Die Naturwiss 101:715–25. [DOI] [PubMed] [Google Scholar]
- D'Errico I, Gadaleta G, Saccone C. 2004. Pseudogenes in metazoa: origin and features. Briefings Funct Genomics Proteomics 3:157–67. [DOI] [PubMed] [Google Scholar]
- da Rosa I, Canavero A, Maneyro R, Naya DE, Camargo A. 2002. Diet of four sympatric anuran species in a temperate environment. Bol Soc Zool Uruguay 13:12–20. [Google Scholar]
- Davit-Beal T, Tucker AS, Sire JY. 2009. Loss of teeth and enamel in tetrapods: fossil record, genetic data and morphological adaptations. J Anat 214:477–501. [DOI] [PMC free article] [PubMed] [Google Scholar]
- Denton RD, Kudra RS, Malcom JW, Du Preez L, Malone JH. 2018. The African Bullfrog (Pyxicephalus adspersus) genome unites the two ancestral ingredients for making vertebrate sex chromosomes. bioRxiv (doi: 10.1101/329847). [Google Scholar]
- Diekwisch TGH, Jin T, Wang X, Ito Y, Schmidt M, Druzinsky R, Yamane A, Luan X. 2009. Amelogenin evolution and tetrapod enamel structure. Front Oral Biol 13:74–9. [DOI] [PMC free article] [PubMed] [Google Scholar]
- Diekwisch TGH, Wang X, Fan JL, Ito Y, Luan X. 2006. Expression and characterization of a Rana pipiens amelogenin protein. Eur J Oral Sci 114:86–92. [DOI] [PubMed] [Google Scholar]
- Edgar RC. 2004. Muscle: multiple sequence alignment with high accuracy and high throughput. Nucleic Acids Res 32:1792–7. [DOI] [PMC free article] [PubMed] [Google Scholar]
- Edwards RJ, Tuipulotu DE, Amos TG, O'Meally D, Richardson MF, Russell TL, Vallinoto M, Carneiro M, Ferrand N, Wilkins MR, Sequeira F, Rollins LA, Holmes EC, Shine R, White PA. 2018. Draft genome assembly of the invasive cane toad, Rhinella marina. GigaScience 7:giy095 (doi: 10.1093/gigascience/giy095). [DOI] [PMC free article] [PubMed] [Google Scholar]
- Fabrezi M, Emerson SB. 2006. Parallelism and convergence in anuran fangs. J Zool 260:41–51. [Google Scholar]
- Feng YJ, Blackburn DC, Liang D, Hillis DM, Wake DB, Cannatella DC, Zhang P. 2017. Phylogenomics reveals rapid, simultaneous diversification of three major clades of Gondwanan frogs at the Cretaceous-Paleogene boundary. Proc Natl Acad Sci U S A 114:E5864–70. [DOI] [PMC free article] [PubMed] [Google Scholar]
- Ferreira RB, Teixeira RL. 2009. Feeding pattern and use of reproductive habitat of the Striped toad Rhinella crucifer (Anura: Bufonidae) from Southeastern Brazil. Acta Herpetol 4:125–34. [Google Scholar]
- Flowers MA, Graves BM. 1995. Prey selectivity and size-specific diet changes in Bufo cognatus and B. Woodhousii during early postmetamorphic ontogeny. J Herpetol 29:608–12. [Google Scholar]
- Ford LS, Cannatella DC. 1993. The major clades of frogs. Herpetol Monogr 7:94–117. [Google Scholar]
- Frost DR. 2020. Amphibian species of the world: an online reference. Version 6.0. (New York: American Museum of Natural History. [Google Scholar]
- Gasse B, Silvent J, Sire JY. 2012. Evolutionary analysis suggests that amtn is enamel-specific and a candidate for AI. J Dent Res 91:1085–9. [DOI] [PubMed] [Google Scholar]
- Gojobori T. 1983. Codon substitution in evolution and the “saturation” of synonymous changes. Genetics 105:1011–27. [DOI] [PMC free article] [PubMed] [Google Scholar]
- Hammond SA, Warren RL, Vandervalk BP, Kucuk E, Khan H, Gibb EA, Pandoh P, Kirk H, Zhao Y, Jones M, Mungall AJ. 2017. The North American bullfrog draft genome provides insight into hormonal regulation of long noncoding RNA. Nat Commun 8:1–8. [DOI] [PMC free article] [PubMed] [Google Scholar]
- Isacch JP, Barg M. 2002. Are bufonid toads specialized ant-feeders? A case test from the Argentinian flooding pampa. J Natl Hist 36:2005–12. [Google Scholar]
- Jernvall J, Fortelius M. 2002. Common mammals drive the evolutionary increase of hypsodonty in the neogene. Nature 417:538–40. [DOI] [PubMed] [Google Scholar]
- Jin T, Ito Y, Luan X, Dangaria S, Walker C, Allen M, Kulkarni A, Gibson C, Braatz R, Liao X, Diekwisch TGH. 2009. Supramolecular compaction through polyproline motif elongation as a mechanism for vertebrate enamel evolution. PLoS Biol 7:e1000262. [DOI] [PMC free article] [PubMed] [Google Scholar]
- Kaiser TM, Müller DWH, Fortelius M, Schulz E, Codron D, Clauss M. 2013. Hypsodonty and tooth facet development in relation to diet and habitat in herbivorous ungulates: implications for understanding tooth wear. Mammal Rev 43:34–46. [Google Scholar]
- Kawasaki K, Hu JC-C, Simmer JP. 2014. Evolution of Klk4 and enamel maturation in eutherians. Biol Chem 395:1003–13. [DOI] [PMC free article] [PubMed] [Google Scholar]
- Kawasaki K, Weiss KM. 2003. Mineralized tissue and vertebrate evolution: the secretory calcium-binding phosphoprotein gene cluster. Proc Natl Acad Sci U S A 100:4060–5. [DOI] [PMC free article] [PubMed] [Google Scholar]
- Kearse M, Moir R, Wilson A, Stones-Havas S, Cheung M, Sturrock S, Buxton S, Cooper A, Markowitz S, Duran C, Thierer T. 2012. Geneious Basic: an integrated and extendable desktop software platform for the organization and analysis of sequence data. Bioinformatics (Oxford, England) 28:1647–9. [DOI] [PMC free article] [PubMed] [Google Scholar]
- Kolmogorov M, Yuan J, Lin Y, Pevzner PA. 2019. Assembly of long, error-prone reads using repeat graphs. Nat Biotechnol 37:540–6. [DOI] [PubMed] [Google Scholar]
- Lappin AK, Monroy JA, Pilarski JQ, Zepnewski ED, Pierotti DJ, Nishikawa KC. 2006. Storage and recovery of elastic potential energy powers ballistic prey capture in toads. J Exp Biol 209:2535–53. [DOI] [PubMed] [Google Scholar]
- Lemey P, Posada D. 2009. Molecular clock analysis. In: Lemey P, Salemi M, Vandamme A, editors. The phylogenetic handbook: a practical approach to phylogenetic analysis and hypothesis testing. Cambridge: Cambridge University Press. [Google Scholar]
- Li J, Yu H, Wang W, Fu C, Zhang W, Han F, Wu H. 2019. Genomic and transcriptomic insights into molecular basis of sexually dimorphic nuptial spines in leptobrachium leishanense. Nat Commun 10:1–13. [DOI] [PMC free article] [PubMed] [Google Scholar]
- Li Q, Guo Q, Zhou Y, Tan H, Bertozzi T, Zhu Y, Li J, Donnellan S, Zhang G. 2020. A draft genome assembly of the eastern banjo frog Limnodynastes dumerilii dumerilii (Anura: Limnodynastidae). bioRxiv (doi: 10.1101/2020.03.03.971721). [DOI] [PMC free article] [PubMed] [Google Scholar]
- Li WH, Gojobori T, Nei M. 1981. Pseudogenes as a paradigm of neutral evolution. Nature 292:237–9. [DOI] [PubMed] [Google Scholar]
- Lu B, Jiang J, Wu H, Chen X, Song X, Liao W, Fu J. 2021. A large genome with chromosome‐scale assembly sheds light on the evolutionary success of a true toad (Bufo gargarizans). Mol Ecol Res Early View 21:1256–73. [DOI] [PubMed] [Google Scholar]
- Marjanovic D, Laurin M. 2007. Fossils, molecules, divergence times, and the origin of lissamphibians. Syst Biol 56:369–88. [DOI] [PubMed] [Google Scholar]
- McKnight DA, Fisher LW. 2009. Molecular evolution of dentin phosphoprotein among toothed and toothless animals. BMC Evolut Biol 9:299. [DOI] [PMC free article] [PubMed] [Google Scholar]
- Mendelson JR, Pramuk JB. 1998. Neopalatine odontoids in Bufo alvarius (Anura: Bufonidae). J Herpetol 32:586–8. [Google Scholar]
- Meredith RW, Gatesy J, Cheng J, Springer MS. 2011. Pseudogenization of the tooth gene enamelysin (mmp20) in the common ancestor of extant baleen whales. Proc Biol Sci 278:993–1002. [DOI] [PMC free article] [PubMed] [Google Scholar]
- Meredith RW, Gatesy J, Murphy WJ, Ryder OA, Springer MS. 2009. Molecular decay of the tooth gene enamelin (enam) mirrors the loss of enamel in the fossil record of placental mammals. PLoS Genet 5:e1000634. [DOI] [PMC free article] [PubMed] [Google Scholar]
- Meredith RW, Gatesy J, Springer MS. 2013. Molecular decay of enamel matrix protein genes in turtles and other edentulous amniotes. BMC Evolut Biol 13:20. [DOI] [PMC free article] [PubMed] [Google Scholar]
- Monroy JA, Nishikawa K. 2011. Prey capture in frogs: alternative strategies, biomechanical trade‐offs, and hierarchical decision making. J Exp Zool Part A 315:61–71. [DOI] [PubMed] [Google Scholar]
- Moradian-Oldak J, Iijima M, Bouropoulos N, Wen HB. 2003. Assembly of amelogenin proteolytic products and control of octacalcium phosphate crystal morphology. Connective Tissue Res 44 (Suppl 1):58–64. [PubMed] [Google Scholar]
- Mu Y, Huang X, Liu R, Gai Y, Liang N, Yin D, Shan L, Xu S, Yang G. 2021. ACPT gene is inactivated in mammalian lineages that lack enamel or teeth. PeerJ 9:e10219. [DOI] [PMC free article] [PubMed] [Google Scholar]
- Nishikawa K, Schwenk K. 2001. Ingestion in reptiles and amphibians. eLS (doi: 10.1038/npg.els.0001835). [Google Scholar]
- Nishikawa KC. 1999. Neuromuscular control of prey capture in frogs. Philos Trans Royal Soc London Series B 354:941–54. [DOI] [PMC free article] [PubMed] [Google Scholar]
- Nishikawa KC. 2000. Feeding in frogs. In: Schwenk K, editor. Feeding: form, function and evolution in tetrapod vertebrates. San Diego (CA): Academic Press. p. 117–47. [Google Scholar]
- Nishikawa KC, Gans C. 1996. Mechanisms of tongue protraction and narial closure in the marine toad bufo marinus. J Exp Biol 199:2511–29. [DOI] [PubMed] [Google Scholar]
- Olson MV. 1999. When less is more: gene loss as an engine of evolutionary change. Am J Human Genet 64:18–23. [DOI] [PMC free article] [PubMed] [Google Scholar]
- Paluh DJ, Riddell K, Early CM, Hantak MM, Jongsma GF, Keeffe RM, Silva FM, Nielsen SV, Vallejo-Pareja MC, Stanley EL, Blackburn DC. 2021. Rampant tooth loss across 200 million years of frog evolution. bioRxiv (doi: 10.1101/2021.02.04.429809). [DOI] [PMC free article] [PubMed] [Google Scholar]
- Pauly GB, Hillis DM, Cannatella DC. 2004. The history of a Nearctic colonization: molecular phylogenetics and biogeography of the Nearctic toads (Bufo). Evolution 58:2517–35. [DOI] [PubMed] [Google Scholar]
- Pizzatto L, Somaweera R, Kelhear C, Brown GP. 2012. Rhinella marina (cane toad) diet. Herpetol Rev 43:469–71. [Google Scholar]
- Pramuk JB, Robertson T, Sites JWJr, Noonan BP. 2008. Around the world in 10 million years: biogeography of the nearly cosmopolitan true toads (Anura: Bufonidae). Global Ecol Biogeogr 17:72–83. [Google Scholar]
- Regal PJ, Gans C. 1976. Functional aspects of the evolution of frog tongues. Evolution 30:718–34. [DOI] [PubMed] [Google Scholar]
- Ronquist F, Huelsenbeck JP. 2003. Mrbayes 3: Bayesian phylogenetic inference under mixed models. Bioinformatics (Oxford, England) 19:1572–4. [DOI] [PubMed] [Google Scholar]
- Seidl F, Levis NA, Schell R, Pfennig DW, Pfennig KS, Ehrenreich IM. 2019. Genome of spea multiplicata, a rapidly developing, phenotypically plastic, and desert-adapted spadefoot toad. G3 9:3909–19. [DOI] [PMC free article] [PubMed] [Google Scholar]
- Sharma V, Hecker N, Roscito JG, Foerster L, Langer BE, Hiller M. 2018. A genomics approach reveals insights into the importance of gene losses for mammalian adaptations. Nat Commun 9:1215. [DOI] [PMC free article] [PubMed] [Google Scholar]
- Shen W, Le S, Li Y, Hu F. 2016. Seqkit: a cross-platform and ultrafast toolkit for FASTA/Q file manipulation. PLoS One 11:e0163962. [DOI] [PMC free article] [PubMed] [Google Scholar]
- Silvestro D, Michalak I. 2012. raxmIGUI: a graphical front-end for RAxML. Org Diversity Evol 12:335–7. [Google Scholar]
- Smith CEL, Poulter JA, Antanaviciute A, Kirkham J, Brookes SJ, Inglehearn CF, Mighell AJ. 2017. Amelogenesis imperfecta; genes, proteins, and pathways. Front Physiol 8:435. [DOI] [PMC free article] [PubMed] [Google Scholar]
- Springer MS, Emerling CA, Gatesy J, Randall J, Collin MA, Hecker N, Hiller M, Delsuc F. 2019. Odontogenic ameloblast-associated (ODAM) is inactivated in toothless/enamelless placental mammals and toothed whales. BMC Evol Biol 19:31. [DOI] [PMC free article] [PubMed] [Google Scholar]
- Springer MS, Starrett J, Morin PA, Lanzetti A, Hayashi C, Gatesy J. 2016. Inactivation of c4orf26 in toothless placental mammals. Mol Phylogenet Evol 95:34–45. [DOI] [PubMed] [Google Scholar]
- Sun Y-B, Xiong Z-J, Xiang X-Y, Liu S-P, Zhou W-W, Tu X-L, Zhong L, Wang L, Wu D-D, Zhang B-L, Zhu CL. 2015. Whole-genome sequence of the Tibetan frog Nanorana parkeri and the comparative evolution of tetrapod genomes. Proc Natl Acad Sci U S A 112:E1257–62. [DOI] [PMC free article] [PubMed] [Google Scholar]
- Suyama M, Torrents D, Bork P. 2006. PAL2NAL: robust conversion of protein sequence alignments into the corresponding codon alignments. Nucleic Acids Res 34:W609–12. [DOI] [PMC free article] [PubMed] [Google Scholar]
- Termine JD, Belcourt AB, Christner PJ, Conn KM, Nylen MU. 1980. Properties of dissociatively extracted fetal tooth matrix proteins. I. Principal molecular species in developing bovine enamel. J Biol Chem 255:9760–8. [PubMed] [Google Scholar]
- Toft CA. 1980. Feeding ecology of thirteen syntopic species of anurans in a seasonal tropical environment. Oecologia 45:131–41. [DOI] [PubMed] [Google Scholar]
- Tokita M, Chaeychomsri W, Siruntawineti J. 2013. Developmental basis of toothlessness in turtles: insight into convergent evolution of vertebrate morphology. Evolution 67:260–73. [DOI] [PubMed] [Google Scholar]
- Toyosawa S, O'hUigin C, Figueroa F, Tichy H, Klein J. 1998. Identification and characterization of amelogenin genes in monotremes, reptiles, and amphibians. Proc Natl Acad Sci U S A 95:13056–61. [DOI] [PMC free article] [PubMed] [Google Scholar]
- Wang X, Ito Y, Luan X, Yamane A, Diekwisch TGH. 2005. Amelogenin sequence and enamel biomineralization in Rana pipiens. J Exp Zool Part B 304:177–86. [DOI] [PubMed] [Google Scholar]
- Wiens JJ. 2011. Re‐evolution of lost mandibular teeth in frogs after more than 200 million years, and re‐evaluating Dollo's law. Evolution 65:1283–96. [DOI] [PubMed] [Google Scholar]
- Xia X, Lemey P. 2009. Assessing substitution saturation with dambe. In: Lemey P, Salemi M, Vandamme A, editors. The phylogenetic handbook: a practical approach to phylogenetic analysis and hypothesis testing. Cambridge: Cambridge University Press. [Google Scholar]
- Xia X, Xie Z. 2001. Dambe: software package for data analysis in molecular biology and evolution. J Heredity 92:371–3. [DOI] [PubMed] [Google Scholar]
- Yang Z. 1997. Paml: a program package for phylogenetic analysis by maximum likelihood. Comput Appl Biosci 13:555–6. [DOI] [PubMed] [Google Scholar]
- Yang Z. 1998. Likelihood ratio tests for detecting positive selection and application to primate lysozyme evolution. Mol Biol Evol 15:568–73. [DOI] [PubMed] [Google Scholar]
- Yang Z. 2007. Paml 4: phylogenetic analysis by maximum likelihood. Mol Biol Evol 24:1586–91. [DOI] [PubMed] [Google Scholar]
- Zhang P, Zhou H, Chen YQ, Liu YF, Qu LH. 2005. Mitogenomic perspectives on the origin and phylogeny of living amphibians. Syst Biol 54:391–400. [DOI] [PubMed] [Google Scholar]
- Zug GR, Zug PB. 1979. The marine toad, bufo marinus: a natural history resume of native populations. Smithsonian Contrib Zool 284:1–58. [Google Scholar]
Associated Data
This section collects any data citations, data availability statements, or supplementary materials included in this article.
Supplementary Materials
Data Availability Statement
Data available on request.