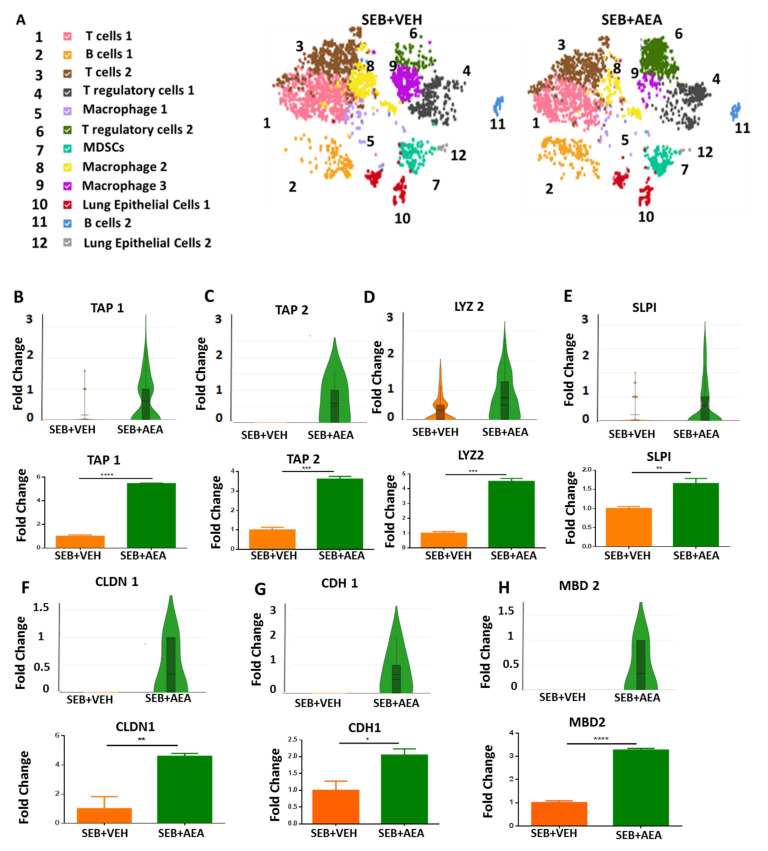
Figure 4.
AEA-mediated induction of AMPs and tight junction proteins during ARDS, analyzed using scRNA-seq of the lungs and RT-qPCR. Mice were treated with SEB and AEA, as described in the Figure 1 legend. (A) Different types of cell clusters in the lungs of SEB + VEH and SEB + AEA mice. The cells were classified based on markers as follows: Panel (A) (1) T cells 1 (CD3+, CD8+, CD44+, Trbc1), (2) B cells 1 (CD19+, CD38, PAX5), (3) T cells 2 (CD3+, Trbc2, CD8+, IFNG, Trbc1), (4) T regulatory cells 1 (CD4+, SATB1+, FOXP3+, MAF+, SELL+, CLTA4+, STAT5B, IKZf2, Lag3, Nt5e), (5) Macrophage 1 (F4/80, Fth, Ftl, CD68), (6) T regulatory cells 2 (CD4+, SATB1, MAF+, SELL+, CLTA4+, STAT5B, IKZf2, CCr4, Gata3), (7) Myeloid Derived Suppressor Cells (MDSCs) (CD11B+, GR1+, ARG1+, LY6C+), (8) Macrophage 2 (F4/80, Fth, Ftl, Siglec F), (9) Macrophage 3 (F4/80), (10) Lung Epithelial cells 1 (TAP1+, TAP2+, SLPI+, Lyz2+, MBD2, LTF, CDH1, CLDN1), (11) B cells 2 (CD19+, PAX5), (12) Lung Epithelial cells 2 (TAP2+, SLPI+, Lyz2+, MBD2, EPCAM+, CDH1). Panels (B–H) represent various molecules studied on epithelial cells from the lungs using scRNA-seq (upper panels) and validated using RT-qPCR (lower panels). Single-cell data were obtained by pooling cells from five mice per group and running 3000 total cells per group. To validate these results, RT-qPCR data were obtained from five mice per group. The vertical bars represent mean ± SEM. The statistical significance was analyzed using a Student’s t-test and indicated as follows: * p ≤ 0.05, ** p ≤ 0.01, *** p ≤ 0.001, **** p ≤ 0.001.

