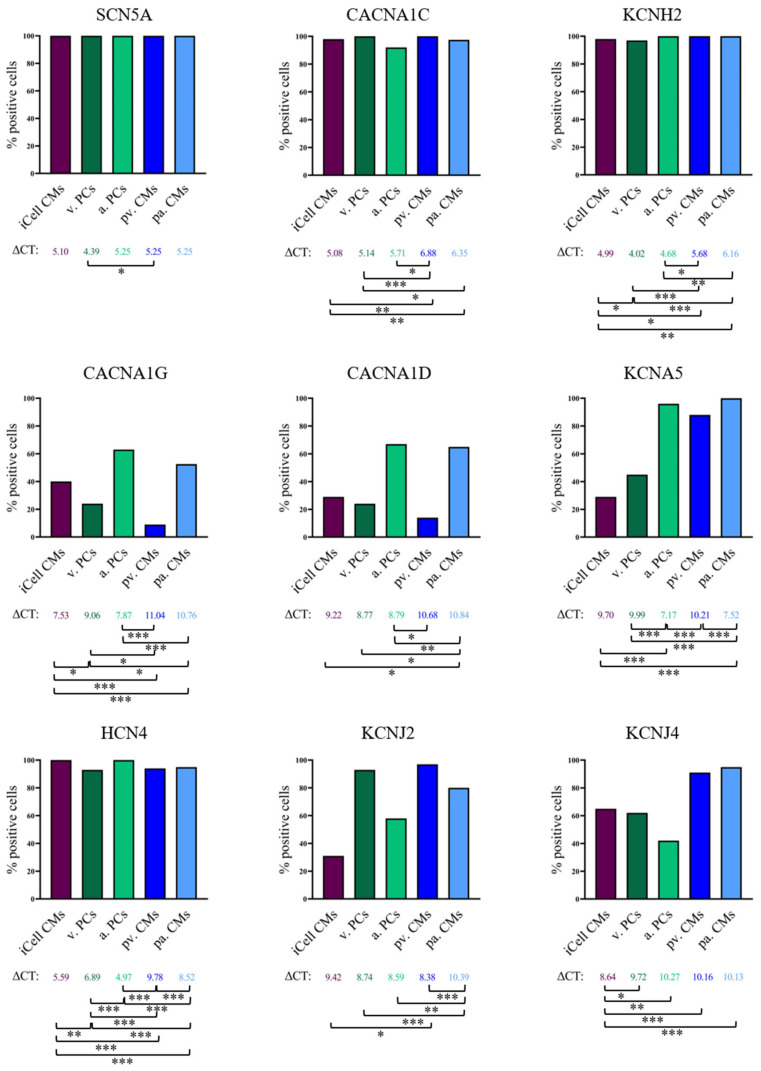
Figure 3.
Comparison of cardiomyocyte groups regarding ion channel expression at the single-cell level. Columns represent percentages of positive cells; values shown below the columns are mean ΔCT values (CT values normalized to the mean expression of TNNT2 and GAPDH of the respective cell group) of the positive cells. Students t-test was used to compare the ΔCT values between the groups. Significant differences of ΔCT values between groups are indicated with * p < 0.05, ** p < 0.01 and *** p < 0.001. The total numbers used to calculate mean ΔCT values are listed in Table 3. Abbreviations: iCell CMs, iCell cardiomyocytes; v. PCs, ventricular Pluricytes; a. PCs, atrial Pluricytes; pv. CMs, primary ventricular cardiomyocytes; pa. CMs, primary atrial cardiomyocytes.

