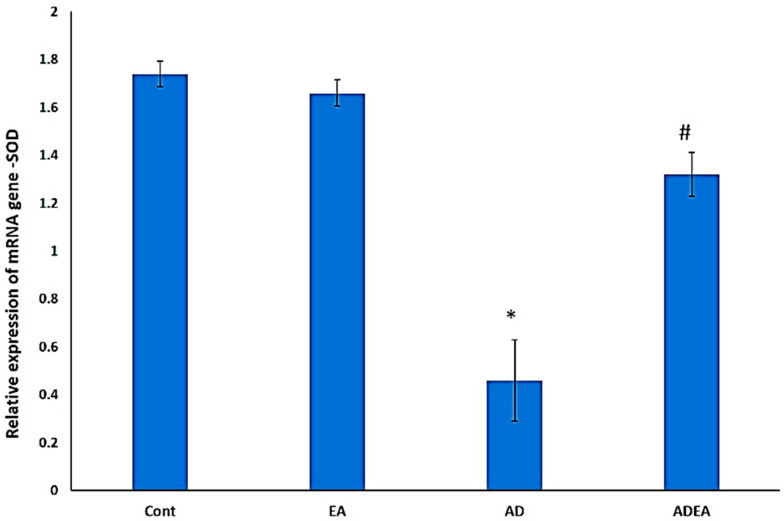
Figure 7.
Bar graph showing the relative expression of SOD mRNA in ERC. One-way ANOVA was used, and Fisher’s LSD t-test was applied when equal variance could be assumed. * Significantly different from the control, EA, and ADEA groups at p ≤ 0.05. # Significantly different from the AD group at p ≤ 0.05.

