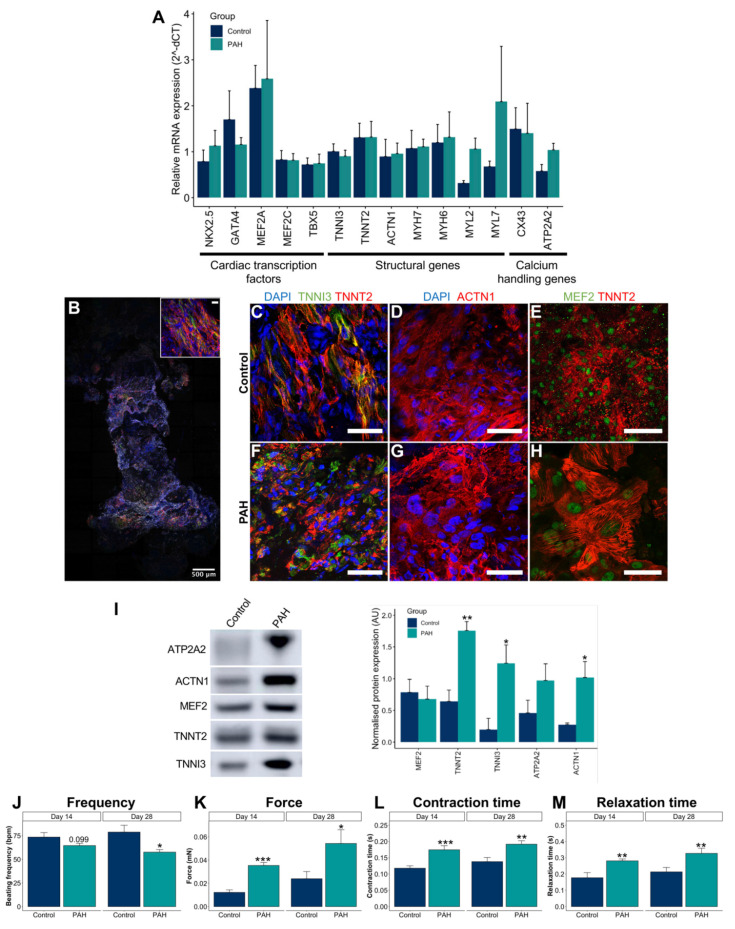
Figure 6.
Control and PAH EHT characterization at the gene, protein, and functional levels. (A) Gene expression of cardiac transcription factors (NKX2.5, TBX5, MEF2A, MEF2C, and GATA4), structural genes (ACTN1, MYH6, MYH7, MYL2, MYL7, TNNI3, and TNNT2), and calcium-handling genes (ATP2A2 and CX43) genes for the control and PAH EHTs (mean + SD, N ≥ 7 control and N ≥ 7 PAH). (B) Representative whole-mount staining of a 3D EHT for TNNI3 (green), TNNT2 (red), and vimentin (grey). Scale bar = 500 µm (and 50 µm in the upper right magnification). (C–H) Representative images to confirm sarcomeric ACTN1 (red), TNNI3 (green), and TNNT2 (red) contractile markers, and MEF2 nuclear expression (green) on the control and PAH EHTs. Scale bars = 50 µm. (I) Representative Western blot bands and protein quantification of ACTN1, MEF2, TNNT2, TNNI3, and ATP2A2 cardiac markers on the control and PAH EHTs (mean + SD, N = 3 control, and N = 6 PAH). (J–M) Beating frequency (bpm), force (mN), contraction time (s), and relaxation time (s) in the control and PAH EHTs under spontaneous beating conditions at baseline (day 14) and at the end of the experiment (day 28) (mean + SD, N = 30 control, and N = 60 PAH). * p < 0.05, ** p < 0.01, *** p < 0.001.

