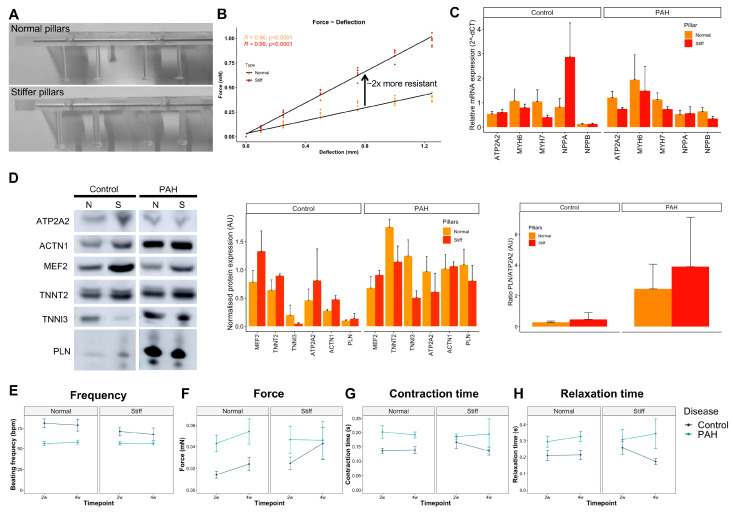
Figure 7.
Increased afterload on control and PAH EHTs. (A) Image of normal and stiffer silicone posts. (B) Elastic characterization of normal and stiffer silicone posts plotting the force measured at different post deflections to calculate their resistance and spring constant (mN/mm). (C) Gene expression of structural and hypertrophic markers (ATP2A2, MYH6, MYH7, NPPA, and NPPB) on the control and PAH EHTs cultured with normal or stiffer silicone posts for 28 days (mean + SD, N ≥ 9 normal and ≥11 stiff control EHTs, and N ≥ 17 normal and ≥11 stiff PAH EHTs). (D) Representative Western blot bands and protein quantification of ACTN1, MEF2, TNNT2, TNNI3, PLN, and ATP2A2 cardiac markers on the control and PAH EHTs cultured with normal or stiffer silicone posts for 28 days (mean + SD, N = 3 normal and 2 stiff control EHTs, and N = 6 normal and 3 stiff PAH EHTs). (E–H) Beating frequency (bpm), force (mN), contraction time (s), and relaxation time (s) in the control and PAH EHTs cultured with normal or stiffer silicone posts under spontaneous beating conditions at 2 and 4 weeks (mean ± SD; N = 23 normal and 17 stiff control EHTs, and N = 17 normal and 8 stiff PAH EHTs).

