Abstract
Objectives
This study aimed to distinguish preoperatively anterior mediastinal thymic cysts from thymic epithelial tumors via a computed tomography (CT)-based radiomics nomogram.
Methods
This study analyzed 74 samples of thymic cysts and 116 samples of thymic epithelial tumors as confirmed by pathology examination that were collected from January 2014 to December 2020. Among the patients, 151 cases (scanned at CT 1) were selected as the training cohort, and 39 cases (scanned at CT 2 and 3) served as the validation cohort. Radiomics features were extracted from pre-contrast CT images. Key features were selected by SelectKBest and least absolute shrinkage and selection operator and then used to build a radiomics signature (Rad-score). The radiomics nomogram developed herein via multivariate logistic regression analysis incorporated clinical factors, conventional CT findings, and Rad-score. Its performance in distinguishing the samples of thymic cysts from those of thymic epithelial tumors was assessed via discrimination, calibration curve, and decision curve analysis (DCA).
Results
The radiomics nomogram, which incorporated 16 radiomics features and 3 conventional CT findings, including lesion edge, lobulation, and CT value, performed better than Rad-score, conventional CT model, and the clinical judgment by radiologists in distinguishing thymic cysts from thymic epithelial tumors. The area under the receiver operating characteristic (ROC) curve of the nomogram was 0.980 [95% confidence interval (CI), 0.963–0.993] in the training cohort and 0.992 (95% CI, 0.969–1.000) in the validation cohort. The calibration curve and the results of DCA indicated that the nomogram has good consistency and valuable clinical utility.
Conclusion
The CT-based radiomics nomogram presented herein may serve as an effective and convenient tool for differentiating thymic cysts from thymic epithelial tumors. Thus, it may aid in clinical decision-making.
Keywords: radiomics, nomogram, computed tomography, thymic epithelial tumor, cyst
Introduction
An increasing number of anterior mediastinal lesions has been incidentally found with the widespread application of computed tomography (CT) screening (1). Thymoma and thymic cysts are the most common lesions of anterior mediastinum (2, 3). Nam et al. (2) found that thymoma and thymic cysts account for 34.2% and 26.7%, respectively, of surgically resected anterior mediastinal lesions. The clinical treatment of thymic cysts and thymoma differs. In general, asymptomatic thymic cysts can be treated without surgical treatment, but early surgical resection is highly recommended if thymoma is definitively identified (4–6). Therefore, the correct preoperative diagnosis of thymic cysts and thymoma is important.
CT is the first choice of preoperative diagnosis of anterior mediastinal masses because of its high-density resolution and convenience for clinical use (7–9). However, discriminating thymic cysts from thymoma is often difficult, and many cysts had been misdiagnosed as thymoma that led to unnecessary surgery (2, 10–13). The primary reason attributed to misdiagnoses of thymoma is that thymic cysts with a high density (>20 Hu) are difficult to distinguish from non-invasive thymoma via unenhanced CT (11, 12). Even by contrast-enhanced CT, some small thymic cysts may be misdiagnosed as thymoma because of pseudo-enhancement, which is caused by their proximity to the aorta, and some non-invasive thymomas with low enhancement may be misdiagnosed as cysts (2, 14). Thus, new diagnostic methods must be developed to improve the performance in distinguishing these two types of lesions.
Radiomics, which extracts large quantitative features from medical images, can be used to evaluate the heterogeneity of lesions objectively and quantitatively, thereby overcoming the limitation of subjective visual image interpretation (15, 16). Radiomics methods are widely applied in the field of medicine to assist in disease diagnosis and prognosis (17, 18). Radiomics methods have been recently utilized in predicting histological subtype classification and staging of thymic epithelial tumors (19–22). However, studies that employ radiomics methods to differentiate thymic cysts from thymic epithelial tumors are limited. Yasaka et al. (23) used radiomics method to differentiate solid mediastinal masses from cysts. However, the number of their quantitative features and their sample size were relatively small, and they did not perform any type of validation. The current study aimed to develop a CT-based radiomics nomogram that incorporates radiomics features, clinical factors, and conventional CT findings to improve the accuracy of preoperative diagnosis of thymic cysts and thymic epithelial tumors.
Materials and Methods
Patients
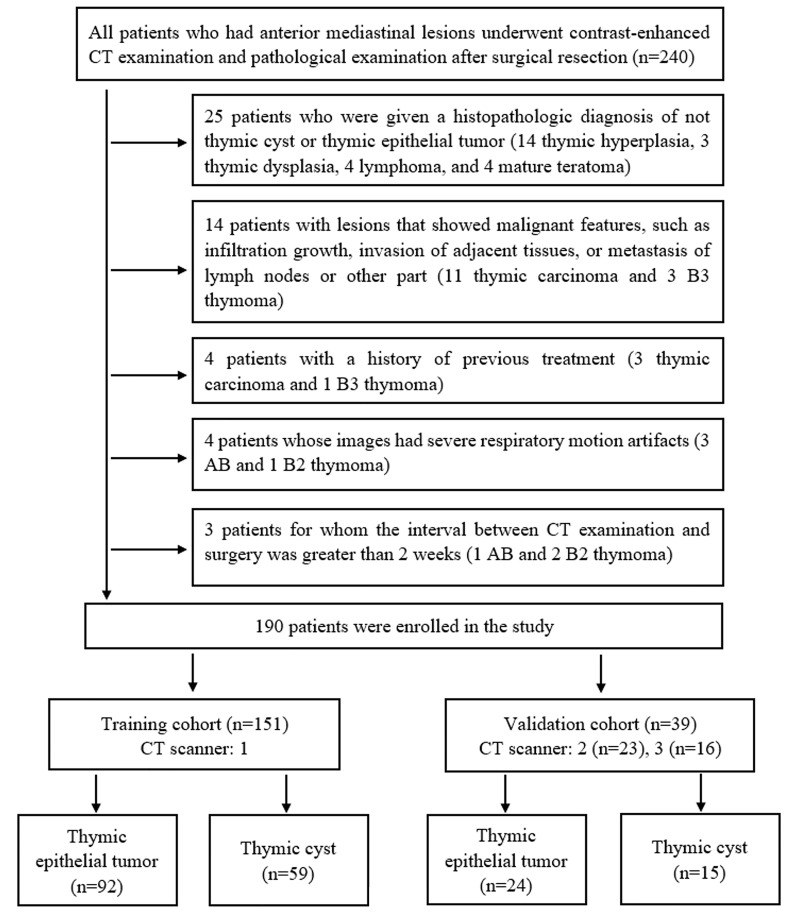
This retrospective study was approved by the Institutional Ethics Committee. From January 2014 to December 2020, 240 patients who had anterior mediastinal lesions underwent contrast-enhanced CT examination and pathological examination after surgical resection at our hospital. The patient inclusion and exclusion criteria are presented in Figure 1 . Ultimately, 190 eligible patients were included in this study. Among these patients, 151 cases (scanned at CT 1) were selected as the training cohort, and 39 cases (scanned at CT 2 and 3) served as the validation cohort.
Figure 1.
Flow chart of patients’ enrolment.
Various clinical factors, including gender, age, and myasthenia gravis, were recorded at baseline.
CT Protocols
The pieces of CT equipment used in this study were Philips iCT 256, GE Light Speed 64, and Philips Brilliance 64. The CT parameters were as follows: voltage was 120 kV, tube current was 120–250 mA, matrix was 512 × 512, layer thickness was 5 mm, reconstruction thickness was 1.25 or 1 mm, lung window width/level was 1,500/550, and mediastinum window width/level was 350/40. Plain and contrast-enhanced CT scans (Ultravist 370 with a dose of 1.5 ml/kg; bolus injection through the antecubital vein using a high-pressure syringe at a rate of 3–3.5 ml/s; three-phase scanning time windows of 30, 60, and 90 s after the injection of the contrast agent) were performed.
Analysis of Conventional CT Findings
The CT images were independently reviewed by two radiologists with over 10 years of experience in thoracic radiology. The radiologists were blinded to the clinical history of the patients or the final histopathology diagnosis. Consensus was reached through discussion.
The conventional CT findings included 1. location (right, left, or midline), which was determined according to the relationship between the lesion and the sternum; 2. size (average size of the maximum long axis, short axis, and coronal height); 3. lesion edge (smooth or rough); 4. shape (round, oval, or plaque)—when the ratio of the dimension of the long axis to the short axis dimension was <1.5, ≥1.5 and <3, and ≥3, it was considered round, oval, and plaque, respectively (24); 5. conformation to the shape of the adjacent mediastinum—the standard was the lesion was abutted to the adjacent mediastinal pleura with no protrusion toward the adjacent lung parenchyma; 6. lobulation (absent or present)—a lobulation margin was defined when the lesion’s surface showed convex contours with adjacent notches between lesion lobules (25); 7. calcification (absent or present); 8. CT value—the region of interest (ROI) was placed in the maximum uniform density area of the lesion on the pre-contrast CT at three different levels, and the average of the three values was calculated as the CT value; and 9. homogeneity—not counting calcification, if the density of the lesion was uniform on the pre-contrast CT, then it was defined as homogeneous; otherwise, it was defined as inhomogeneous.
Interobserver agreement of the conventional CT findings was measured by Kappa statistics and intraclass correlation coefficients (ICCs).
Image Segmentation, Feature Selection, and Radiomics Signature Construction
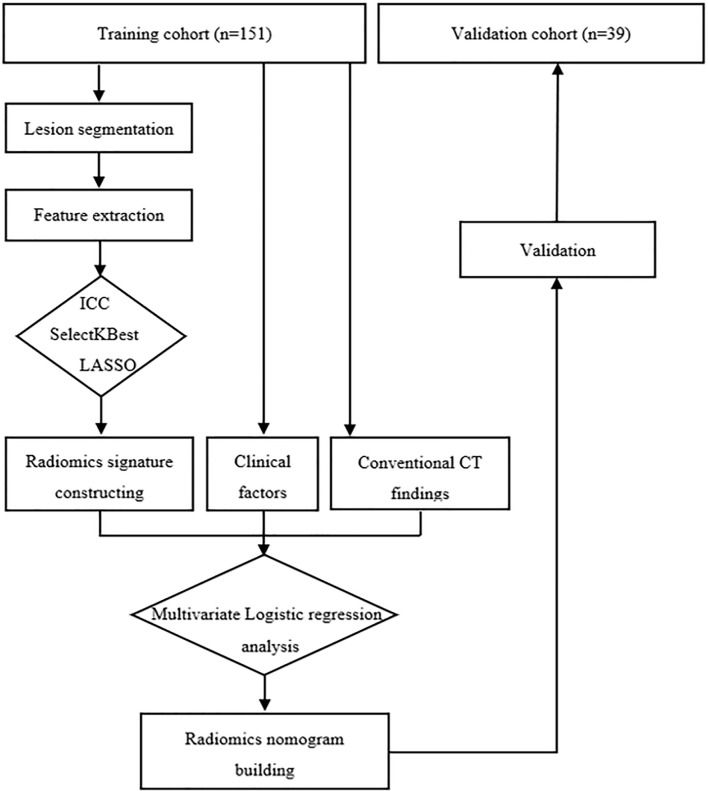
The radiomics workflow is presented in Figure 2 . Lesion segmentation and feature extraction were performed on the RadCloud platform (Huiying Medical Technology Co., Ltd., http://radcloud.cn/). The RadCloud platform used the Pyradiomics v.2.1.2 package (https://pyradiomics.readthedocs.io/en/latest/) for feature extraction following the recommendations of the Image Biomarker Standardization Initiative. The volume of interest was segmented on the basis of transverse axial pre-contrast CT images. The CT images of 40 patients were randomly selected for ROI delineation and feature extraction to ensure intra- and interobserver reproducibility. The ROIs were manually delineated by the two radiologists mentioned above independently. The processes were repeated a month later by a junior radiologist. Agreement on feature extraction in the intra- and interobserver reproducibility was evaluated by ICCs, and features that had ICC values of >0.75 were used for further analysis. The remaining ROIs were completed by the junior radiologist, and all ROIs completed by the junior radiologist were selected for further feature extraction and analysis.
Figure 2.
Radiomics workflow of the study.
The optimal diagnostic-related features were selected by SelectKBest and the least absolute shrinkage and selection operator (LASSO). The radiomics signature (i.e., Rad-score) was computed for each lesion by a linear combination of the selected features as weighted by their respective quotient.
Radiomics Nomogram Building and Validation
The variables of clinical factors, conventional CT findings, and Rad-score between the samples of thymic cysts and epithelial tumors with significant differences were analyzed via multivariate logistic regression to build the radiomics nomogram. The nomogram’s performance was evaluated by plotting receiver operating characteristic curves. The classification accuracy between the predicted probability and the observed results was evaluated by calibration curves. Decision curve analysis (DCA) was performed to evaluate the clinical utility of the nomogram. The boundary was set to 2 and 3 cm, and the stratification performance of the nomogram in the validation cohort was further verified according to the size.
For comparison, the Rad-score and conventional CT model were also built and evaluated. The radiologists’ judgments were also recorded. The same radiologists mentioned above independently reviewed the pre-contrast and contrast-enhanced CT images with clinical information. They reached the final diagnosis by consensus.
Statistical Analysis
Statistical analysis was performed using the R software (version 3.4.1) and the SPSS software (Version 23.0). Quantitative variables are shown as mean ± SD. Categorical variables were assessed by χ2 or Fisher’s exact test, whereas differences in continuous variables were assessed by t-test or Mann–Whitney U test. The area under the receiver operating characteristic (ROC) curves (AUCs) of the nomogram, Rad-score, and conventional CT model were compared via DeLong test. Statistical significance was set at p < 0.05.
Results
Patients’ Characteristics and Conventional CT Findings
A total of 190 patients, namely, 74 patients with pathologically confirmed thymic cysts (4 of which were thymic bronchogenic cysts) and 116 patients with thymic epithelial tumors, were involved in this study. The specific pathological types of the 116 thymic epithelial tumors were as follows: type A (n = 13), type AB (n = 35), type B1 (n = 16), type B2 (n = 33), type B3 (n = 6), and thymic carcinoma (n = 13). The patients’ characteristics and their conventional CT findings are summarized in Table 1 . No significant difference was observed in the ratio of the dimension of the thymic cysts to the thymic epithelial tumors between the training and validation cohorts (p = 0.944).
Table 1.
The patients’ characteristics and conventional CT findings of the two cohorts.
| Characteristics | Training cohort | Validation cohort | ||||
|---|---|---|---|---|---|---|
| Thymic cyst (n = 59) | Thymic epithelial tumor (n = 92) | p | Thymic cyst (n = 15) | Thymic epithelial tumor (n = 24) | p | |
| Gender (%) | ||||||
| Male | 24/59 | 34/92 | 0.646 | 6/15 | 7/24 | 0.508 |
| Female | 35/59 | 58/92 | 9/15 | 17/24 | ||
| Age (year) | 52.75 ± 10.87 | 54.75 ± 11.86 | 0.297 | 55.67 ± 9.27 | 54.46 ± 9.04 | 0.292 |
| Myasthenia gravis (%) | 4/59 | 17/92 | 0.043 | 0/15 | 6/24 | 0.065 |
| Location (%) | ||||||
| Right | 13/59 | 29/92 | 0.026 | 3/15 | 11/24 | 0.106 |
| Left | 18/59 | 39/92 | 5/15 | 9/24 | ||
| Midline | 28/59 | 24/92 | 7/15 | 4/24 | ||
| Size (cm) | 2.73 ± 1.41 | 3.84 ± 1.79 | 0.000 | 2.46 ± 0.68 | 3.41 ± 1.44 | 0.023 |
| Lesion edge (%) | ||||||
| Smooth | 51/59 | 67/92 | 0.048 | 10/15 | 20/24 | 0.266 |
| Rough | 8/59 | 25/92 | 5/15 | 4/24 | ||
| Lesion shape (%) | ||||||
| Round | 26/59 | 38/92 | 0.158 | 4/15 | 10/24 | 0.041 |
| Oval | 25/59 | 49/92 | 7/15 | 14/24 | ||
| Plaque | 8/59 | 5/92 | 4/15 | 0/24 | ||
| Lobulation (%) | 7/59 | 60/92 | 0.000 | 1/15 | 12/24 | 0.006 |
| Conformal to the shape of adjacent mediastinum (%) | 14/59 | 2/92 | 0.000 | 6/15 | 2/24 | 0.037 |
| Calcification (%) | 11/59 | 27/92 | 0.139 | 1/15 | 8/24 | 0.115 |
| Homogeneous (%) | 56/59 | 67/92 | 0.001 | 14/15 | 16/24 | 0.115 |
| CT value (HU) | 28.16 ± 17.64 | 47.25 ± 9.55 | 0.000 | 24.60 ± 17.34 | 46.67 ± 12.87 | 0.000 |
The interobserver agreement of the two radiologists in their analysis of the conventional CT findings was good (κ = 0.774–0.957, ICC = 0.851–0.988).
Radiomics Feature Selection and Radiomics Signature Construction
A total of 1,409 features were extracted using the RadCloud platform, including first-order statistics, shape- and size-based features, texture features, and higher order statistics features.
After assessing intra- and interobserver reproducibility, 1,358 robust features with ICCs >0.75 were retained. After SelectKBest analysis, 605 features were retained, and after LASSO feature selection, 16 features were retained ( Supplementary Figure S1 and Table 2 ). The Rad-scores, which were calculated by the 16 features, were statistically different (p < 0.001) between the samples of thymic cysts and epithelial tumors, and the optimal cutoff value was 0.705.
Table 2.
Least absolute shrinkage and selection operator (LASSO) coefficient profiles of the 16 features.
| Radiomics Features | Coefficients |
|---|---|
| wavelet-LLH_firstorder_Minimum | −0.06640596 |
| wavelet-HLL_glcm_Autocorrelation | 0.087935231 |
| wavelet-LLH_glrlm_RunEntropy | 0.017874634 |
| original_shape_Maximum2DDiameterSlice | 0.009097243 |
| original_shape_Elongation | 0.103026944 |
| wavelet-HHL_glszm_ZoneEntropy | 0.043976985 |
| wavelet-HHL_glcm_Autocorrelation | −0.007486597 |
| wavelet-HHL_gldm_GrayLevelVariance | −0.004601087 |
| wavelet-HHL_firstorder_Entropy | −0.000113446 |
| wavelet-HHL_glszm_GrayLevelVariance | 0.017546166 |
| wavelet-HHL_glszm_GrayLevelNonUniformityNormalized | −1.51E-08 |
| logarithm_firstorder_Range | 0.058735878 |
| exponential_firstorder_Minimum | −0.044695771 |
| square_firstorder_Minimum | −0.034266806 |
| square_firstorder_Kurtosis | −0.034990685 |
| squareroot_firstorder_RobustMeanAbsoluteDeviation | 0.006370002 |
glcm, gray level co-occurrence matrix; glrlm, gray level run length matrix; glszm, gray level size zone matrix; gldm, gray level dependence matrix.
Radiomics Nomogram Building
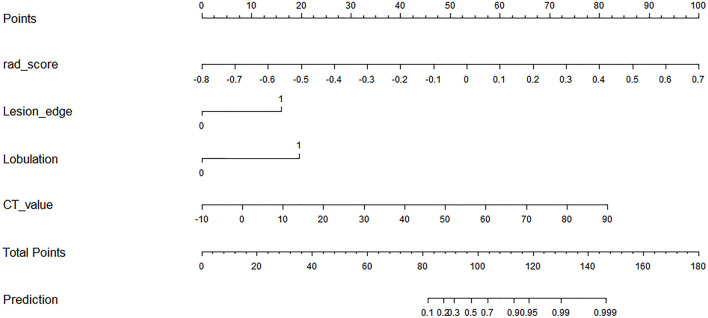
The variables of clinical factors, conventional CT findings, and Rad-score between the samples of thymic cysts and epithelial tumors with significant differences were analyzed via multivariate logistic regression. Among them, three conventional CT findings (including lesion edge, lobulation, and CT value) and the Rad-score were identified as independent predictors for differentiating thymic cysts from thymic epithelial tumors. A radiomics nomogram was constructed using the selected variables to provide a visualized outcome measure ( Figure 3 ).
Figure 3.
Radiomics nomogram with Rad-score and three conventional CT findings, including lesion edge, lobulation, and CT value.
Performance of Conventional CT Model, Rad-Score, and Radiomics Nomogram
The AUCs of conventional CT model, Rad-score, and radiomics nomogram were 0.917, 0.909, and 0.980 in the training cohort, respectively, and 0.868, 0.953, and 0.992 in the validation cohort, respectively. Compared with conventional CT model and Rad-score, the radiomics nomogram had the best performance in the training cohort (p < 0.01). In the validation cohort, the radiomics nomogram performed better than the conventional CT model (p = 0.02), but its performance was not statistically different from that of Rad-score (p = 0.17). The AUC values diagnosed by the radiologists were lower than those in the conventional CT model, Rad-score, and the radiomics nomogram ( Figure 4 ). The radiomics nomogram had a higher accuracy than Rad-score, conventional CT model, and the clinical judgment by the radiologists ( Table 3 ). The diagnostic efficiency of the radiomics nomogram was excellent in the stratification verification according to the size in the validation cohort. The AUCs, sensitivity, specificity, and accuracy were 1.000, 0.800, 1.000, and 0.875 for the group of ≤2 cm, respectively; 1.000, 0.800, 1.000, and 0.933 for the group of 2–3 cm, respectively; and 1.000, 0.929, 1.000, and 0.938 for the group of >3 cm, respectively ( Figure 5 and Table 4 ).
Figure 4.
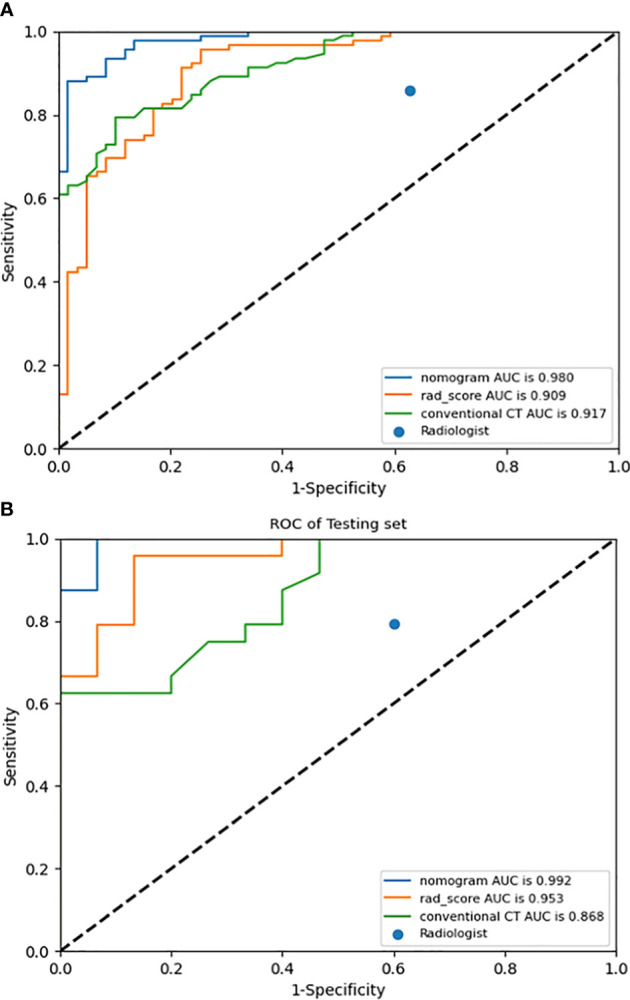
ROC curves of radiomics nomogram, Rad-score, conventional CT model, and judgment by radiologists in the training (A) and validation (B) cohorts.
Table 3.
Predictive performances of radiomics nomogram, Rad-score, conventional CT model, and judgment by radiologists in the training and validation cohorts.
| Model | Training cohort | Validation cohort | ||||||
|---|---|---|---|---|---|---|---|---|
| AUC (95% CI) | Sensitivity (95% CI) | Specificity (95% CI) | Accuracy | AUC (95% CI) | Sensitivity (95% CI) | Specificity (95% CI) | Accuracy | |
| Radiomics nomogram | 0.980 (0.963–0.993) | 0.870 (0.779–0.928) | 0.983 (0.897–0.999) | 0.914 | 0.992 (0.969–1.000) | 0.958 (0.769–0.998) | 0.933 (0.660–0.997) | 0.949 |
| Rad-score | 0.909 (0.864–0.948) | 0.946 (0.872–0.980) | 0.746 (0.613–0.846) | 0.868 | 0.953 (0.893–0.997) | 0.917 (0.715–0.985) | 0.867 (0.584–0.977) | 0.897 |
| Conventional CT | 0.917 (0.882–0.949) | 0.783 (0.682–0.859) | 0.898 (0.785–0.958) | 0.828 | 0.868 (0.759–0.944) | 0.583 (0.369–0.772) | 1.000 (0.747–1.000) | 0.744 |
| Radiologist | NA | 0.859 (0.767–0.920) | 0.373 (0.253–0.509) | 0.669 | NA | 0.792 (0.573–0.921) | 0.400 (0.175–0.671) | 0.641 |
Figure 5.
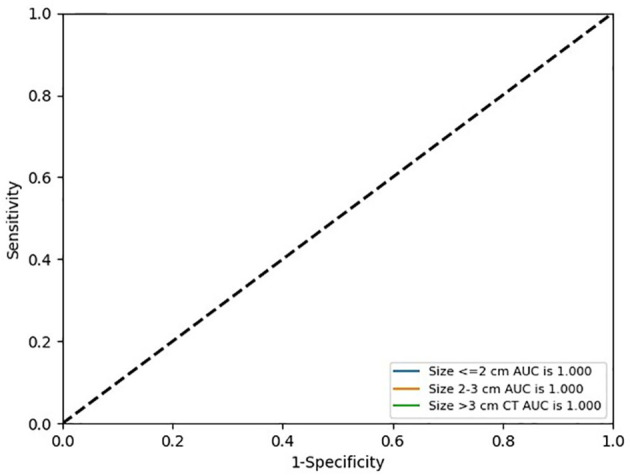
ROC curves of radiomics nomogram in the stratification verification according to the size in the validation cohort.
Table 4.
Predictive performance of radiomics nomogram in the stratification verification according to the size in the validation cohort.
| Size (cm) | Predictive performance | |||
|---|---|---|---|---|
| AUC (95% CI) | Sensitivity (95% CI) | Specificity (95% CI) | Accuracy | |
| ≤2 | 1.000 (1.000–1.000) | 0.800 (0.299–0.989) | 1.000 (0.310–1.000) | 0.875 |
| 2–3 | 1.000 (1.000–1.000) | 0.800 (0.299–0.989) | 1.000 (0.655–1.000) | 0.933 |
| >3 | 1.000 (1.000–1.000) | 0.929 (0.769–0.998) | 1.000 (0.660–0.997) | 0.938 |
The calibration curves demonstrated good diagnostic consistency between the radiomics nomogram’s predictions and the actual observations of the samples of thymic cysts and thymic epithelial tumors ( Figure 6 ). DCA revealed that the radiomics nomogram provided the greatest net benefit compared with “no treatment” or “all treatment” ( Figure 7 ).
Figure 6.
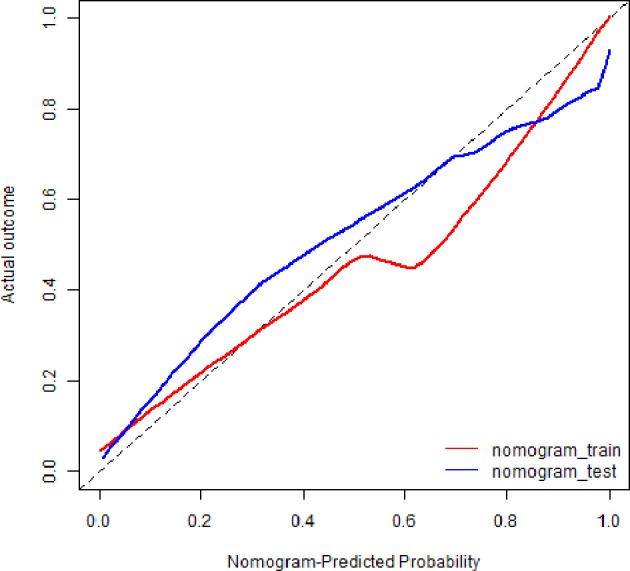
Calibration curves of radiomics nomogram. The diagonal line represented the perfect prediction of the radiomics nomogram. The red and blue solid line represented the calibration curve of nomogram in the training and validation cohorts, separately. The calibration curves were close to the diagonal line, which indicated good prediction performance of the nomogram.
Figure 7.
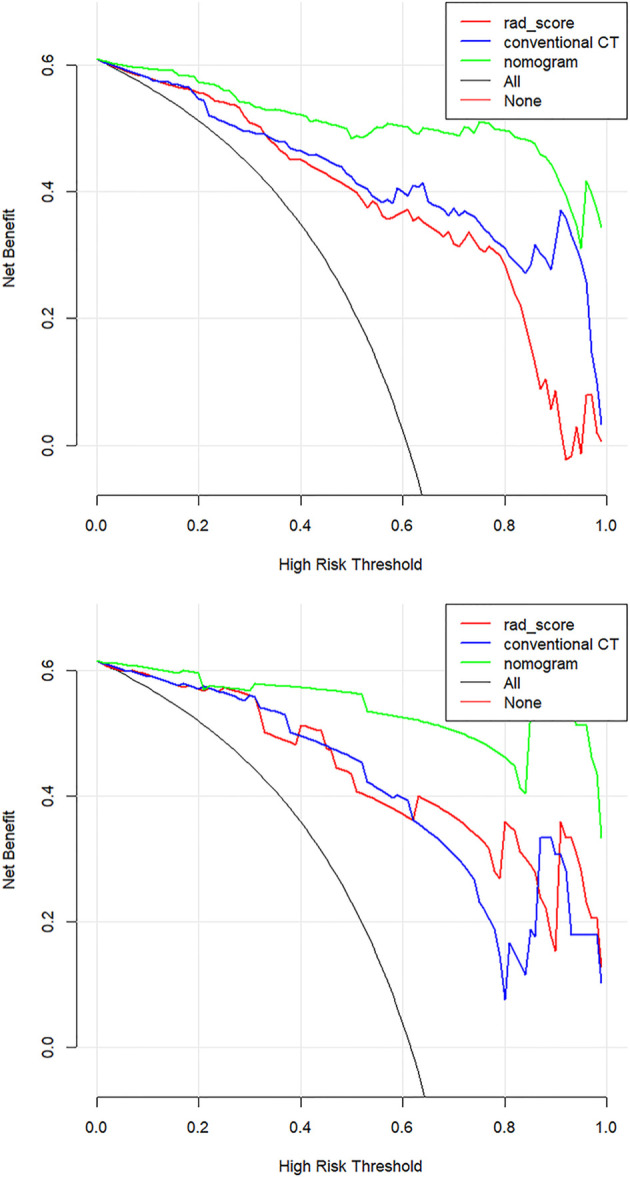
Decision curve analysis (DCA) for the three models. The net benefit versus the threshold probability was plotted. The x-axis represents the threshold probability, while the y-axis represents the net benefits. The sensitivity and specificity of the model are calculated at each threshold to determine the net benefit. The DCAs showed that the net benefits of the nomogram model (green line) were superior to the benefits of the conventional CT model (blue line) and the Rad-score based model (red line) with the threshold probability range from 0 to 1.
Discussion
This study used a CT-based radiomics nomogram to distinguish anterior mediastinal thymic cysts from thymic epithelial tumors. In both the training and validation cohorts, the radiomics nomogram performed better with a larger AUC value and a higher accuracy than Rad-score, conventional CT model, and the clinical judgment of the radiologists. The calibration curves and DCA demonstrated the clinical utility of the radiomics nomogram developed herein.
Thymoma is the most common lesion of the anterior mediastinum, followed by thymic cyst (2, 3). Among the lesions included in this study, 58.8% were thymic epithelial tumors, and 30.8% were thymic cysts. The remaining 25 lesions, including 14 thymic hyperplasia, 3 thymic dysplasia, 4 lymphomas, and 4 mature teratomas, accounted for only 10.4%. Given the high incidence of thymic epithelial tumors and cysts in the anterior mediastinum, their correct preoperative diagnosis is important. Among our case series, all four mature teratomas were found to contain fat density, and they were all correctly diagnosed by CT. Malignant features were found in all four cases of lymphoma, which were easily differentiated from thymic cysts. CT images with a triangular or a quadrilateral shape with a convex, concave, or straight margin may be helpful in diagnosing thymus hyperplasia/thymus degeneration, but they are often misdiagnosed as thymoma and not cysts (26).
CT is widely used in the preoperative diagnosis of thymic cysts and thymic epithelial tumors. The typical CT features of thymic cysts are well-circumscribed anterior mediastinal mass with a homogeneous water attenuation and a thin or imperceptible wall (12, 27). However, CT attenuation increases when hemorrhage or inflammation occurs in the cysts as a complication, which presents as a soft tissue density (27, 28). Partial thymoma, especially non-invasive thymoma, usually shows homogeneous attenuation and has a smooth contour (7, 13, 29). Thus, distinguishing thymic cysts from thymoma is difficult in some cases, especially when dealing with high-density cysts. Xun et al. (11) reported that the CT value of >20 Hu is an independent factor of misdiagnosis of thymic cysts. Previous studies found thymic cysts with CT values of >20 Hu in 62.5%–83% of patients (2, 12, 13). The accuracy of CT in diagnosing anterior mediastinal lesions was 90.1% for thymoma and only 42.3% for thymic cysts. Among the misdiagnosed thymic cysts, 80.5% were misdiagnosed as thymoma (2). Xun et al. (11) correctly diagnosed thymic cysts via CT in 54.6% of the patients only. In the present study, the sensitivity, specificity, and accuracy of the diagnosis of the radiologists were 0.859, 0.373, and 0.669, respectively, for the training cohort and 0.792, 0.400, and 0.641, respectively, for the validation cohort. The specificity and accuracy were low, especially specificity. A probable reason was that many thymic cysts had been misdiagnosed as thymomas as in previous studies. Another possible reason was that the subjects with thymic epithelial tumors that showed malignant features on CT were excluded. Thus, distinguishing thymic cysts from thymic epithelial tumors via CT was more difficult in the present study than in previous works.
Jung et al. (7) used a nomogram based on conventional contrast-enhanced CT findings that included the degree of enhancement (HU) and lobulated contour to differentiate thymic cysts from thymoma. In the training cohort, their nomogram had an AUC of 0.929, sensitivity of 0.824, and specificity of 0.889. In the validation cohort, their nomogram correctly predicted 95% (19/20) of the thymomas. Radiomics methods have recently gained increased attention from radiologists. Yasaka et al. (23) used a radiomics method to differentiate solid mediastinal masses from cysts. Through logistic regression analyses, they found that their nomogram had an AUC of 0.869 for unenhanced CT and 0.997 for contrast-enhanced CT. However, they only selected texture features, their sample size was small, and they lacked any type of validation. In the present study, 1,409 features were extracted, including 1. first-order statistics, such as minimum, entropy, and range, which described the distribution of voxel intensity; 2. shape- and size-based features, such as elongation and maximum 2D diameter slice, which reflected the shape and size of the ROIs; 3. texture features, such as gray level co-occurrence matrix, gray level run length matrix, and gray level size zone matrix, which quantified regional heterogeneity differences; and 4. higher order statistics features, which were obtained by filter transformation of the original image. The filters used in this study were wavelet, logarithm, exponential, square, square root, gradient, and Ibp-2D. After feature selection via SelectKBest and LASSO, 16 features were retained. The majority of the features were found to have originated from digital filtering of the original images plus only two shape features. These results indicated that the higher order statistics features more accurately reflected the image features, making them more valuable for differentiating thymic cysts from thymic epithelial tumors than the other features. The radiomics nomogram that incorporated Rad-score and three conventional CT findings (including lesion edge, lobulation, and CT value) achieved a good diagnostic efficiency. The AUC, sensitivity, specificity, and accuracy of this radiomics nomogram were 0.980, 0.870, 0.983, and 0.914, respectively, for the training cohort and 0.992, 0.958, 0.933, and 0.949, respectively, for the validation cohort. Accurate diagnosis of small thymic nodules is very challenging in clinical settings. On the basis of the characteristics of cases included herein, 2 and 3 cm were set as the boundary, and the stratification performance of the radiomics nomogram was further verified according to the size. Its diagnostic efficiency was excellent in the stratification verification. Its AUC, sensitivity, specificity, and accuracy were 1.000, 0.800, 1.000, and 0.875 for the group of ≤2 cm, respectively; 1.000, 0.800, 1.000, and 0.933 for the groups of 2–3 cm, respectively; and 1.000, 0.929, 1.000, and 0.938 for the group of >3 cm, respectively.
The radiomics nomogram presented herein was developed on the basis of unenhanced CT, which can reduce a patient’s exposure to radiation and risk of allergy to the contrast media compared with multiphasic enhanced CT. Moreover, unenhanced CT is routinely scanned in clinical work. Thus, radiomics features based on unenhanced CT images can be easily obtained. In this study, three CT scanners were used. Thus, another advantage of the radiomics nomogram developed herein was that it performed well in both the training and validation cohorts, indicating that it was robust.
This study has several limitations. First, a selection bias may exist because of the retrospective nature of the study. Second, a multicenter study with more sample size is needed to achieve a more robust external validation. Finally, the ROIs were segmented manually, a process that is vulnerable to subjective factors and is time consuming. Semiautomatic or automatic segmentation methods should be applied in further works.
In conclusion, the CT-based radiomics nomogram developed herein that integrates Rad-score and conventional CT findings may serve as an effective tool for differentiating thymic cysts from thymic epithelial tumors. Thus, it can aid in clinical decision-making. Accordingly, patients can receive a reasonable intervention and treatment.
Data Availability Statement
The raw data supporting the conclusions of this article will be made available by the authors, without undue reservation.
Ethics Statement
The studies involving human participants were reviewed and approved by Yantai Yuhuangding Hospital, Affiliated Hospital of Qingdao University. Written informed consent from the participants’ legal guardian/next of kin was not required to participate in this study in accordance with the national legislation and the institutional requirements.
Author Contributions
PW and NM: study design. CZ and FL: data collection. QY, HM, HZ, and RZ: data processing. CZ and QY: manuscript writing. PW and NM: manuscript revision. All authors contributed to the article and approved the submitted version.
Conflict of Interest
Author RZ was employed by Huiying Medical Technology.
The remaining authors declare that the research was conducted in the absence of any commercial or financial relationships that could be construed as a potential conflict of interest.
Publisher’s Note
All claims expressed in this article are solely those of the authors and do not necessarily represent those of their affiliated organizations, or those of the publisher, the editors and the reviewers. Any product that may be evaluated in this article, or claim that may be made by its manufacturer, is not guaranteed or endorsed by the publisher.
Acknowledgments
We thank Huiying Medical Technology for technical support.
Supplementary Material
The Supplementary Material for this article can be found online at: https://www.frontiersin.org/articles/10.3389/fonc.2021.744021/full#supplementary-material
Least absolute shrinkage and selection operator (LASSO) regression algorithm for identifying features with the best correlation and reproducibility. (A)16 features that correspond to the optimal alpha value were selected (5-fold cross-validation, alpha [the optimal value of the LASSO tuning parameter] = 1.7). (B) Mean squared error (MSE) path (5-fold cross-validation).
References
- 1. Yoon SH, Choi SH, Kang CH, Goo JM. Incidental Anterior Mediastinal Nodular Lesions on Chest CT in Asymptomatic Subjects. J Thorac Oncol (2018) 13(3):359–66. doi: 10.1016/j.jtho.2017.11.124 [DOI] [PubMed] [Google Scholar]
- 2. Nam JG, Goo JM, Park CM, Lee HJ, Lee CH, Yoon SH. Age- and Gender-Specific Disease Distribution and the Diagnostic Accuracy of CT for Resected Anterior Mediastinal Lesions. Thorac Cancer (2019) 10(6):1378–87. doi: 10.1111/1759-7714.13081 [DOI] [PMC free article] [PubMed] [Google Scholar]
- 3. Roden AC, Fang WT, Shen Y, Carter BW, White DB, Jenkins SM, et al. Distribution of Mediastinal Lesions Across Multi-Institutional, International, Radiology Databases. J Thorac Oncol (2020) 15(4):568–79. doi: 10.1016/j.jtho.2019.12.108 [DOI] [PubMed] [Google Scholar]
- 4. Turna A, Sarbay İ. Multimodality Approach in Treatment of Thymic Tumors. J Thorac Dis (2020) 12(12):7626–34. doi: 10.21037/jtd-20-818 [DOI] [PMC free article] [PubMed] [Google Scholar]
- 5. Khorfan R, Bharat A, Odell DD. Management and Long-Term Outcomes of Advanced Stage Thymoma in the United States. Ann Thorac Surg (2021) 111(1):223–30. doi: 10.1016/j.athoracsur.2020.05.088 [DOI] [PMC free article] [PubMed] [Google Scholar]
- 6. Kamata S, Ishida I, Suzuki Y, Oura H. Single-Center Evaluation of Prognostic Factors for Thymoma Treated by Surgery: A Retrospective Study. J Cardiothorac Surg (2021) 16(1):8. doi: 10.1186/s13019-020-01386-7 [DOI] [PMC free article] [PubMed] [Google Scholar]
- 7. Jung W, Cho S, Yum S, Lee YK, Kim K, Jheon S. Differentiating Thymoma From Thymic Cyst in Anterior Mediastinal Abnormalities Smaller Than 3 Cm. J Thorac Dis (2020) 12(4):1357–65. doi: 10.21037/jtd.2020.02.14 [DOI] [PMC free article] [PubMed] [Google Scholar]
- 8. Jin ZG, Wu YJ, Wang YF, Pu ZT, Wang J, Li DS, et al. Multislice Computed Tomography Performance in Differential Diagnosis of High-Density Thymic Cyst and Thymoma in Lesions Less Than 3 Cm. Thorac Cancer (2018) 9(10):1300–04. doi: 10.1111/1759-7714.12840 [DOI] [PMC free article] [PubMed] [Google Scholar]
- 9. Li X, Han XP, Sun W, Wang M, Jing GH, Zhang X. Preoperative Misdiagnosis Analysis and Accurate Distinguish Intrathymic Cyst From Small Thymoma on Computed Tomography. J Thorac Dis (2016) 8(8):2086–92. doi: 10.21037/jtd.2016.07.83 [DOI] [PMC free article] [PubMed] [Google Scholar]
- 10. Tomiyama N, Honda O, Tsubamoto M, Inoue A, Sumikawa H, Kuriyama K, et al. Anterior Mediastinal Tumors: Diagnostic Accuracy of CT and MRI. Eur J Radiol (2009) 69(2):280–8. doi: 10.1016/j.ejrad.2007.10.002 [DOI] [PubMed] [Google Scholar]
- 11. Wang X, Chen K, Li X, Li Y, Yang F, Li J, et al. Clinical Features, Diagnosis and Thoracoscopic Surgical Treatment of Thymic Cysts. J Thorac Dis (2017) 9(12):5203–11. doi: 10.21037/jtd.2017.10.148 [DOI] [PMC free article] [PubMed] [Google Scholar]
- 12. Araki T, Sholl LM, Gerbaudo VH, Hatabu H, Nishino M. Intrathymic Cyst: Clinical and Radiological Features in Surgically Resected Cases. Clin Radiol (2014) 69(7):732–8. doi: 10.1016/j.crad.2014.03.002 [DOI] [PMC free article] [PubMed] [Google Scholar]
- 13. Ackman JB, Verzosa S, Kovach AE, Louissaint A, Jr, Lanuti M, Wright CD, et al. High Rate of Unnecessary Thymectomy and Its Cause. Can Computed Tomography Distinguish Thymoma, Lymphoma, Thymic Hyperplasia, and Thymic Cysts? Eur J Radiol (2015) 84(3):524–33. doi: 10.1016/j.ejrad.2014.11.042 [DOI] [PubMed] [Google Scholar]
- 14. Lee SH, Yoon SH, Nam JG, Kim HJ, Ahn SY, Kim HK, et al. Distinguishing Between Thymic Epithelial Tumors and_Benign Cysts via Computed Tomography. Korean J Radiol (2019) 20(4):671–82. doi: 10.3348/kjr.2018.0400 [DOI] [PMC free article] [PubMed] [Google Scholar]
- 15. Kumar V, Gu Y, Basu S, Berglund A, Eschrich SA, Schabath MB, et al. Radiomics: The Process and the Challenges. Magn Reson Imaging (2012) 30(9):1234–48. doi: 10.1016/j.mri.2012.06.010 [DOI] [PMC free article] [PubMed] [Google Scholar]
- 16. Lambin P, Rios-Velazquez E, Leijenaar R, Carvalho S, van Stiphout RG, Granton P, et al. Radiomics: Extracting More Information From Medical Images Using Advanced Feature Analysis. Eur J Cancer (2012) 48(4):441–6. doi: 10.1016/j.ejca.2011.11.036 [DOI] [PMC free article] [PubMed] [Google Scholar]
- 17. Liu JK, Xu H, Qing HM, Li Y, Yang X, He CJ, et al. Comparison of Radiomic Models Based on Low-Dose and Standard Dose CT for Prediction of Adenocarcinomas and Benign Lesions in Solid Pulmonary Nodules. Front Oncol (2021) 10:634298. doi: 10.3389/fonc.2020.634298 [DOI] [PMC free article] [PubMed] [Google Scholar]
- 18. Yang LF, Yang JB, Zhou XB, Huang LY, Zhao WL, Wang T, et al. Development of a Radiomics Nomogram Based on the 2D and 3D CT Features to Predict the Survival of non-Small Cell Lung Cancer Patients. Eur Radiol (2019) 29(5):2196–206. doi: 10.1007/s00330-018-5770-y [DOI] [PubMed] [Google Scholar]
- 19. Shen QJ, Shan YN, Xu W, Hu GZ, Chen WH, Feng Z, et al. Risk Stratification of Thymic Epithelial Tumors by Using a Nomogram Combined With Radiomic Features and TNM Staging. Eur Radiol (2021) 31(1):423–35. doi: 10.1007/s00330-020-07100-4 [DOI] [PubMed] [Google Scholar]
- 20. Xiao G, Rong WC, Hu YC, Shi ZQ, Yang Y, Ren JL, et al. MRI Radiomics Analysis for Predicting the Pathologic Classification and TNM Staging of Thymic Epithelial Tumors: A Pilot Study. AJR Am J Roentgenol (2020) 214(2):328–40. doi: 10.2214/AJR.19.21696 [DOI] [PubMed] [Google Scholar]
- 21. Liu J, Yin P, Wang SC, Liu T, Sun C, Hong N. CT-Based Radiomics Signatures for Predicting the Risk Categorization of Thymic Epithelial Tumors. Front Oncol (2021) 11:628534. doi: 10.3389/fonc.2021.628534 [DOI] [PMC free article] [PubMed] [Google Scholar]
- 22. Hu JP, Zhao YJ, Li MC, Liu Y, Wang F, Weng Q, et al. Machine-Learning-Based Computed Tomography Radiomic Analysis for Histologic Subtype Classification of Thymic Epithelial Tumours. Eur J Radiol (2020) 126:108929. doi: 10.1016/j.ejrad.2020.108929 [DOI] [PubMed] [Google Scholar]
- 23. Yasaka K, Akai H, Abe O, Ohtomo K, Kiryu S. Quantitative Computed Tomography Texture Analyses for Anterior Mediastinal Masses: Differentiation Between Solid Masses and Cysts. Eur J Radiol (2018) 100:85–91. doi: 10.1016/j.ejrad.2018.01.017 [DOI] [PubMed] [Google Scholar]
- 24. Jeong YJ, Lee KS, Kim J, Shim YM, Han J, Kwon OJ. Does CT of Thymic Epithelial Tumors Enable Us to Differentiate Histologic Subtypes and Predict Prognosis? AJR Am J Roentgenol (2004) 183(2):283–9. doi: 10.2214/ajr.183.2.1830283 [DOI] [PubMed] [Google Scholar]
- 25. Marom EM, Rosado-de-Christenson ML, Bruzzi JF, Hara M, Sonett JR, Ketai L. Standard Report Terms for Chest Computed Tomography Reports of Anterior Mediastinal Masses Suspicious for Thymoma. J Thorac Oncol (2011) 7 Suppl 3):S1717–23. doi: 10.1097/JTO.0b013e31821e8cd6 [DOI] [PubMed] [Google Scholar]
- 26. Priola AM, Priola SM, Gned D, Giraudo MT, Fornari A, Veltri A. Comparison of CT and Chemical-Shift MRI for Differentiating Thymoma From non-Thymomatous Conditions in Myasthenia Gravis: Value of Qualitative and Quantitative Assessment. Clin Radiol (2016) 71(3):e157–69. doi: 10.1016/j.crad.2015.12.009 [DOI] [PubMed] [Google Scholar]
- 27. Jeung MY, Gasser B, Gangi A, Bogorin A, Charneau D, Wihlm JM, et al. Imaging of Cystic Masses of the Mediastinum. Radiographics (2002) 22 Spec No:S79–93. doi: 10.1148/radiographics.22.suppl_1.g02oc09s79 [DOI] [PubMed] [Google Scholar]
- 28. Choi YW, McAdams HP, Jeon SC, Hong EK, Kim YH, Im JG, et al. Idiopathic Multilocular Thymic Cyst: CT Features With Clinical and Histopathologic Correlation. AJR Am J Roentgenol (2001) 177(4):881–5. doi: 10.2214/ajr.177.4.1770881 [DOI] [PubMed] [Google Scholar]
- 29. Tomiyama N, Müller NL, Ellis SJ, Cleverley JR, Okumura M, Miyoshi S, et al. Invasive and Noninvasive Thymoma: Distinctive CT Features. J Comput Assist Tomogr (2001) 25(3):388–93. doi: 10.1097/00004728-200105000-00010 [DOI] [PubMed] [Google Scholar]
Associated Data
This section collects any data citations, data availability statements, or supplementary materials included in this article.
Supplementary Materials
Least absolute shrinkage and selection operator (LASSO) regression algorithm for identifying features with the best correlation and reproducibility. (A)16 features that correspond to the optimal alpha value were selected (5-fold cross-validation, alpha [the optimal value of the LASSO tuning parameter] = 1.7). (B) Mean squared error (MSE) path (5-fold cross-validation).
Data Availability Statement
The raw data supporting the conclusions of this article will be made available by the authors, without undue reservation.


