

Abstract
In this opinion, the antimicrobial‐resistant bacteria responsible for transmissible diseases that constitute a threat to the health of pigs have been assessed. The assessment has been performed following a methodology based on information collected by an extensive literature review and expert judgement. Details of the methodology used for this assessment are explained in a separate opinion. A global state of play of antimicrobial resistant Escherichia coli, Streptococcus suis, Actinobacillus pleuropneumoniae, Pasteurella multocida, Glaeserella parasuis, Bordetella bronchiseptica, Staphylococcus aureus, Staphylococcus hyicus, Brachyspira hyodysenteriae, Trueperella pyogenes, Erysipelothrix rhusiopathiae, Streptococcus dysgalactiae, Mycoplasma hyosynoviae, Mycoplasma hyorhinis, Mycoplasma hyopneumoniae and Brachyspira pilosicoli has been provided. Among those bacteria, EFSA identified E. coli and B. hyodysenteriae with > 66% certainty as being the most relevant antimicrobial resistant bacteria in the EU based on the available evidence. The animal health impact of these most relevant bacteria, as well as their eligibility for being listed and categorised within the animal health law framework will be assessed in separate scientific opinions.
Keywords: antimicrobial resistance, animal health law, extensive literature review, swine, pig
1. Introduction
EFSA received a mandate from the European Commission to investigate the global state of play as regards resistant animal pathogens that cause transmissible animal diseases (Term of Reference (ToR) 1), to identify the most relevant bacteria in the EU (first part of ToR 2), to summarise the actual or potential animal health impact of those most relevant bacteria in the EU (second part of ToR 2) and to perform the assessment of those bacteria to be listed and categorised according to the criteria in Article 5, Appendix D according to Articles 9, and 8 within the Regulation (EU) 2016/429 on transmissible animal diseases (‘Animal Health Law’)1 (ToR 3).
This scientific opinion presents the global state of play for resistant animal pathogens that cause transmissible animal diseases (ToR 1) and the results of the assessment of the most relevant bacteria in the EU (first part of ToR 2) for swine following the methodology described in EFSA AHAW Panel (2021).
1.1. Background and terms of reference as provided by the requestor
The background and ToR as provided by the European Commission for the present document are reported in Sections 1.1 and 1.2 of the scientific opinion on the ad hoc method to be followed for the assessment of animal diseases caused by bacteria resistant to antimicrobials within the Animal Health Law (AHL) framework (EFSA AHAW Panel, 2021).
1.2. Interpretation of the terms of reference
The interpretation of the ToR is as in Sections 1.3.1 and 1.3.2 of the scientific opinion on the ad hoc method to be followed for the assessment of animal diseases caused by bacteria resistant to antimicrobials within the AHL framework (EFSA AHAW Panel, 2021).
The present document reports the results of the assessment of bacterial pathogens resistant to antimicrobials in swine.
2. Data and methodologies
The methodology applied for this opinion is described in a dedicated document that details the ad hoc method for the assessment of animal diseases caused by bacteria resistant to antimicrobials within the AHL framework (EFSA AHAW Panel, 2021). Additional methods specific to this opinion (data collection by an extensive literature review) are detailed below.
2.1. Extensive literature review
The process to identify the bacterial species to focus on in the extensive literature review (ELR) is described in Section 2.1.2 in the ad hoc method for the assessment of animal diseases caused by bacteria resistant to antimicrobials within the AHL (EFSA AHAW Panel, 2021). According to that methodology, the following target bacterial pathogens for swine had been agreed upon by the EFSA working group: Actinobacillus pleuropneumoniae, Mycoplasma hyorhinis, Bordetella bronchiseptica, Mycoplasma hyosynoviae, Brachyspira hyodysenteriae, Pasteurella multocida, Brachyspira pilosicoli, Staphylococcus aureus, Erysipelothrix rhusiopathiae, Staphylococcus hyicus, Escherichia coli, Streptococcus dysgalactiae, Glaesserella (Haemophilus) parasuis, Streptococcus suis, Mycoplasma hyopneumoniae and Trueperella pyogenes. The extensive literature review was carried out by the University of Copenhagen under the contract OC/EFSA/ALPHA/2020/02 – LOT 1.2 On 8 December 2020, two different search strings (Appendix A) were applied in PubMed and Embase, respectively, resulting in a search result of 1,675 unique abstracts published since 2010. Upon importation into Rayyan software, these abstracts were screened by a senior scientist who followed the criteria described in the protocol for inclusion and exclusion of studies. When available, the full text of articles was downloaded into EndNote software. In addition, the national antimicrobial resistance (AMR) monitoring reports from Denmark, Finland, France, Germany, Sweden and United Kingdom were downloaded. Only the latest version of the surveillance reports was included in the extensive literature review as isolates included in these reports can be assumed to originate from the same sampled populations and most recent versions would therefore include the most up‐to‐date AMR data. The previous versions of the national AMR surveillance reports, i.e. up to the previous 5 years, were not included in the extensive literature review but were downloaded and analysed separately to assess changes over time when possible. AMR data in the full texts of national reports were evaluated for eligibility applying the exclusion criteria as described in the ad hoc method followed for the assessment of animal diseases caused by bacteria resistant to antimicrobials within the AHL framework (EFSA AHAW Panel, 2021), with the following changes of the standard methodology:
Exclusion criterion 8: The minimum number of isolates in a study to be considered acceptable was set at 50 for E. coli and at 10 for the other bacterial species.
Information extracted from the eligible assessed full‐text reports/publications is described in the scientific opinion describing the ad hoc method applied in the assessment (EFSA AHAW Panel, 2021). Information on all the full‐text studies that were assessed, including the reason for exclusion for those that were excluded at the full‐text screening, is presented in Appendix B. AMR was assessed for clinically relevant antimicrobials according to the method detailed in Section 2.1.3 of the ad hoc method for the assessment of animal diseases caused by bacteria resistant to antimicrobials within the AHL (EFSA AHAW Panel, 2021). The list of clinically relevant antibiotics for each target bacterial species in swine considered in this opinion is shown in Appendix C. When more than one antimicrobial from a given class was considered eligible for inclusion in the report, the following order of preference for each antimicrobial class and bacterial pathogen was considered:
For methicillin in staphylococci, data for oxacillin, cefoxitin and presence of the mecA gene were accepted. If data for more than one of these antimicrobials were available in the same study, we included the one for which more isolates were tested. If the same number of isolates was tested for the different antimicrobials, the order of preference was mecA > cefoxitin > oxacillin.
For third‐generation cephalosporins (3GC) in Enterobacteriaceae (as indicator of extended‐spectrum beta‐lactamase (ESBL)/AmpC), the order of preference was cefpodoxime > cefotaxime > ceftazidime > ceftriaxone > ceftiofur. If data for more than one of these antimicrobials were available in the same study, we included the one for which more isolates were tested. If resistance to at least one of these five 3GCs was not reported, we included instead – when available – other phenotypic data indicating the presence of ESBL/AmpC, typically data from a double disk synergy test (EUCAST, 2017).
For fluoroquinolone, the order of preference was enrofloxacin > ciprofloxacin, meaning we always selected enrofloxacin if resistance data for both drugs were available.
For tetracycline, the order of preference was tetracycline > oxytetracycline > doxycycline > chlortetracycline.
For penicillin/aminopenicillin resistance in A. pleuropneumoniae, the order of preference was ampicillin > amoxicillin > penicillin.
For each study, when clinical breakpoints (CBP) were used, AMR data were extracted as percentages of resistant isolates (%R) and/or as percentages of non‐susceptible isolates by combining resistant and intermediate (I) isolates (%R + I). For some drugs (e.g. sulfonamide‐trimethoprim in E. coli), there is no I category; therefore, only %R was reported. Similarly, when the presence of genes (e.g. mecA in staphylococci) was used as an indication of resistance, the proportion of isolates carrying the gene was reported as the %R. Moreover, the following decisions were made when evaluating data sets:
When no information on the I category was provided in a study, we considered that the reported %R only considered resistant isolates (i.e. I isolates had not been included in the R category).
When the percentage of susceptible isolates (%S) was reported with no information on I, it was not possible to calculate %R. Instead, we calculated %R + I as 100% – %S.
When %I was reported separately, we extracted that along with %R and calculated R + I (see Appendix B).
When epidemiological cut‐offs (ECOFFs) were used, the proportions of non‐wild‐type isolates were reported as %R + I as the I category is always part of the non‐wild‐type population.
3. Assessment
3.1. ToR 1: global state of play for resistant bacterial animal pathogens that cause transmissible animal diseases
3.1.1. General overview of studies included and excluded
3.1.1.1. Data from the extensive literature review
After screening 1,675 abstracts, 180 publications (plus six national AMR surveillance reports) were selected for full‐text evaluation as they were considered eligible according to the criteria described above and in the ad hoc method for the assessment of animal diseases caused by bacteria resistant to antimicrobials within the AHL (EFSA AHAW Panel, 2021). Of these, 109 (60%) publications were excluded due to one or more of the exclusion criteria listed in Section 2.1.4 of the ad hoc method for the assessment of animal diseases caused by bacteria resistant to antimicrobials within the AHL (EFSA AHAW Panel, 2021). The most common reason for exclusion was that MIC data were reported without interpretation (i.e. no CBP applied) (26 studies), the second most common reason for exclusion (13 studies) was that a full‐text version of the study was not available from the server/library at the University of Copenhagen and the third reason was that AMR data from clinical and non‐clinical isolates were reported together (nine studies) (Table 1).
Table 1.
Main reasons for exclusion of studies after full‐text evaluation affecting more than one study (a study could be excluded for more than one reason)a
| Reason | Code in Appendix B | Number of studies |
|---|---|---|
| Minimum inhibitory concentration data reported without interpretation | 12 | 26 |
| Full text not available at server of the University of Copenhagen | 10 | 13 |
| Inclusion of non‐clinical isolates that cannot be distinguished from clinical isolates | 5 | 9 |
| Study does not follow a standard for antimicrobial susceptibility testing or a standard is not reported | 4 | 8 |
| Fewer than the minimum number of isolates are included in the study | 8 | 8 |
| Percentage of resistant isolates not reported | 7 | 7 |
| AMR data from multiple host species (other than pigs) reported together | 2 | 5 |
| AMR assessed genotypically (except mecA used to infer methicillin resistance in staphylococci) | 16 | 5 |
| Study investigating AMR in a subset of resistant clinical isolates | 17b | 4 |
| Same animals sampled repeatedly | 6 | 3 |
| AMR data reported at bacterial genus level or above | 3 | 2 |
| AMR data included in another included study | 9 | 2 |
| Language (non‐English) | 11 | 2 |
| All isolates originating from the same farm | 15 | 2 |
After the exclusion of these references, 71 studies and the six national reports from Denmark, Finland, France, Germany, Sweden and United Kingdom were found to be eligible and were subsequently used to extract the data of interest. No studies on AMR in five bacterial species of interest (S. dysgalactiae, the three selected Mycoplasma species and B. pilosicoli) were found, and there were more than 10 studies for only four pathogens (E. coli, S. suis, A. pleuropneumoniae and P. multocida) (Table 2).
Table 2.
Number of eligible studies from which AMR data were extracted, by target bacteria species
| Bacteria species | Number of eligible studies for data extraction (n = 77)* |
|---|---|
| Escherichia coli | 34 |
| Streptococcus suis | 20 |
| Actinobacillus pleuropneumoniae | 17 |
| Pasteurella multocida | 16 |
| Glaesserella (Haemophilus) parasuis | 8 |
| Bordetella bronchiseptica | 6 |
| Staphylococcus aureus/S. hyicus | 3 |
| Brachyspira hyodysenteriae | 3 |
| Trueperella (Arcanobacterium) pyogenes | 1 |
| Erysipelothrix rhusiopathiae | 1 |
| Streptococcus dysgalactiae | 0 |
| Mycoplasma hyosynoviae | 0 |
| Mycoplasma hyorhinis | 0 |
| Mycoplasma hyopneumoniae | 0 |
| Brachyspira pilosicoli | 0 |
One study could provide information on one or more bacterial species.
Figure 1 provides an overview of the 77 studies included (some with data on more than one bacterial species) sorted by year of publication.
Figure 1.
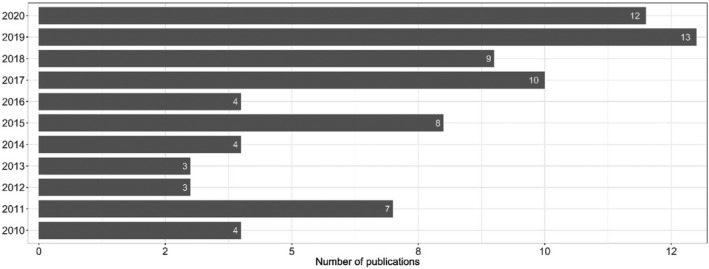
Year of publication of the 77 studies included in the extensive literature review
Considering geographical distribution, included studies originated from 28 countries. Most of the studies that reported AMR data from swine pathogens were performed in Asia (32 studies) followed by Europe (29 studies), whereas six, five, four and one studies reported AMR data from North America, South America, Oceania and Africa, respectively (Figure 2). The most represented country was China (17 studies including isolates from this country) followed by South Korea (nine studies) and Spain (eight studies).
Figure 2.
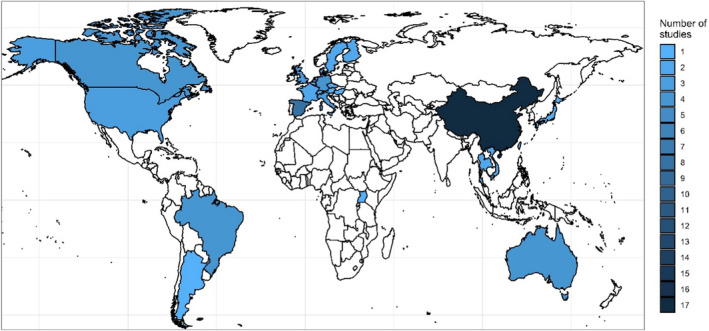
Geographical distribution of the 77 studies included
Based on the type of isolates analysed in the study, references included were divided into those based on the assessment of isolates from: (i) a clearly defined population of pigs in clinics, farms or similar; (ii) those with isolates from a diagnostic laboratory without any background or information provided from the patients; and (iii) those based on isolates retrieved from samples collected at the slaughterhouse (from clinically affected pigs). Overall, 35 studies were based on samples actively collected at farms, 33 were based on isolates from diagnostic laboratories, two were based on slaughterhouse sampling and in one case was of mixed origin (farm and diagnostic laboratory). In the remaining six studies, no information on the origin of isolates was available (other than they were from pigs).
3.1.1.2. Data from national AMR surveillance reports
Additional details/data on one or more of the pathogens of interest of this opinion that are provided in previous versions of the five national AMR surveillance reports (up to the previous 5 years), namely FINRES‐Vet – Finland, SWEDRES‐Svarm – Sweden, DANMAP – Denmark, RESAPATH – France and UK‐VARRS – United Kingdom, were also extracted and are presented in the following section (see Table 3).
Table 3.
AST methodology, bacterial species, host species, number of isolates and temporal coverage of the information on pathogens of interest from swine provided in the six national AMR surveillance reports (up to the last 5 years) reviewed in this opinion
| Programme | Finres‐vet | Danmap | Germ‐vet | Resapath | Swedres‐svarm | UK‐varss |
|---|---|---|---|---|---|---|
| Country | Finland | Denmark | Germany | France | Sweden | United Kingdom |
| Laboratory method | Broth microdilution | Broth microdilution | Broth microdilution | Disk diffusion | Broth microdilution | Disk diffusion |
| AST interpretation | ECOFFs/CBPs | CBPs | CBPs | ECOFFsa | ECOFFs | CBPs10 |
| E. coli | Yes | Yes | Yes | Yes | Yes | Yes |
| Origin (number of isolates) | Enteritis cases 47–88/year | Enteritis/oedema disease 53–282/year | Enteritis 225–297/year | All pathologies 1161–1870/year | Faecal/gastrointestinal tract 52–118/year | Not specified 159–441/year (England) |
| Years covered | 2016–2019 | 2015–2019 | 2014–2018 | 2014–2018 | 2014–2018 | 2015–2019 |
| A. pleuropneumoniae | Yes | Yes | Yes | Yes | Yes | Yes |
| Origin (number of isolates) | Respiratory disease 15–35/year | Not specified 70–135/year | Respiratory disease 101 | All pathologies 108–191/year | Lung 16–57/year | Respiratory disease 8–22/year |
| Years covered | 2016–2019 | 2015–2019 | 2014 | 2014–2018 | 2011–2018 | 2015–2019 |
| S. suis | No | Yes | Yes | Yes | No | Yes |
| Origin (number of isolates) | Not specified 43–152/year | Different pathologies 82–166/year | All pathologies 280–582/year | Not specified 63–115/year | ||
| Years covered | 2015–2019 | 2014–2018 | 2015–2019 | |||
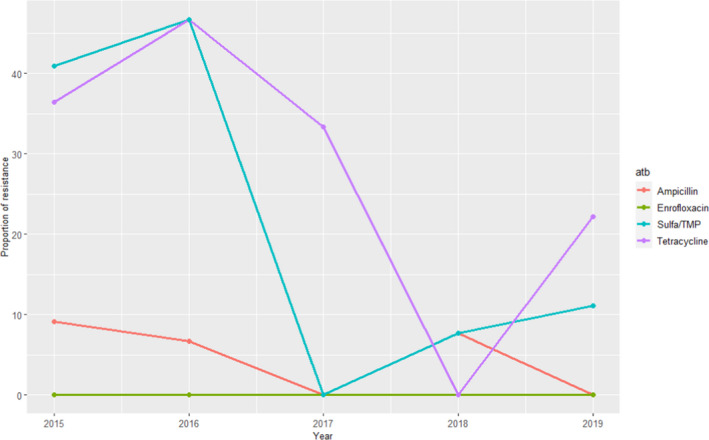
| P. multocida | No | No | Yes | Yes | No | Yes |
| Origin (number of isolates) | Respiratory disease (145) | All pathologies 113–170/year | Not specified 11–40/year | |||
| Years covered | 2015 | 2014–2018 | 2015–2019 | |||
| B. hyodysenteriae | No | No | No | No | Yes | No |
| Origin (number of isolates) | Faecal samples 31 | |||||
| Years covered | 2016–2018 | |||||
| E. rhusiopathiae | No | No | No | No | No | Yes |
| Origin (number of isolates) | Not specified 44 | |||||
| Years covered | 2015–2019 |
Veterinary guidelines of the Antibiogram Committee of the French Society of Microbiology (CA‐SFM).
Human breakpoints recommended by the British Society for Antimicrobial Chemotherapy when available and a uniform cut‐off point of 13 mm when not.
3.1.2. AMR frequency data
The figures and tables in the following pathogen‐specific sections summarise AMR frequency data reported for swine.
The AMR frequency data are extremely difficult to compare, as study design, study populations, methods, interpretive criteria, etc., vary considerably between studies. The number of antimicrobial susceptible testing (AST) results for any given antimicrobial extracted from the selected references (total of 158,737; Appendix B) varied widely between bacterial species, with E. coli accounting for over two‐thirds of all results (107,796/158,737, 67.9%) and over 10,000 AST results for only three other species (S. suis, 19,480; A. pleuropneumoniae, 13,073; and P. multocida, 11,333) that altogether made up 95.6% of the whole AST data set. For the remaining bacteria, there were over 1,000 AST results for G. parasuis (3,583) and B. bronchiseptica (1,150). Laboratory methods used to determine the resistance phenotype of the bacterial strains were based primarily on broth microdilution (approximately two‐thirds of all AST results) followed by disk diffusion techniques (~ 50,000 AST results) or either a mixture or unclear in the remaining. The main approach for interpreting the AST results was based on clinical breakpoints (CBPs) (mentioned as the standard for interpretation for 141,433 tests, 89.1%) followed by EUCAST ECOFFs (3,576). In the remaining cases, the actual breakpoint is not clearly stated.
Furthermore, the definition of AMR differed across studies, as the intermediate category defined by CBPs was included in the calculation of AMR frequencies in some studies, whereas it was omitted in others. So, in the figures with resistance data, we have illustrated for each study whether %R or %RI was reported; therefore, this should be taken into account when comparing studies. It is also important to mention that relatively few infection‐specific and host‐specific CBPs exist for porcine pathogens. This complicates the interpretation of data, as for several studies, it was unclear if the CBPs used were adapted from other bacterial or animal species, from humans or even ‘self‐invented’. Also, it was not always clear if the CBPs were specific for the relevant organ or body site. Adding to this point is that the most common pathogen reported here, E. coli, is mainly an intestinal pathogen. There are no CBP for intestinal infections; therefore, the clinical impact of AST results for any intestinal infection is unknown. Taken together, the outcomes of the present report should be interpreted and cited with caution, as all specificities of individual studies cannot be taken into consideration. To support conclusions made from the figures or tables (e.g. a high proportion of resistance in a certain country/continent), it is strongly recommended that individual publications are consulted and checked to determine if results may be biased by previous antimicrobial treatment, sampling of animals in a certain environment, the use of certain diagnostic methods or breakpoints or other factors.
Regarding data included in the national AMR surveillance reports, assessment of changes in AMR over time in the pathogens under evaluation is hampered in certain cases by the lack of consistent reporting over the years (i.e. only data from specific years were reported) and/or because data on isolates retrieved over several years were presented together. Furthermore, between‐country comparisons must be performed carefully as different methodologies were applied to obtain the results presented in each report, and results provided here are those from the reports (e.g. without accounting for the use of different breakpoints). A comparison of the methodology, bacterial pathogens, number of isolates and temporal coverage of the information provided in the last five reports of each monitoring programme is provided in Table 3. In most of the countries, AST was conducted at a central laboratory that received samples/isolates; a notable exception is the RESAPATH project that includes data generated in field diagnostic laboratories which may test different antibiotics for a same bacterial species; thus, total numbers of reported AST results for a same bacterial species may vary depending on the antimicrobial. The SWEDRES‐Svarm reports include, in addition to AST data determined in clinical E. coli and B. hyodysenteriae isolates, MIC results for B. pilosicoli. However, as no clinical breakpoints or ECOFFs are defined for this pathogen, only data from the other two bacteria are reported where appropriate.
3.1.3. Escherichia coli
3.1.3.1. Results of the ELR by bacterium
Escherichia coli is a commensal and an opportunistic pathogen residing in the intestinal microbiota of animals and humans. It can cause a variety of infections, but in pigs, it is most known for causing gastrointestinal infection. Although this can occur in all age groups, most commonly it occurs during the transition from milk to a more solid diet in which enterotoxigenic E. coli strains (ETEC) are involved in post‐weaning diarrhoea.
In total, 34 studies with ≥ 50 E. coli isolates and results for one or more of the relevant antibiotics (ampicillin/amoxicillin, amoxicillin–clavulanic acid, apramycin, colistin, enrofloxacin/ciprofloxacin, gentamicin, neomycin, paromomycin, spectinomycin, sulfonamide–trimethoprim, sulfonamides, tetracyclines, thiamphenicol, 3GCs) were included. Those studies were distributed as follows: Africa (1), Asia (13), Europe (14), Oceania (2), North America (2) and South America (2).
The distribution of E. coli isolates per site of infection is shown in Figure 3. For studies in which the origin was specified, the vast majority of isolates originated from gastrointestinal infections. This category also covers oedema disease, which is a toxaemia with systemic clinical manifestations caused by the Shiga toxin ST2e produced by E. coli from the gastrointestinal tract.
Figure 3.
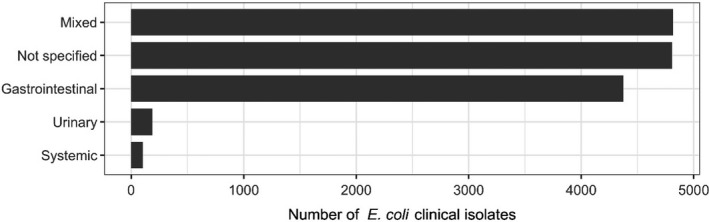
Distribution of E. coli isolates per site of infection
Figure 4 shows for each continent the proportion of resistance reported in individual studies with at least 50 E. coli isolates. Information on proportion of resistance sorted by country is in Appendix D.
Figure 4.
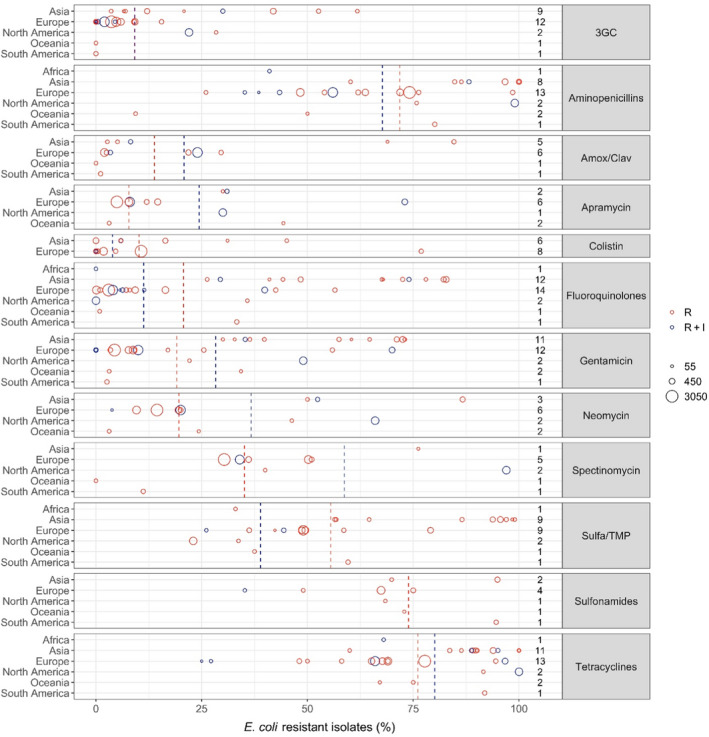
- Each circle represents one study, and the size of each circle reflects how many isolates were included in the study. The colour of the circle illustrates resistance only (red circle) or resistance merged with intermediate (blue circle). The dashed lines indicate, for each antibiotic, the weighted arithmetic mean of %R (red dashed line) or %R+I (blue dashed line). The exact percentages these lines represent are listed in Appendix E. Numbers written to the left of the antibiotic names reflect the number of studies for a certain drug/continent combination.
Overall, resistance levels varied considerably, both within and between countries and continents (Figure 4, Table 4, Appendix D). This is likely to be due to several factors including the diverse nature of E. coli infections and age groups assessed. For the age, it could be suspected that piglets have a lower burden of resistance compared with older pigs that are more likely to have been exposed to antibiotics during their lifetime. Conversely, piglets are exposed to, for example, faecal material from sows, so resistance may also be inherited from early age (Callens et al., 2015; Burow et al., 2019). Another potential bias is that, for several of the included studies, data originated from a selected subset of E. coli isolates, e.g. F4‐positive isolates or haemolytic isolates (Appendix B). The reason for this is that, e.g. haemolytic isolates are more likely to be ETEC than non‐haemolytic isolates (Weber et al., 2017); therefore, some diagnostic laboratories would perform AST only on haemolytic isolates. This limitation should be kept in mind when analysing data for E. coli. Importantly, studies investigating AMR in even more specific subsets of E. coli (e.g. in certain serotypes or multilocus sequence types) were excluded, as these were considered too biased for comparison.
Table 4.
Weighted arithmetic mean, minimum and maximum proportion of resistance (%R or %R + I) and weighted standard deviation (SD) in E. coli for the target antimicrobials in each continent included in the studies. NA means that SD cannot be calculated as only one study is included
| Antibiotic | Continent | No. of papers | N (number of isolates) | Weighted arithmetic mean proportion of resistance (%) | Minimum resistance % observed | Maximum resistance % observed | Weighted standard deviation |
|---|---|---|---|---|---|---|---|
| 3GC | Asia | 9 | 1,542 | 29.8 | 3.6 | 61.8 | 18.5 |
| 3GC | Europe | 12 | 8,842 | 4.2 | 0 | 15.5 | 2.8 |
| 3GC | N. America | 2 | 1,050 | 22.6 | 22 | 28.4 | 1.8 |
| 3GC | Oceania | 1 | 114 | 0 | 0 | 0 | NA |
| 3GC | S. America | 1 | 186 | 0 | 0 | 0 | NA |
| Aminopenicillins | Africa | 1 | 100 | 41 | 41 | 41 | NA |
| Aminopenicillins | Asia | 8 | 1,751 | 93 | 60.2 | 100 | 10.2 |
| Aminopenicillins | Europe | 13 | 8,554 | 63.9 | 26 | 98.5 | 12.7 |
| Aminopenicillins | N. America | 2 | 1,050 | 96.9 | 75.8 | 99 | 6.7 |
| Aminopenicillins | Oceania | 2 | 184 | 24.8 | 9.4 | 50 | 19.8 |
| Aminopenicillins | S. America | 1 | 186 | 80.1 | 80.1 | 80.1 | NA |
| Amox/Clav | Asia | 5 | 633 | 33.1 | 2.7 | 84.6 | 36.3 |
| Amox/Clav | Europe | 6 | 3,786 | 15.7 | 2 | 29.6 | 10.7 |
| Amox/Clav | Oceania | 1 | 114 | 0 | 0 | 0 | NA |
| Amox/Clav | S. America | 1 | 186 | 1.1 | 1.1 | 1.1 | NA |
| Apramycin | Asia | 2 | 240 | 30.7 | 30 | 31 | 0.5 |
| Apramycin | Europe | 6 | 6,915 | 11.5 | 5 | 73 | 16.3 |
| Apramycin | N. America | 1 | 955 | 30 | 30 | 30 | NA |
| Apramycin | Oceania | 2 | 184 | 18.8 | 3.1 | 44.3 | 20 |
| Colistin | Asia | 6 | 1,213 | 10.9 | 0 | 45.1 | 13.3 |
| Colistin | Europe | 8 | 5,150 | 9.7 | 0 | 76.9 | 13.8 |
| Fluoroquinolones | Africa | 1 | 100 | 0 | 0 | 0 | NA |
| Fluoroquinolones | Asia | 12 | 2,134 | 64.4 | 26.3 | 82.8 | 19.8 |
| Fluoroquinolones | Europe | 14 | 8,934 | 8.5 | 0.1 | 56.5 | 12.3 |
| Fluoroquinolones | N. America | 2 | 1,050 | 3.2 | 0 | 35.8 | 10.3 |
| Fluoroquinolones | Oceania | 1 | 114 | 0.9 | 0.9 | 0.9 | NA |
| Fluoroquinolones | S. America | 1 | 186 | 33.3 | 33.3 | 33.3 | NA |
| Gentamicin | Asia | 11 | 1,736 | 58.6 | 30 | 73 | 16.2 |
| Gentamicin | Europe | 12 | 8,216 | 11.7 | 0 | 70 | 16.2 |
| Gentamicin | N. America | 2 | 1,050 | 46.6 | 22.1 | 49 | 7.7 |
| Gentamicin | Oceania | 2 | 184 | 15 | 3.1 | 34.3 | 15.2 |
| Gentamicin | S. America | 1 | 186 | 2.6 | 2.6 | 2.6 | NA |
| Neomycin | Asia | 3 | 603 | 69.8 | 50 | 86.7 | 17.7 |
| Neomycin | Europe | 6 | 6,654 | 15.7 | 3.8 | 20 | 3.8 |
| Neomycin | N. America | 2 | 1,050 | 64.2 | 46.3 | 66 | 5.7 |
| Neomycin | Oceania | 2 | 184 | 11.2 | 3.1 | 24.3 | 10.3 |
| Spectinomycin | Asia | 1 | 61 | 76.2 | 76.2 | 76.2 | NA |
| Spectinomycin | Europe | 5 | 6,262 | 35.7 | 30.3 | 51 | 7.7 |
| Spectinomycin | N. America | 2 | 1,050 | 91.8 | 40 | 97 | 16.4 |
| Spectinomycin | Oceania | 1 | 114 | 0 | 0 | 0 | NA |
| Spectinomycin | S. America | 1 | 186 | 11.2 | 11.2 | 11.2 | NA |
| Sulfa/TMP | Africa | 1 | 100 | 33 | 33 | 33 | NA |
| Sulfa/TMP | Asia | 9 | 1,664 | 85.9 | 56.5 | 99 | 15.7 |
| Sulfa/TMP | Europe | 9 | 4,309 | 51.1 | 26.1 | 79.1 | 10.7 |
| Sulfa/TMP | N. America | 2 | 1,050 | 24 | 23 | 33.7 | 3.1 |
| Sulfa/TMP | Oceania | 1 | 114 | 37.5 | 37.5 | 37.5 | NA |
| Sulfa/TMP | S. America | 1 | 186 | 59.6 | 59.6 | 59.6 | NA |
| Sulfonamides | Asia | 2 | 428 | 88.3 | 69.9 | 94.9 | 11 |
| Sulfonamides | Europe | 4 | 1,495 | 65.4 | 35.2 | 75 | 9.7 |
| Sulfonamides | N. America | 1 | 95 | 68.4 | 68.4 | 68.4 | NA |
| Sulfonamides | Oceania | 1 | 70 | 72.9 | 72.9 | 72.9 | NA |
| Sulfonamides | S. America | 1 | 186 | 94.6 | 94.6 | 94.6 | NA |
| Tetracyclines | Africa | 1 | 100 | 68 | 68 | 68 | NA |
| Tetracyclines | Asia | 11 | 2,081 | 89.6 | 60 | 100 | 7.8 |
| Tetracyclines | Europe | 13 | 8,503 | 71.5 | 25 | 96.7 | 11.4 |
| Tetracyclines | N. America | 2 | 1,050 | 99.2 | 91.6 | 100 | 2.4 |
| Tetracyclines | Oceania | 2 | 184 | 72 | 67.1 | 75 | 3.8 |
| Tetracyclines | S. America | 1 | 186 | 91.9 | 91.9 | 91.9 | NA |
Considering 3GCs, the overall weighted average levels of resistance were 9.1% (R + I) and 9.2% (R). By far the highest average levels of resistance to this drug class were observed in Asia (29.8%, Table 4), whereas the average reported for European isolates was only 4.2%. Despite this tendency, the opposite was also observed, e.g. only 3.6% of 117 isolates from extra‐intestinal infections in pigs in China were resistant to cefotaxime, and 54.3% of 81 isolates from unspecified infections in pigs in Northern Ireland were resistant to cefpodoxime. One study (Li et al., 2018) had tested susceptibility to ceftiofur and interpreted data using human CLSI breakpoints. This practice is doubtful, as veterinary drugs such as ceftiofur are not listed in human guidelines. The remaining five studies reporting data for ceftiofur referred to at least one veterinary guideline document. Worthy of note, the only studies representing South America (Spindola et al., 2018) and Oceania (Abraham et al., 2015) did not find any isolates resistant to 3GCs.
Average levels of resistance to sulfonamides, aminopenicillins and tetracycline were very high (~ 70%, Figure 4), therefore indicating that in many countries these relatively old antibiotic classes may have limited efficacy against porcine E. coli infections. For aminopenicillins and tetracyclines, particularly high levels of resistance were found in North America and Asia. One study from the USA (Malik et al., 2011) found 99% of 955 isolates from 2004 to be ampicillin resistant. This was the culmination of an increasing trend over 9 years. The authors speculated that increasing resistance to ceftiofur may be due to the use of cefquinome and, if this was the case, such use would have co‐selected for resistance to ampicillin. Interestingly, the addition of a beta‐lactamase inhibitor appears effective, as resistance to amoxicillin–clavulanic acid was much less frequent than to aminopenicillins alone (Figure 4).
Although the overall average level of resistance to fluoroquinolones was low compared with other drugs, a substantial difference between continents was evident. In fact, the seven highest proportions reported were from Asia (Figure 4), which had an overall average of 64.5%. In contrast, the average level for 14 studies in Europe was only 7.9% even though clinical breakpoints were used in most studies in both continents (all from Asia and 12/14 from Europe).
The overall average level of resistance to colistin was relatively low (Figure 4), but some exceptions existed including a Spanish study reporting 77% of 186 E. coli as resistant to this drug (Garcia‐Menino et al., 2021). All of these isolates had a variant of the mcr gene, which is a globally spread plasmid‐borne gene of high public health interest due to the critical importance of colistin in human medicine.
Resistance to aminoglycosides can be assessed from four of the drugs assessed, namely apramycin, gentamicin, neomycin and spectinomycin. For the most commonly tested of these, gentamicin, resistance varied considerably between continents. Generally, the highest levels were observed in Asia with levels ranging from 30 to 73% among the 11 Asian studies reporting this drug. One study from Italy also reported a high level of resistance (70%) (Luppi et al., 2015). The reason for such a high percentage compared with other European studies is not clear, but it cannot be ruled out that results of this study differed from other studies due to a biased collection with only F4‐positive E. coli isolates. Also, as noted by the authors, the study's generally high resistance levels may, to some extent, be explained by the fact that all intermediate isolates were classified as resistant.
3.1.3.2. Results from the national AMR surveillance reports
FINRES‐Vet (Finland)
Escherichia coli isolates included in the reports are recovered from faeces or post‐mortem samples from pig enteritis. AST results from 47 to 88 isolates confirmed by polymerase chain reaction (PCR) as enterotoxigenic and tested yearly during the 2016–2019 period are provided, although several isolates can originate from the same farm (for instance 50 isolates retrieved from 27 farms retrieved were included in the 2019 report). Furthermore, as at least part of the isolates are originating from farms with diarrhoeal problems a higher than average antimicrobial usage at these farms is suspected, and therefore, isolates may not be representative of the whole Finnish pig enteritis E. coli population. Levels of resistance (as determined using ECOFFs) to 10 antimicrobials of interest of this opinion are provided, with no isolates resistant to colistin or gentamicin detected throughout the 4 years. The proportion of resistance for the remaining antimicrobials is provided in Figure 5. Resistance to ampicillin, sulfamethoxazole, tetracycline and sulfonamides/trimethoprim combinations was more common (> 25% of all isolates tested being resistant), while the proportion of isolates resistant to fluoroquinolones was less (17–27% for ciprofloxacin and 11–15% for enrofloxacin, a difference that could be explained by the different ECOFF for each antimicrobial, > 0.06 mg/L and > 0.12 mg/L, respectively) (Figure 5). Several isolates resistant to one of the 3GC included in the panel were detected in each year, often originating from the same farms.
Figure 5.
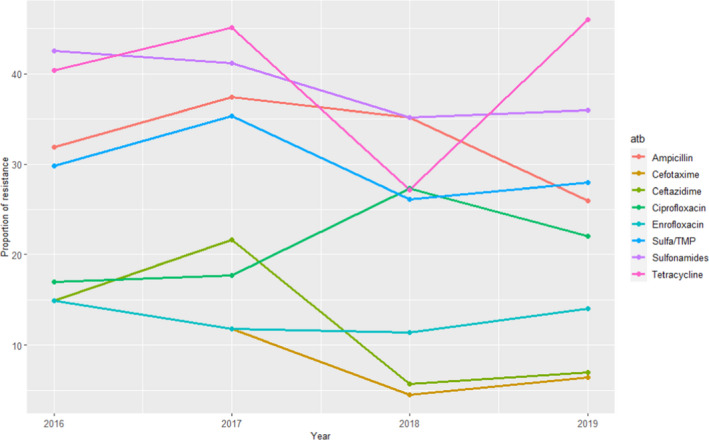
Proportion (%) of clinical swine E. coli isolates retrieved from pig enteritis cases resistant to eight antimicrobials of interest reported by the FINRES‐Vet monitoring programme
When comparing these results with the weighted arithmetic means provided for E. coli isolates retrieved in Europe (Table 4), resistance levels reported in the FINRES‐Vet reports are similar (3GCs, particularly considering the last years), lower (aminopenicillins, colistin, sulfonamides, sulfonamides/trimethoprim, tetracycline) or higher (fluoroquinolones, although these differences can be due in part to the use of ECOFFs if, for example, CLSI CBP were used for interpretation of enrofloxacin data, all isolates would be considered clinically susceptible).
DANMAP (Danmark)
The ETEC isolates for which AST results are provided were defined based on their serotype (O149) in 2015–2017 and on their haemolytic nature, and therefore, resistance levels in these two periods cannot be readily compared. Isolates were typically retrieved from cases of porcine enteritis or oedema disease. Resistance to 10–12 antimicrobials of interest for this opinion from between 53 and 282 isolates tested annually are provided, with higher levels of resistance (> 40%) found consistently throughout the 5 years for ampicillin, spectinomycin, sulfonamide and tetracycline (Figure 6). Resistance levels to gentamicin neomycin and apramycin ranged between 2 and 20% (with higher values registered in the last 3 years), while resistance to 3GCs (ceftiofur and cefotaxime, tested simultaneously or alternatively depending on the year) and ciprofloxacin ranged between 0 and 4% and 0–1%, respectively, and no colistin‐resistant isolates were found (data not shown). Resistance to amoxicillin‐clavulanic acid, tested in 2015 and 2018–2019, ranged between 2% and 4% (data not shown).
Figure 6.
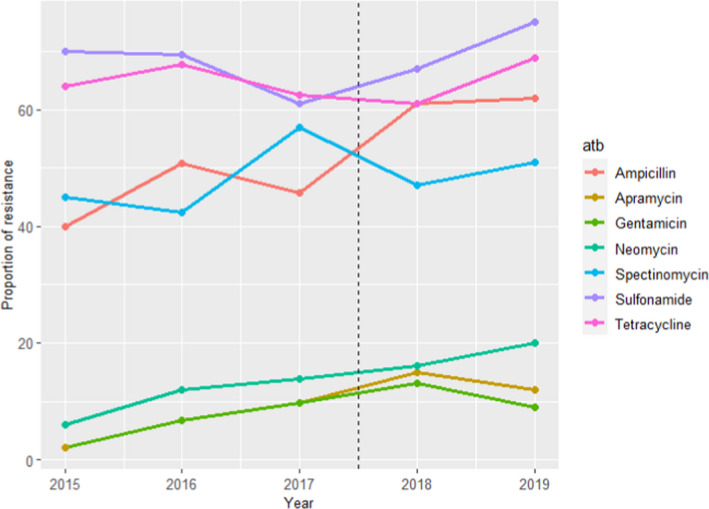
Proportion (%) of clinical swine ETEC E. coli isolates retrieved mostly from pig enteritis and oedema disease cases resistant to seven antimicrobials of interest reported by the DANMAP monitoring programme. Vertical dotted line separates the years in which only information from O149 isolates were included (2015–2017) from those in which all haemolytic isolates were typed (2018–2019)
Relatively similar resistance levels compared with the weighted arithmetic means provided in Table 4 for studies in Europe (i.e. within one weighted SD) were found for aminopenicillins, tetracyclines, sulfonamides apramycin, neomycin, gentamicin, colistin and 3GC, while somewhat higher values in the DANMAP data set were found for spectinomycin and lower values were reported for amoxicillin–clavulanic acid (the years it was tested).
RESAPATH (France)
For E. coli, data on AMR for up to 12 antimicrobials of interest were included during the period under evaluation, although results for two of them (ceftazidime and sulfonamides) were only reported for 1 year (2014 and 2015, respectively) and for a small number of isolates (167–181) while the remaining antimicrobials were tested in over 1,150 isolates each (range: 1,161–1,870). Additionally, separate data for certain pathologies/age groups (digestive pathology in piglets and weaners, kidney and urinary tract pathologies for sows) are also provided, but at lower numbers and are not discussed here. For the antimicrobials tested at all years over the 2014–2018 period, the proportion of resistance was consistently greater than (or close to) 50% for tetracyclines, amoxicillin and sulfonamides/trimethoprim, between 30% and 40% for spectinomycin, between 15% and 25% for amoxicillin–clavulanic acid and neomycin, and less than (or close to) 15% for gentamicin, apramycin, enrofloxacin and ceftiofur (with the last two less than 5% in the last 2 years) (Figure 7).
Figure 7.
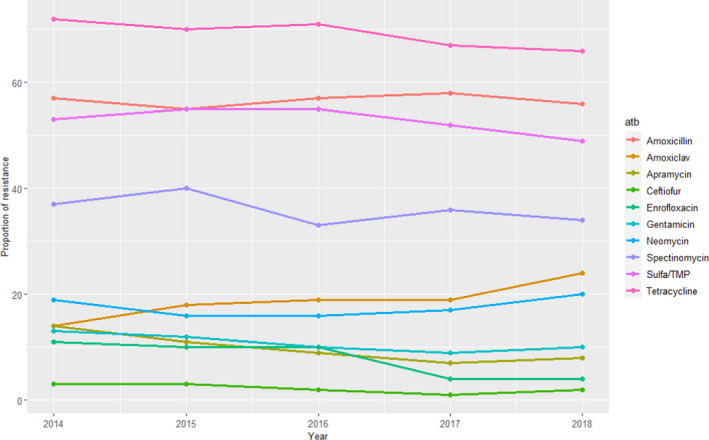
Proportion (%) of clinical swine E. coli isolates resistant to 10 antimicrobials of interest reported by the RESAPATH monitoring programme (Amoxiclav: amoxicillin + clavulanic acid)
The most notable trends concern resistance to enrofloxacin, which decreased from 11% to 4%; apramycin, which decreased from 14% to 8%; and amoxicillin‐clavulanic acid, which, increased from 14% to 24%. Despite these variations, proportions of resistance are in line with the results of Table 4 for European studies (approximately within one weighted SD) for all antimicrobials.
SWEDRES‐Svarm (Sweden)
Data on AMR from clinical E. coli isolates were retrieved from faecal samples or samples collected post‐mortem from the gastrointestinal tract for the period 2014–2018. For E. coli between 52 and 118 isolates were tested for resistance to up to nine antimicrobials of interest for this opinion (although in 2014 ceftiofur was included for the only time, and in the same year nitrofurantoin was not tested – no resistant isolate to either antimicrobial was found). For the remaining antimicrobials, resistance levels were higher for ampicillin and sulfonamides–trimethoprim (≥ 30%), intermediate for tetracycline (10–25%) and less than 10% (for most years) for the remaining antimicrobials, although values for several of them varied largely depending on the year (Figure 8), what could be related with the small sample size.
Figure 8.
Proportion (%) of clinical swine E. coli isolates resistant to eight antimicrobials of interest reported by the SWEDRES‐Svarm monitoring programme
Even though resistance there was to ampicillin, potentiated sulfonamides and tetracycline were more common compared with other antimicrobials in the SWEDRES‐Svarm E. coli population, and resistance levels were lower than the weighted average means provided in Table 4. The same trend (lower values reported by SWEDRES‐Svarm) is observed for aminoglycosides, 3GCs, fluoroquinolones and colistin (Table 4).
UK‐VARSS (United Kingdom)
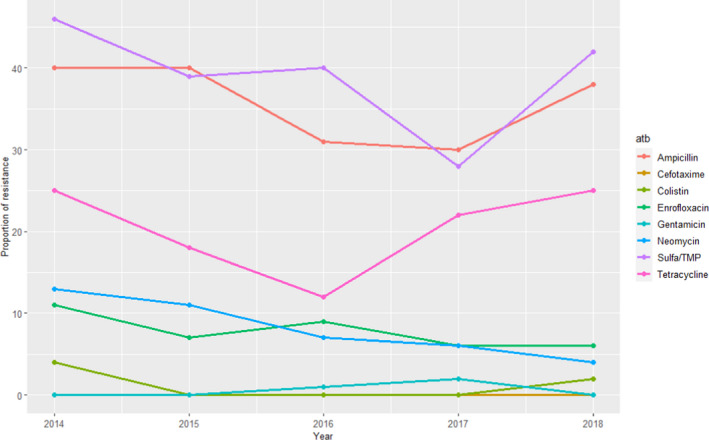
For E. coli, information on AMR to up to 11 antimicrobials of interest for this opinion is provided separately for the 2015–2019 period on isolates from England and Wales (159–441 isolates tested each year), Northern Ireland (52–93 isolates/year) and Scotland (11–91 isolates/year), although colistin and doxycycline were only used in ASTs conducted in England and Wales in 1 and 4 years, respectively. Resistance levels for certain antimicrobials depend on the geographical origin of the isolates, and could be due to differences in the methodology and on the sample size analysed (Figure 9). Considering the E. coli isolates from England and Wales, higher resistance levels (> 30%) were observed for ampicillin, sulfonamides/trimethoprim, spectinomycin and tetracycline, while for Northern Ireland and Scotland neomycin and amoxicillin–clavulanic acid were also among the antimicrobials with the higher levels of resistance. Resistance to apramycin, neomycin, cefpodoxime and enrofloxacin in isolates from England/Wales and Scotland was less than 20% (< 6% for the two latter ones in most years), while the proportion of resistant isolates from Northern Ireland to all antimicrobials was above 15%, therefore suggesting the existence of significant differences in the collections analysed/methods applied.
Figure 9.
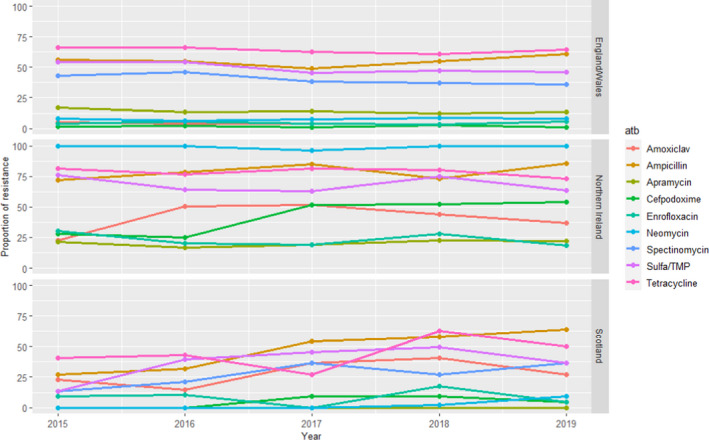
Proportion (%) of clinical swine E. coli isolates resistant to nine antimicrobials of interest reported by the UK‐VARSS monitoring programme
When comparing the England/Wales data set (with a larger sample size and more or less stable trends over time) with the weighted average means in Table 4, resistance levels are similar to those reported in European studies except for amoxicillin–clavulanic acid (lower resistance in the UK‐VARSS data although only 3 years were included).
GERM‐Vet (Germany)
Swine isolates of E. coli were all isolated from intestinal disease. For all age groups, intermediate resistant and resistant isolates are cumulated and shown in Figure 10.
Figure 10.
Proportion (%) of clinical swine E. coli isolates resistant to five antimicrobials of interest reported by the GERM‐Vet monitoring programme (Amoxiclav: amoxicillin + clavulanic acid)
3.1.4. Streptococcus suis
3.1.4.1. Results of the ELR by bacterium
Streptococcus suis is an important porcine pathogen capable of causing a range of different infections in pigs of all age groups. Examples of these infections include meningitis, arthritis, pneumonia, septicaemia and endocarditis. Serotype 2 is the most widespread type, and is associated with meningitis in both pigs and humans.
In total, 20 studies with ≥ 10 S. suis isolates and results for one or more of the relevant antibiotics (ampicillin/amoxicillin, cefazolin, ceftiofur, cephalothin, florfenicol, penicillin, sulfonamide‐trimethoprim, sulfonamide, tetracyclines, tiamulin, tylosin) were included. Those studies were distributed as follows: Africa (0), Asia (7), Europe (8), Oceania (1), North America (2) and South America (2). The distribution of S. suis isolates per site of infection is shown in Figure 11. For most of the isolates reported, there was no background information on the infection site.
Figure 11.
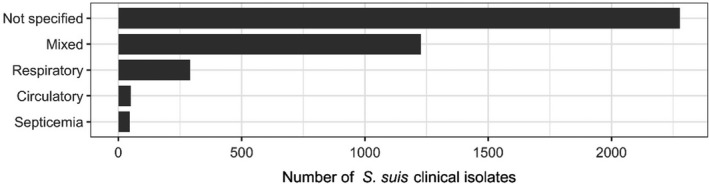
Distribution of S. suis isolates per site of infection
Figure 12 shows for each continent the proportion of resistance reported in individual studies with at least 10 S. suis isolates. Information on the proportion of resistance sorted by country is in Appendix D.
Figure 12.
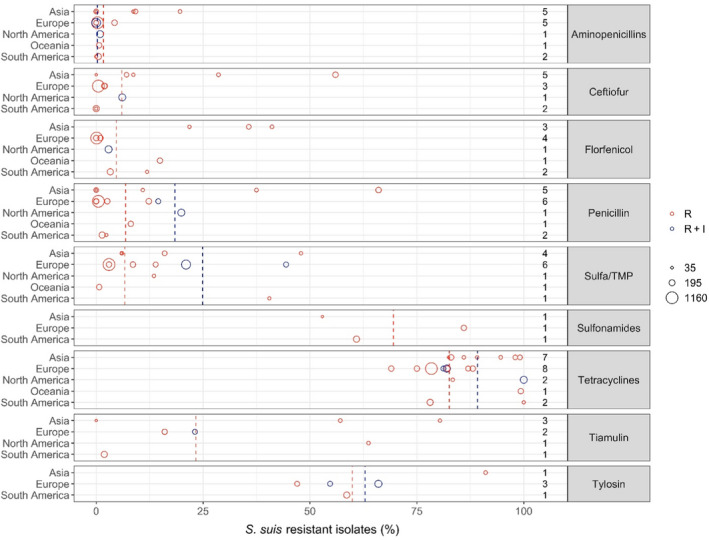
- Each circle represents one study, and the size of each circle reflects how many isolates were included in the study. The colour of a circle illustrates resistance only (red circle) or resistance merged with intermediate (blue circle). The dashed lines indicate, for each antibiotic, the weighted arithmetic mean of %R (red dashed line) or %R + I (blue dashed line). The exact percentages these lines represent are listed in Appendix E. Numbers written to the left of the antibiotic names reflect the number of studies for a certain drug/continent combination.
Overall, the lowest levels of resistance in S. suis were seen for beta‐lactam antibiotics. This was particularly true for aminopenicillins with the average proportion of resistance being less than 1% in four of the five continents. Somewhat higher – but still fairly moderate – average levels (7.2%) were observed in Asia with the highest level (19.6%) observed among 56 isolates from various infections in pigs in Korea (Gurung et al., 2015). Markedly, that study also showed high or very high levels (29–95%) of resistance to other drugs with no obvious explanation for this. The interpretation of results in that study was unclear and difficult to evaluate, as four previous studies were cited for the breakpoints used. Overall, slightly higher levels of resistance were observed for ceftiofur and penicillin, again with the highest average proportions in Asia.
Florfenicol resistance appears to be literally absent from S. suis isolates in Europe with the four studies from that continent reporting either 0 or 1% of isolates resistant to that drug. Just under 3% and 4% resistance was observed in the two studies representing North and South America, respectively, whereas 14.9% of isolates in Australia were resistant to florfenicol. The three Asian studies (two from Korea and one from Thailand) reported florfenicol resistance in 28.8% and 41.1% of S. suis isolates.
For sulfonamides‐trimethoprim, the highest continent‐specific proportion of resistance (40.5%) was observed in South America, although based on only 42 isolates in one study from Brazil (Serpa et al., 2020). The lowest level of resistance was observed in Oceania represented by Australia (0.7% of 148 isolates). Unlike most other antibiotic classes, the difference between isolates from Asia and Europe was smaller with average resistance proportions of 18.6% and 10.7%, respectively.
Resistance to tiamulin varied considerably between studies, especially in Asia ranging from 0% to 80.4% (Zhang et al., 2015; Yongkiettrakul et al., 2019). Only four studies reported susceptibility data for tylosin and the proportions of resistance varied from 47% to 91.1% with the highest reported by Gurung et al. (2015) in Korea. Several of the studies reporting data for tiamulin and tylosin referred to CLSI breakpoints, but CLSI has not published Streptococcus‐specific breakpoints for these drugs. Also, there are no human breakpoints as these drugs are veterinary specific. So, the real interpretation used for the data reported is unknown and results are questionable.
Very high levels of resistance to tetracyclines were reported for all continents. In fact, among the 20 studies reporting data for this drug, the lowest level of 69% resistance was observed in Denmark (DANMAP, 2019).
3.1.4.2. Results from the national AMR surveillance reports
DANMAP (Danmark)
For S. suis between 43 and 152 isolates were tested using up to six antimicrobials of interest for this opinion, although ciprofloxacin and sulfonamides were only used in 3/5 years. Resistance levels were high for sulfonamides and tetracyclines (≥ 70% in the last year), and this was moderate for tiamulin (ranging between 12% and 25%) and lower (< 5% in the last 2 years) for the remaining antimicrobials (ciprofloxacin, sulfonamide–trimethoprim combinations and penicillin, with no resistance against the latter detected during 2015–2019) (Figure 13). These results are largely in agreement with weighted arithmetic means presented in Table 5 that indicated similarly low resistance levels in clinical isolates for 3GC and penicillins and slightly higher resistance to sulfonamides–trimethoprim combinations, similar moderate resistance to pleuromutilins and much higher levels of resistance to tetracyclines and sulfonamides when not combined with trimethoprim.
Figure 13.
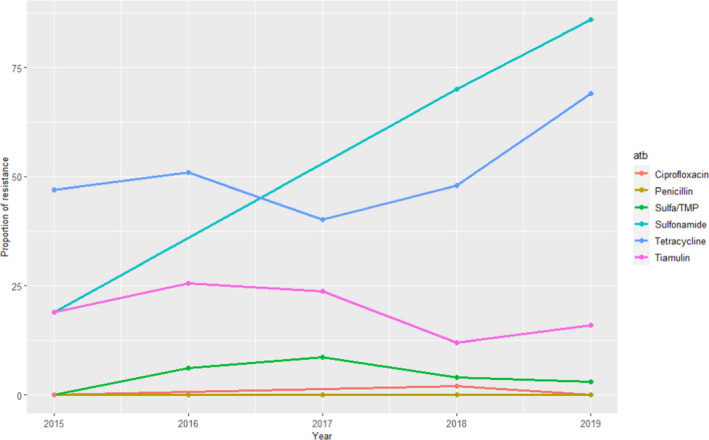
Proportion (%) of clinical swine S. suis isolates resistant to six antimicrobials of interest reported by the DANMAP monitoring programme
Table 5.
Weighted arithmetic mean, minimum and maximum proportion of resistance (%R or %R + I) and weighted standard deviation (SD) in S. suis for the target antimicrobials in each continent included in the studies. NA means that SD cannot be calculated as only one study is included
| Antibiotic | Continent | No. of papers | N (number of isolates) | Weighted arithmetic mean proportion of resistance (%) | Minimum resistance % observed | Maximum resistance % observed | Weighted standard deviation |
|---|---|---|---|---|---|---|---|
| Aminopenicillins | Asia | 5 | 340 | 7.1 | 0 | 19.6 | 6.9 |
| Aminopenicillins | Europe | 5 | 2,106 | 0.5 | 0 | 4.3 | 1.1 |
| Aminopenicillins | N America | 1 | 301 | 0.9 | 0.9 | 0.9 | NA |
| Aminopenicillins | Oceania | 1 | 148 | 0.7 | 0.7 | 0.7 | NA |
| Aminopenicillins | S America | 2 | 257 | 0.4 | 0 | 0.5 | 0.2 |
| Ceftiofur | Asia | 5 | 393 | 29.5 | 0 | 56 | 23.2 |
| Ceftiofur | Europe | 3 | 1,476 | 0.8 | 0.5 | 2 | 0.6 |
| Ceftiofur | N. America | 1 | 301 | 6.1 | 6.1 | 6.1 | NA |
| Ceftiofur | S America | 2 | 257 | 0 | 0 | 0 | 0 |
| Florfenicol | Asia | 3 | 200 | 34 | 21.8 | 41.1 | 7.1 |
| Florfenicol | Europe | 4 | 1,613 | 0.2 | 0 | 1 | 0.3 |
| Florfenicol | N. America | 1 | 301 | 2.9 | 2.9 | 2.9 | NA |
| Florfenicol | Oceania | 1 | 148 | 14.9 | 14.9 | 14.9 | NA |
| Florfenicol | S. America | 2 | 257 | 4.7 | 3.3 | 11.9 | 3.2 |
| Penicillin | Asia | 5 | 401 | 32.7 | 0 | 66 | 29.6 |
| Penicillin | Europe | 6 | 1,856 | 2.5 | 0 | 14.5 | 4.6 |
| Penicillin | N. America | 1 | 301 | 19.9 | 19.9 | 19.9 | NA |
| Penicillin | Oceania | 1 | 148 | 8.1 | 8.1 | 8.1 | NA |
| Penicillin | S. America | 2 | 257 | 1.6 | 1.4 | 2.4 | 0.4 |
| Sulfa/TMP | Asia | 4 | 236 | 18.6 | 5.9 | 47.9 | 15.1 |
| Sulfa/TMP | Europe | 6 | 2,276 | 10.7 | 3 | 44.4 | 11 |
| Sulfa/TMP | N. America | 1 | 48 | 13.5 | 13.5 | 13.5 | NA |
| Sulfa/TMP | Oceania | 1 | 148 | 0.7 | 0.7 | 0.7 | NA |
| Sulfa/TMP | S. America | 1 | 42 | 40.5 | 40.5 | 40.5 | NA |
| Sulfonamides | Asia | 1 | 34 | 52.9 | 52.9 | 52.9 | NA |
| Sulfonamides | Europe | 1 | 147 | 86 | 86 | 86 | NA |
| Sulfonamides | S. America | 1 | 215 | 60.9 | 60.9 | 60.9 | NA |
| Tetracyclines | Asia | 7 | 549 | 90.7 | 82.4 | 99.1 | 7 |
| Tetracyclines | Europe | 8 | 2,332 | 79.5 | 69 | 88.1 | 4.2 |
| Tetracyclines | N. America | 2 | 349 | 97.7 | 83.4 | 100 | 5.7 |
| Tetracyclines | Oceania | 1 | 148 | 99.3 | 99.3 | 99.3 | NA |
| Tetracyclines | S. America | 2 | 257 | 81.7 | 78.1 | 100 | 8.1 |
| Tiamulin | Asia | 3 | 136 | 50.7 | 0 | 80.4 | 31.1 |
| Tiamulin | Europe | 2 | 264 | 19.1 | 16 | 23.1 | 3.5 |
| Tiamulin | N. America | 1 | 48 | 63.7 | 63.7 | 63.7 | NA |
| Tiamulin | S. America | 1 | 215 | 1.9 | 1.9 | 1.9 | NA |
| Tylosin | Asia | 1 | 56 | 91.1 | 91.1 | 91.1 | NA |
| Tylosin | Europe | 3 | 542 | 59.5 | 47 | 66 | 7.9 |
| Tylosin | S. America | 1 | 215 | 58.6 | 58.6 | 58.6 | NA |
RESAPATH (France)
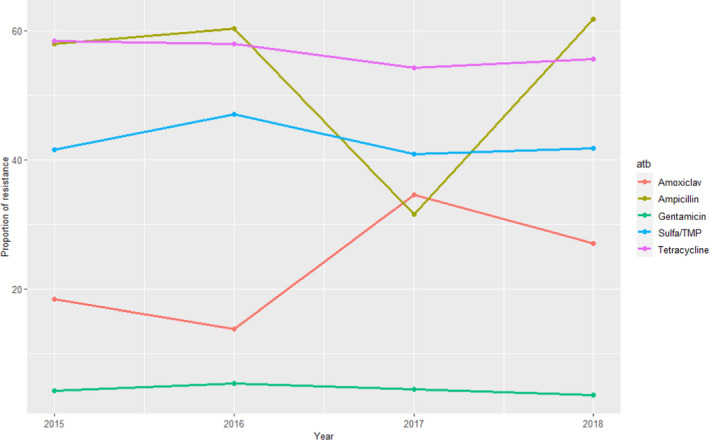
For S. suis, resistance data from 2014 to 2018 were available for six antimicrobials. The remaining antimicrobials were tested for all years, in between 280 and 582 clinical isolates from different pathologies. Resistance levels were very high (> 65%) for tetracycline and tylosin, somewhat high for sulfonamides–trimethoprim combinations (10–21%, with higher values in the last years) and very low (≤ 1%) for gentamicin and amoxicillin (Figure 14). These values are in line with weighted average means provided in Table 5 and further suggest that clinical S. suis isolates remain highly susceptible to aminopenicillins.
Figure 14.
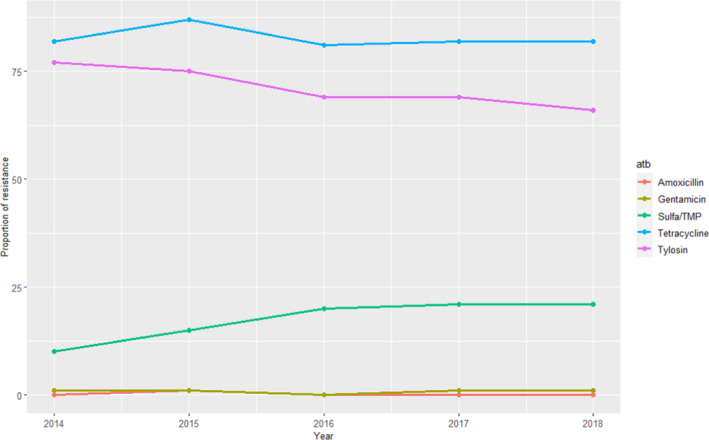
Proportion (%) of clinical swine S. suis isolates resistant to five antimicrobials of interest reported by the RESAPATH monitoring programme
UK‐VARSS (United Kingdom)
Between 63 and 115 clinical S. suis isolates retrieved from pigs were also tested for five antimicrobials that were of interest to this opinion, revealing high levels of resistance to tetracycline (> 85%) and tylosin 40–60%), lower levels of resistance to sulfonamides/trimethoprim (12–25%) and almost no resistance to ampicillin, penicillin and enrofloxacin (one single isolate resistant to penicillin found in 2015–2019) (Figure 15).
Figure 15.
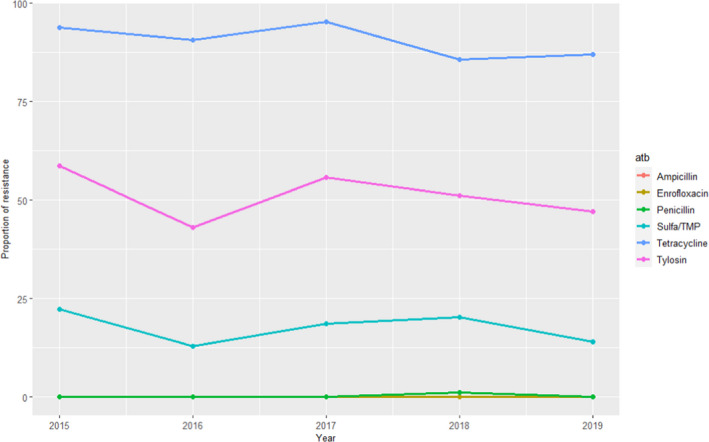
Proportion (%) of clinical swine S. suis isolates resistant to six antimicrobials of interest reported by the UK‐VARSS monitoring programme
These results are largely in agreement with the weighted arithmetic means provided in Table 5 for European studies for all antimicrobials.
GERM‐Vet (Germany)
Swine isolates of S. suis were isolated from respiratory disease out of the years 2015 and 2018 were all different symptomatic were included. Intermediate resistant and resistant isolates are cumulated and shown in Figure 16 (no data recorded for 2016).
Figure 16.
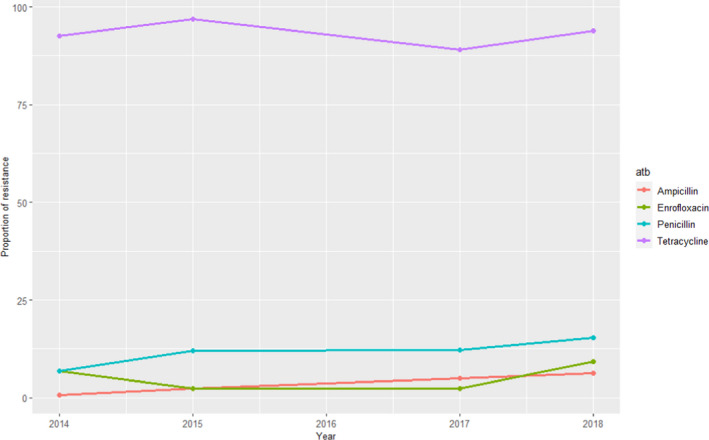
Proportion (%) of clinical swine S. suis isolates resistant to four antimicrobials of interest reported by the GERM‐Vet monitoring programme
3.1.5. Actinobacillus pleuropneumoniae
3.1.5.1. Results of the ELR by bacterium
Actinobacillus pleuropneumoniae is a highly contagious and toxigenic primary pathogen causing severe bronchopneumonia in pigs. All age groups can be affected, although pigs under 6 months of age are more susceptible with high morbidity and mortality rates.
In total, 17 studies with ≥ 10 A. pleuropneumoniae isolates and results for one or more of the relevant antibiotics (ampicillin/amoxicillin, amoxicillin–clavulanic acid, ceftiofur, cefazolin, cephalothin, enrofloxacin/ciprofloxacin, florfenicol, flumequine, gamithromycin, penicillin, sulfonamide‐trimethoprim, sulfonamide, tetracyclines, thiamphenicol, tiamulin, tildipirosin, tilmicosin and tulathromycin) were included. Those studies were distributed as follows: Africa (0), Asia (2), Europe (10), Oceania (1), North America (2) and South America (1).
The distribution of A. pleuropneumoniae isolates per site of infection is shown in Figure 17. The vast majority of isolates originated from respiratory infections.
Figure 17.
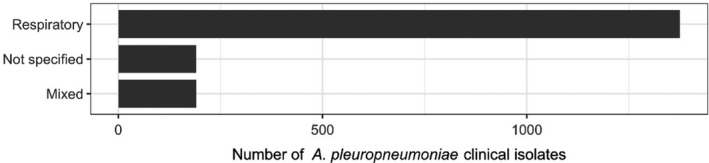
Distribution of A. pleuropneumoniae isolates per site of infection
Figure 18 shows for each continent the proportion of resistance reported in individual studies with at least 10 A. pleuropneumoniae isolates. Information on the proportion of resistance sorted by country is found in Appendix D.
Figure 18.
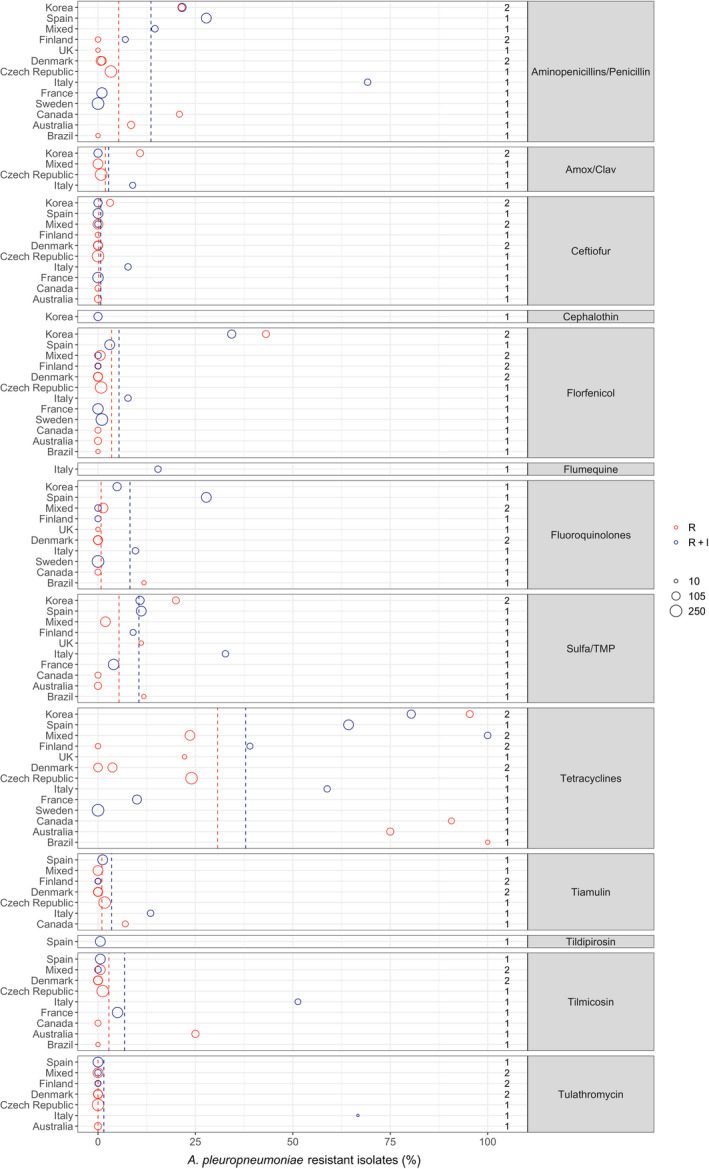
- Each circle represents one study, and the size of each circle reflects how many isolates were included in the study. The colour of a circle illustrates resistance only (red circle) or resistance merged with intermediate (blue circle). The dashed lines indicate, for each antibiotic, the weighted arithmetic mean of %R (red dashed line) or %R + I (blue dashed line). The exact percentages these lines represent are listed in Appendix E. Numbers written to the left of the antibiotic names reflect the number of studies for a certain drug/continent combination.
With the exception of tetracyclines, low to moderate average levels of resistance (< 14% weighted arithmetic mean) were observed for all antibiotics tested (Appendix E, Figure 18). Also, relatively limited geographical variation was observed for most of the antibiotics. By far the lowest level of resistance was observed for tulathromycin with all nine studies that tested this agent reporting full susceptibility in the isolates tested. This was not surprising considering that isolates with an MIC as high as 64 mg/L are considered susceptible according to CLSI breakpoints. An almost similar result (0.6% resistance) was observed in the single study testing tildipirosin, which is another long‐acting macrolide. Tilmicosin is a third macrolide that is however not registered for long‐acting parenteral use in pigs, but instead for oral use. Little or no resistance was also observed for this agent, with the exception of one Italian study (51.3%, Vanni et al. (2012)) and one Australian study (25%, Dayao et al. (2014)).
Similarly low levels of resistance were observed for ceftiofur with 11 of the 13 studies showing full susceptibility in all isolates tested. The only exceptions were an Italian and a Korean study reporting 7.7% and 3.1% of isolates as resistant (Vanni et al., 2012; Kim et al., 2016). Full susceptibility was also observed in the single study reporting data for the first‐generation cephalosporin cephalothin, whereas the five studies reporting data for amoxicillin–clavulanic acid showed resistance proportions ranging between 0% and 10.8% with the highest proportion reported by Kim et al. (2016).
For the more narrow‐spectrum penicillins/aminopenicillins, average levels of resistance were slightly higher. Again, the Italian study by Vanni et al. (2012) was the exception with 69.2% of 52 isolates reported as resistant. This study, which reported some of the highest resistance proportions for most of the antibiotics, included isolates from animals that had not been treated with antibiotics 3 weeks before sampling. The study used the French veterinary breakpoints for most of the antibiotics tested and also classified intermediate isolates as resistant. It cannot be excluded that these latter factors biased the results, especially as most other studies used the veterinary CLSI breakpoints specific for this bacterial species.
Most studies reported either full susceptibility or very low levels of resistance to florfenicol. One exception was a Korean study by Yoo et al. (2014) who found 34.3% of 102 isolates were resistant to this drug. The authors speculated that a reason for this high and locally increased level of resistance could be a recent national increasing use of florfenicol. The result was supported 2 years later by Kim et al. (2016) who found florfenicol resistance in 43.1% of 65 Korean porcine isolates. It therefore appears as if there is at least a country‐specific trend. It remains unknown if that trend exists in countries nearby, as no other studies from Asia reported data on florfenicol resistance in A. pleuropneumoniae.
Most studies reported between 0 and 12% resistance to sulfonamide‐trimethoprim. As for most other drugs, higher levels were detected in Korea (20%, Kim et al. (2016)) and Italy (32.7%, Vanni et al. (2012)). The same Italian study also reported the highest level of tiamulin resistance (13.5%), whereas resistance to this drug was either absent or at a very low level in other studies.
Overall, by far the highest levels of resistance were observed for tetracyclines, especially in studies conducted outside Europe (Figure 18). For this class, only three Nordic countries reported full susceptibility through their national surveillance systems (DANMAP, 2019; FINRES‐Vet, 2019; Swedres‐Svarm, 2019), whereas other studies reported varying, but often very high, levels of resistance (Figure 18). Interestingly, one Finnish study (Haimi‐Hakala et al., 2017) found 39% of 44 isolates were resistant to oxytetracycline. This is in direct contrast to the 0% from the Finnish national surveillance programme published 2 years later. Even though the two studies test slightly different compounds (tetracycline vs. oxytetracycline), the MIC distributions of the two studies are almost identical (data not shown). As they used the same clinical breakpoint from CLSI, the difference lies in the fact that one study considered intermediate isolates as resistant and the other did not. This again emphasises the difficulties in comparing proportions determined in different ways (%R vs. %R + I), and it means – at least for tetracyclines – that the comparison of blue and red circles in Figure 18 is not fair if a large fraction of isolates is intermediate, as observed for this drug/bug combination in Finland.
Resistance to fluoroquinolones was generally low with a few exceptions. By far the highest level (27.8%) was observed in Spain by Vilaro et al. (2020). The reason for this is unknown, but very recent antimicrobial treatment could be excluded, as pigs of that study had not been treated with antibiotics for at least 15 days before sampling. Also for fluoroquinolones, it is not completely fair to compare studies reporting %R with studies reporting %R + I. This is exemplified by Serpa et al. (2020) who found 11.8% resistance to enrofloxacin, but by adding the intermediate category, this percentage would increase to 18.9%.
3.1.5.2. Results from the national AMR surveillance reports
FINRES‐Vet (Finland)
For A. pleuropneumoniae, considered the most important respiratory pathogens in growing pigs in Finland, between 15 and 35 isolates retrieved from pigs with respiratory disease were tested each year. Data on resistance to six antimicrobials of interest for this opinion (ceftiofur, florfenicol, oxytetracycline, penicillin, tiamulin and tulathromycin) are provided in the reports, with all isolates being consistently below CBP for most antimicrobials and years (intermediate susceptibility was reported in some cases for oxytetracycline, e.g. 17% of the isolates in 2019) and only one of the 22 isolates tested in 2016 was above the CBP for tiamulin. These very low levels of resistance are in agreement with the weighted arithmetic means provided in Table 6 for A. pleuropneumoniae retrieved in European studies except for tetracyclines and penicillins, with average values of 20.1% and 7.8%.
Table 6.
Weighted arithmetic mean, minimum and maximum proportion of resistance (%R or %R + I) and weighted standard deviation (SD) in A. pleuropneumoniae for the target antimicrobials in each continent included in the studies. NA means that SD cannot be calculated as only one study is included
| Antibiotic | Continent | No. of papers | N (number of isolates) | Weighted arithmetic mean proportion of resistance (%) | Minimum resistance % observed | Maximum resistance % observed | Weighted standard deviation |
|---|---|---|---|---|---|---|---|
| Amox/Clav | Asia | 2 | 167 | 4.2 | 0 | 10.8 | 5.3 |
| Amox/Clav | Europe | 3 | 445 | 1.3 | 0 | 8.9 | 2.6 |
| Ceftiofur | Asia | 2 | 167 | 1.2 | 0 | 3.1 | 1.5 |
| Ceftiofur | Europe | 8 | 1087 | 0.4 | 0 | 7.7 | 1.6 |
| Ceftiofur | N America | 2 | 98 | 0 | 0 | 0 | 0 |
| Ceftiofur | Oceania | 1 | 71 | 0 | 0 | 0 | NA |
| Cephalothin | Asia | 1 | 102 | 0 | 0 | 0 | NA |
| Florfenicol | Asia | 2 | 167 | 37.7 | 34.3 | 43.1 | 4.3 |
| Florfenicol | Europe | 10 | 1382 | 1 | 0 | 7.7 | 1.6 |
| Florfenicol | N America | 2 | 98 | 0 | 0 | 0 | 0 |
| Florfenicol | Oceania | 1 | 71 | 0 | 0 | 0 | NA |
| Florfenicol | S America | 1 | 17 | 0 | 0 | 0 | NA |
| Flumequine | Europe | 1 | 52 | 15.4 | 15.4 | 15.4 | NA |
| Fluoroquinolones | Asia | 1 | 102 | 4.9 | 4.9 | 4.9 | NA |
| Fluoroquinolones | Europe | 8 | 938 | 5.6 | 0 | 27.8 | 10.4 |
| Fluoroquinolones | N America | 2 | 98 | 0 | 0 | 0 | 0 |
| Fluoroquinolones | S America | 1 | 17 | 11.8 | 11.8 | 11.8 | NA |
| Penicillins | Asia | 2 | 167 | 21.5 | 21.5 | 21.6 | 0 |
| Penicillins | Europe | 10 | 1237 | 7.8 | 0 | 69.2 | 15.7 |
| Penicillins | N America | 2 | 98 | 17.4 | 14.6 | 20.9 | 3.1 |
| Penicillins | Oceania | 1 | 71 | 8.5 | 8.5 | 8.5 | NA |
| Penicillins | S America | 1 | 17 | 0 | 0 | 0 | NA |
| Sulfa/TMP | Asia | 2 | 167 | 14.4 | 10.8 | 20 | 4.5 |
| Sulfa/TMP | Europe | 6 | 625 | 8.3 | 1.9 | 32.7 | 8.2 |
| Sulfa/TMP | N America | 1 | 43 | 0 | 0 | 0 | NA |
| Sulfa/TMP | Oceania | 1 | 71 | 0 | 0 | 0 | NA |
| Sulfa/TMP | S America | 1 | 17 | 11.8 | 11.8 | 11.8 | NA |
| Tetracyclines | Asia | 2 | 167 | 86.2 | 80.4 | 95.4 | 7.3 |
| Tetracyclines | Europe | 11 | 1339 | 20.1 | 0 | 64.3 | 21.6 |
| Tetracyclines | N America | 2 | 98 | 95.9 | 90.7 | 100 | 4.6 |
| Tetracyclines | Oceania | 1 | 71 | 75 | 75 | 75 | NA |
| Tetracyclines | S America | 1 | 17 | 100 | 100 | 100 | NA |
| Tiamulin | Europe | 8 | 941 | 1.4 | 0 | 13.5 | 3 |
| Tiamulin | N America | 1 | 43 | 7 | 7 | 7 | NA |
| Tildipirosin | Europe | 1 | 162 | 0.6 | 0.6 | 0.6 | NA |
| Tilmicosin | Europe | 7 | 1039 | 3.3 | 0 | 51.3 | 9.6 |
| Tilmicosin | N America | 2 | 98 | 0 | 0 | 0 | 0 |
| Tilmicosin | Oceania | 1 | 71 | 25 | 25 | 25 | NA |
| Tilmicosin | S America | 1 | 17 | 0 | 0 | 0 | NA |
| Tulathromycin | Europe | 8 | 895 | 0.4 | 0 | 66.7 | 5.4 |
| Tulathromycin | N America | 1 | 55 | 0 | 0 | 0 | NA |
| Tulathromycin | Oceania | 1 | 71 | 0 | 0 | 0 | NA |
DANMAP (Denmark)
For A. pleuropneumoniae, between 70 and 135 isolates were tested each year using 9 or 10 antimicrobials of interest for this opinion between 2015 and 2019 (ciprofloxacin and tulathromycin used in 3–4 years), of which no resistant isolates were found for ceftiofur, ciprofloxacin, florfenicol and sulfonamides–trimethoprim (data not shown). For the remaining antimicrobials, the proportion of resistant isolates was never greater than 4% and no resistant isolates were found in one or more years (Figure 19). Evidence of very low levels of resistance in clinical A. pleuropneumoniae isolates is largely in agreement with the results presented in Table 6, with weighted arithmetic means close to 0% for most antimicrobials assessed in the Danish isolate collection.
Figure 19.
Proportion (%) of clinical swine A. pleuropneumoniae isolates resistant to six antimicrobials of interest reported by the DANMAP monitoring programme
RESAPATH (France)
For AMR in A. pleuropneumoniae, AST results for nine antimicrobials of interest from between 108 and 191 clinical isolates tested each year between 2014 and 2018 were available (although amoxicillin+ clavulanic acid and enrofloxacin were only used in 2014–2016 and doxycycline was only used in 2017–2018). Resistance levels to tetracycline were higher compared with that reported in the Danish and Finnish national reports for this pathogen, with values closer to the weighted arithmetic mean for European studies (Table 6). In contrast, resistance to the remaining antimicrobials was close to or less than 5% over 2014–2018, in agreement with values provided in Table 6 (Figure 20 shows values for those antimicrobials used for at least 4 of the 5 years in the 2014–2018 period).
Figure 20.
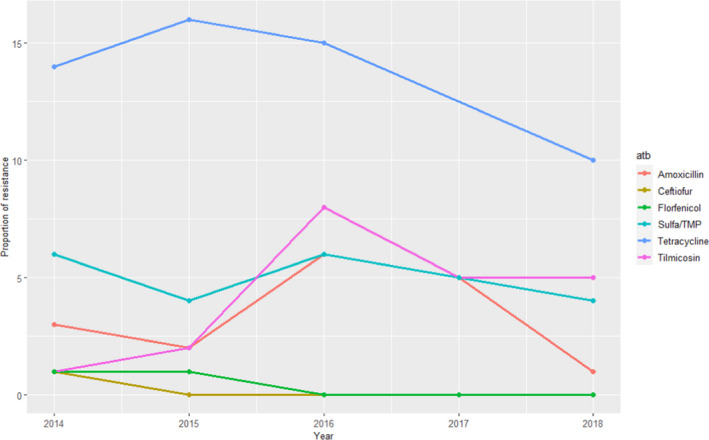
Proportion (%) of clinical swine A. pleuropneumoniae isolates resistant to eight antimicrobials of interest reported by the RESAPATH monitoring programme
SWEDRES‐Svarm (Sweden)
Data on AMR from clinical A. pleuropneumoniae cultured from lung samples were provided for the period 2014–2018. The AMR data from A. pleuropneumoniae are provided aggregated for isolates retrieved in 2011–2018 (total of 253 isolates, with 16–57 tested each year). Results suggest that isolates are fully susceptible to all antimicrobials of interest for this opinion tested (ampicillin, ciprofloxacin, florfenicol, penicillin and tetracycline) except for florfenicol, with 0.4% isolates showing phenotypic resistance.
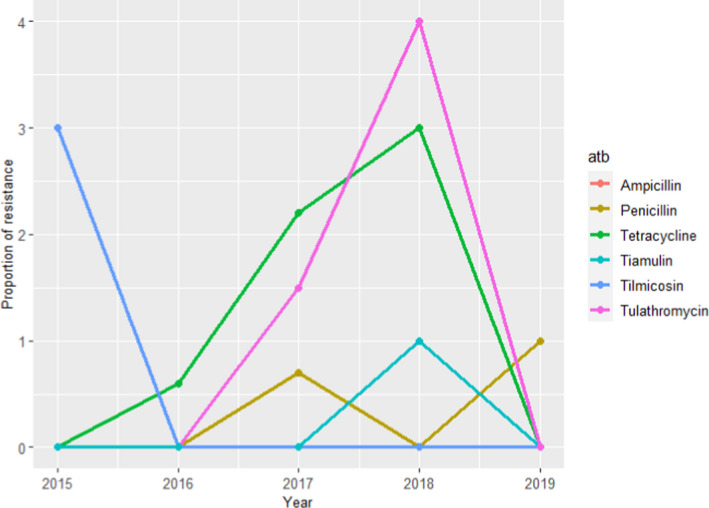
UK‐VARSS (United Kingdom)
For A. pleuropneumoniae data on resistance to seven antimicrobials in between 8 and 22 isolates retrieved each year from respiratory infections are available for the 2015–2019 period, although only four were available for all years (amoxicillin–clavulanic acid, doxycycline and florfenicol only tested the first 3 years, with only one doxycycline‐resistant isolate being found). When considering the remaining antimicrobials, higher proportions of resistant isolates were found for sulfonamides/trimethoprim and tetracycline in certain years, although resistance levels changed dramatically depending on the year due to the very small sample size (Figure 21). Therefore, although levels of resistance to these two antimicrobials were somewhat higher in specific time points overall most of the isolates were susceptible to most antimicrobials tested in line with the evidence presented in Table 6 for European studies.
Figure 21.
Proportion (%) of clinical swine A. pleuropneumoniae isolates resistant to four antimicrobials of interest reported by the UK‐VARSS monitoring programme
GERM‐Vet (Germany)
In 2014 in total of 101 isolates of A. pleuropneumoniae were tested and intermediate resistance against ampicillin was reported in 7.9% of the tested isolates. Resistance to tetracycline was found in 22.8% and intermediate resistance in 11.9% of the isolates. Intermediate resistance was stated for enrofloxacin in 2% of the isolates. For tilmicosin 1% resistant and for ceftiofur, florfenicol, tiamulin and tulathromycin, no resistant isolates were stated.
3.1.6. Pasteurella multocida
3.1.6.1. Results of the ELR by bacterium
Pasteurella. multocida is involved in respiratory infections and is particularly known for its role in atrophic rhinitis in which toxigenic strains, typically together with B. bronchiseptica, cause degeneration of the nasal turbinate bones and given a wrinkled and shortened snout. Especially pigs aged between 3 and 8 weeks are affected by this infection.
In total, 16 studies with ≥ 10 P. multocida isolates and results for one or more of the relevant antibiotics (ampicillin/amoxicillin, amoxicillin–clavulanic acid, cefazolin, ceftiofur, cephalothin, colistin, enrofloxacin/ciprofloxacin, erythromycin, florfenicol, penicillin, sulfonamide‐trimethoprim, sulfonamide, tetracyclines, tildipirosin, tilmicosin, tulathromycin, tylosin) were included. Those studies were distributed as follows: Africa (0), Asia (4), Europe (7), Oceania (1), North America (1) and South America (3).
The distribution of P. multocida isolates per site of infection is shown in Figure 22. The vast majority of isolates originated from respiratory infections.
Figure 22.
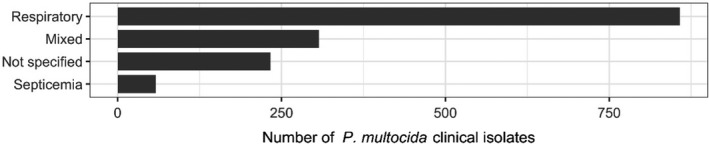
Distribution of P. multocida isolates per site of infection
Figure 23 shows for each continent the proportion of resistance reported in individual studies with at least 10 P. multocida isolates. Information on proportion of resistance sorted by country is in Appendix D.
Figure 23.
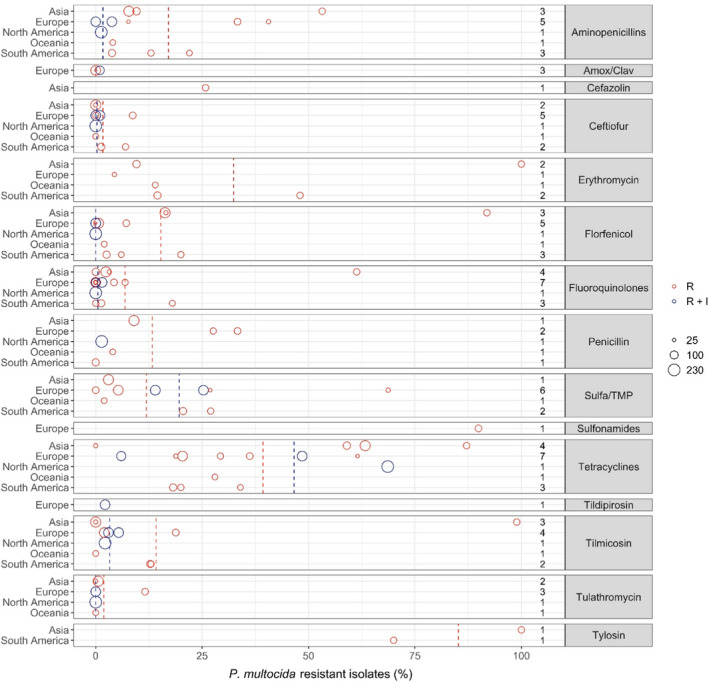
- Each circle represents one study, and the size of each circle reflects how many isolates were included in the study. The colour of a circle illustrates resistance only (red circle) or resistance merged with intermediate (blue circle). The dashed lines indicate, for each antibiotic, the weighted arithmetic mean of %R (red dashed line) or %R + I (blue dashed line). The exact percentages these lines represent are listed in Appendix E. Numbers written to the left of the antibiotic names reflect the number of studies for a certain drug/continent combination.
Overall, the resistance level for P. multocida mimicked to a large extent those observed for A. pleuropneumoniae, which is also a part of the Pasteurellaceae family. Six of seven studies reported either full susceptibility or < 1% resistance to tulathromycin. The only exception was a Spanish study (Cid et al., 2019) reporting 11.6% of 69 isolates resistant to that drug. There was no obvious reason for this finding, e.g. no information on prior treatment of pigs. The tulathromycin CLSI breakpoint for susceptibility is fourfold lower than for A. pleuropneumoniae. Similar or nearly as low resistance levels were observed for the other macrolides tilmicosin and tildipirosin. One unusual exception was the study by Yeh et al. (2017) showing tilmicosin resistance in 98.6% of 62 isolates from Taiwan. Without further discussing the reason for this specific finding, the authors concluded that resistance to several drugs was more pronounced in porcine P. multocida from China and Taiwan than in Australia and USA. Cid et al. (2019) found that 18.8% of Spanish isolates were resistant to tilmicosin; this was a high proportion compared with other European studies. Susceptibility to erythromycin was tested in six studies, and resistance was more pronounced than for the other macrolides. Again, the highest levels were reported in the study of Yeh et al. (2017), in which all isolates were resistant.
For beta‐lactams, 9 of 11 studies reported less than 2% of isolates resistant to ceftiofur. Cid et al. (2019) and Bessone et al. (2019) showed slightly higher proportions, namely 8.7% and 7% in Spain and Argentina, respectively. For the aminopenicillins, Cid et al. (2019) also found a high proportion of ampicillin resistance (33.3%). This result was backed up by another study from Spain reporting 40.6% of isolates as resistant (Petrocchi‐Rilo et al., 2019). An even higher level of resistance to amoxicillin, 55.6%, was reported in Taiwan by Yeh et al. (2017), but the interpretation of this result might be questionable, as the study claimed to use a CLSI veterinary breakpoint for amoxicillin. To the authors knowledge, such a breakpoint that does not exist, and instead ampicillin should be tested as a surrogate for all aminopenicillins. Five studies tested susceptibility to penicillin. Again, two Spanish studies stood out with Cid et al. (2019) and Cuevas et al. (2020) reporting the highest levels of resistance, namely 33.6% and 27.6%. The three studies, all European, testing amoxicillin–clavulanic acid reported only 0 or 1% resistance to this drug. A possible explanation for the high level of beta‐lactam resistance in Spanish P. multocida isolates was proposed by Petrocchi‐Rilo et al. (2019). They claimed that a recent increasing frequency of aminopenicillin resistance was likely to be associated with the increased use of beta‐lactams for treatment and prophylaxis of respiratory disorders in pigs.
Nine out of 13 studies found less than 8% of isolates resistant to florfenicol. The exceptions included three Asian studies reporting 16.3–91.6% resistance (Lee et al., 2012; Yeh et al., 2017; Kim et al., 2019) and one Argentinian study (Bessone et al., 2019) with 20% resistance. So, the trend of high florfenicol resistance levels in Asia (see previous sections on S. suis and A. pleuropneumoniae) is confirmed for this bacterial species also.
Resistance levels varied a lot between studies for sulfonamide–trimethoprim, and there was no apparent geographical trend. By far the highest level of resistance (68.7%) was reported among 32 Spanish isolates (Petrocchi‐Rilo et al., 2019) and, interestingly, the authors of that paper reported that this percentage was lower than that reported previously in Spain.
Thirteen out of 15 studies reported less than 7% resistance to fluoroquinolones. Again, the Korean study by Yeh et al. (2017) was an exception with 61.3% of isolates being resistant. A much lower but still moderate–high resistance level of 18% was reported in Brazil by Amaral et al. (2019). As in A. pleuropneumoniae, the proportion of isolates in the intermediate category for enrofloxacin was relatively high, therefore compromising a fair comparison between %R and %R + I.
As in A. pleuropneumoniae, the overall highest levels of resistance were observed for tetracyclines. Interestingly, two studies from Korea differed substantially with Kim et al. (2019) reporting 63.3% and Lee et al. (2012) reporting 0% resistance. Both studies had seemingly used the same breakpoint and included isolates from many farms representing a large part of country. One difference was however that the most recent study had isolates up until 2016, whereas the older study had isolates collected until 2010. This temporal difference may explain at least part of the difference in tetracycline susceptibility. Also for tetracycline, some studies reported a large proportion of isolates in the intermediate category, meaning that %R and %R + I are difficult to compare.
3.1.6.2. Results from the national AMR surveillance reports
RESAPATH (France)
AST data from between 113 and 170 clinical isolates from different pathologies for nine antimicrobials of interest for this opinion were included in the reports with results covering 2014–2018. Higher resistance levels for sulfonamides–trimethoprim (12–17%) and tetracycline (6–10%) were found, while for all the remaining antimicrobials proportion of resistant isolates was ≤ 3% (and mostly ≤ 1%) (Figure 24).
Figure 24.
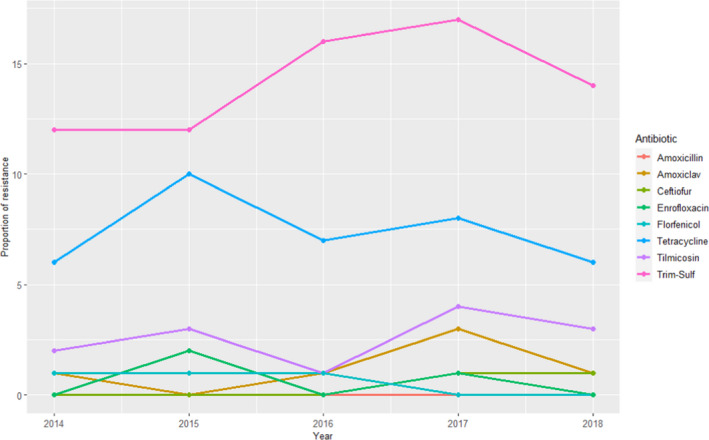
Proportion (%) of clinical swine P. multocida isolates resistant to eight antimicrobials of interest reported by the RESAPATH monitoring programme
Compared with the weighted arithmetic means provided in Table 7 for European studies the proportion of resistance was lower for aminopenicillins, potentiated sulfonamides and tetracyclines, although a wide variation of estimates were found in the ELR suggesting higher variability for these antimicrobial classes. For the remaining antimicrobial classes, the low levels of resistance reported in the RESAPATH collection were in agreement with results presented in Table 7.
Table 7.
Weighted arithmetic mean, minimum and maximum proportion of resistance (%R or %R + I) and weighted standard deviation (SD) in P. multocida for the target antimicrobials in each continent included in the studies. NA means that SD cannot be calculated as only one study is included
| Antibiotic | Continent | No. of papers | N (number of isolates) | Weighted arithmetic mean proportion of resistance (%) | Minimum resistance % observed | Maximum resistance % observed | Weighted Standard deviation |
|---|---|---|---|---|---|---|---|
| Aminopenicillins | Asia | 3 | 311 | 17.3 | 7.8 | 53.2 | 17.9 |
| Aminopenicillins | Europe | 5 | 419 | 10.4 | 0 | 40.6 | 14.5 |
| Aminopenicillins | N. America | 1 | 233 | 1.3 | 1.3 | 1.3 | NA |
| Aminopenicillins | Oceania | 1 | 51 | 4 | 4 | 4 | NA |
| Aminopenicillins | S. America | 3 | 188 | 11.6 | 3.8 | 22 | 7.4 |
| Amox/Clav | Europe | 3 | 289 | 0.4 | 0 | 1 | 0.5 |
| Cefazolin | Asia | 1 | 62 | 25.8 | 25.8 | 25.8 | NA |
| Ceftiofur | Asia | 2 | 197 | 0 | 0 | 0 | 0 |
| Ceftiofur | Europe | 5 | 580 | 1.3 | 0 | 8.7 | 2.8 |
| Ceftiofur | N. America | 1 | 233 | 0 | 0 | 0 | NA |
| Ceftiofur | Oceania | 1 | 51 | 0 | 0 | 0 | NA |
| Ceftiofur | S. America | 2 | 138 | 3.8 | 1.3 | 7 | 2.8 |
| Erythromycin | Asia | 2 | 145 | 48.3 | 9.6 | 100 | 44.9 |
| Erythromycin | Europe | 1 | 32 | 4.4 | 4.4 | 4.4 | NA |
| Erythromycin | Oceania | 1 | 51 | 14 | 14 | 14 | NA |
| Erythromycin | S. America | 2 | 138 | 29.1 | 14.5 | 48 | 16.7 |
| Florfenicol | Asia | 3 | 259 | 34.4 | 16.3 | 91.9 | 32.3 |
| Florfenicol | Europe | 5 | 547 | 1.1 | 0 | 7.2 | 2.3 |
| Florfenicol | N. America | 1 | 233 | 0 | 0 | 0 | NA |
| Florfenicol | Oceania | 1 | 51 | 2 | 2 | 2 | NA |
| Florfenicol | S America | 3 | 188 | 9 | 2.6 | 20 | 7.7 |
| Fluoroquinolones | Asia | 4 | 342 | 12.6 | 0 | 61.3 | 23 |
| Fluoroquinolones | Europe | 7 | 601 | 1.5 | 0 | 6.9 | 2.2 |
| Fluoroquinolones | N. America | 1 | 233 | 0 | 0 | 0 | NA |
| Fluoroquinolones | S. America | 3 | 188 | 5.3 | 0 | 18 | 7.7 |
| Penicillin | Asia | 1 | 166 | 9 | 9 | 9 | NA |
| Penicillin | Europe | 2 | 127 | 30.7 | 27.6 | 33.3 | 2.9 |
| Penicillin | N. America | 1 | 233 | 1.4 | 1.4 | 1.4 | NA |
| Penicillin | Oceania | 1 | 51 | 4 | 4 | 4 | NA |
| Penicillin | S. America | 1 | 78 | 0 | 0 | 0 | NA |
| Sulfa/TMP | Asia | 1 | 166 | 3 | 3 | 3 | NA |
| Sulfa/TMP | Europe | 6 | 584 | 16.6 | 0 | 68.7 | 15.5 |
| Sulfa/TMP | Oceania | 1 | 51 | 2 | 2 | 2 | NA |
| Sulfa/TMP | S. America | 2 | 138 | 23.3 | 20.5 | 27 | 3.2 |
| Sulfonamides | Europe | 1 | 69 | 89.9 | 89.9 | 89.9 | NA |
| Tetracyclines | Asia | 4 | 342 | 60.8 | 0 | 87.1 | 21.6 |
| Tetracyclines | Europe | 7 | 620 | 28.3 | 6 | 61.5 | 16.7 |
| Tetracyclines | N. America | 1 | 233 | 68.6 | 68.6 | 68.6 | NA |
| Tetracyclines | Oceania | 1 | 51 | 28 | 28 | 28 | NA |
| Tetracyclines | S. America | 3 | 188 | 23 | 18.2 | 34 | 6.7 |
| Tildipirosin | Europe | 1 | 150 | 2.2 | 2.2 | 2.2 | NA |
| Tilmicosin | Asia | 3 | 259 | 23.7 | 0 | 98.9 | 42.3 |
| Tilmicosin | Europe | 4 | 521 | 5.5 | 2 | 18.8 | 5.4 |
| Tilmicosin | N. America | 1 | 233 | 2.2 | 2.2 | 2.2 | NA |
| Tilmicosin | Oceania | 1 | 51 | 0 | 0 | 0 | NA |
| Tilmicosin | S. America | 2 | 138 | 12.9 | 12.8 | 13 | 0.1 |
| Tulathromycin | Asia | 2 | 197 | 0.5 | 0 | 0.6 | 0.2 |
| Tulathromycin | Europe | 3 | 371 | 2.2 | 0 | 11.6 | 4.5 |
| Tulathromycin | N. America | 1 | 233 | 0 | 0 | 0 | NA |
| Tulathromycin | Oceania | 1 | 51 | 0 | 0 | 0 | NA |
| Tylosin | Asia | 1 | 62 | 100 | 100 | 100 | NA |
| Tylosin | S. America | 1 | 60 | 70 | 70 | 70 | NA |
UK‐VARSS (United Kingdom)
For P. multocida, the number of clinical isolates tested for resistance to up to eight antimicrobials of interest for this opinion each year between 2015 and 2019 was only between 11 and 40 (tylosin was only tested for the first 2 years and amoxicillin–clavulanic acid, doxycycline and florfenicol the first 3 years). No resistant isolates to the last three antimicrobials were found, while resistance to tylosin in the 2 years it was assessed was 27 and 37%. For the remaining four antimicrobials higher levels of resistance were found for tetracycline (> 60%) followed by sulfonamides‐trimethoprim and ampicillin, while no resistance to enrofloxacin was found (Figure 25). Although comparisons must be carried out carefully due to the limited sample size in the UK‐VARSS collection, the described resistance levels for tetracycline were higher than the weighted arithmetic mean for European studies, while similar resistance levels were reported for the other three antimicrobials (Table 7).
Figure 25.
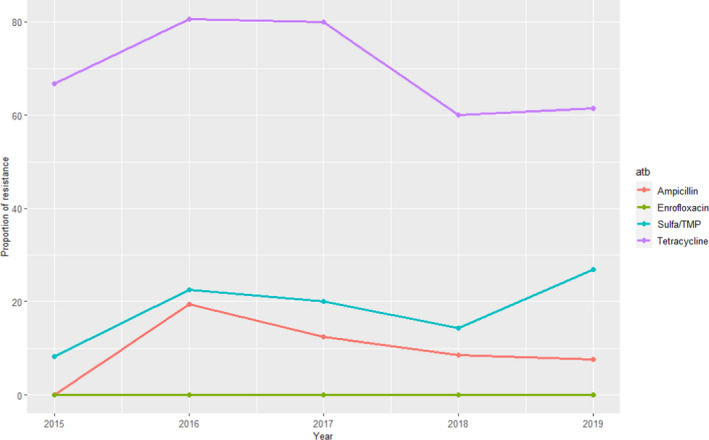
Proportion (%) of clinical swine P. multocida isolates resistant to four antimicrobials of interest reported by the UK‐VARSS monitoring programme
GERM‐Vet (Germany)
Isolates from P. multocida were only tested in the year 2015 with 89 isolates from animals with respiratory symptoms. Only tetracycline resistant (6,7%) and intermediate resistant (2,2%) isolates were found by testing against 23 drugs or drug combinations and in 8 of these clinical break points were addressed.
3.1.7. Glaeserella (Haemophilus) parasuis
3.1.7.1. Results of the ELR by bacterium
Glaesserella parasuis (until 2020 known as H. parasuis) is an opportunistic pathogen residing in the upper respiratory tract of pigs. Young and previously unexposed pigs are particularly susceptible to the bacterium, which may cause severe infection such as polyserositis, septicaemia and arthritis.
In total, eight studies with ≥ 10 G. parasuis isolates and results for one or more of the relevant antibiotics (ampicillin/amoxicillin, amoxicillin–clavulanic acid, cefazolin, ceftiofur, cephalothin, enrofloxacin/ciprofloxacin, erythromycin, florfenicol, penicillin, sulfonamide‐trimethoprim, sulfonamide, tetracyclines, thiamphenicol, tiamulin, tildipirosin, tulathromycin) were included. Those studies were distributed as follows: Africa (0), Asia (5), Europe (2), Oceania (0), North America (0) and South America (1).
The distribution of G. parasuis isolates per site of infection is shown in Figure 26. Mostly, studies reported data on G. parasuis originating from different infections.
Figure 26.
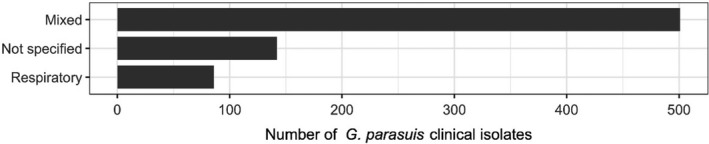
Distribution of G. parasuis isolates per site of infection
Figure 27 shows for each country the proportion of resistance reported in individual studies with at least 10 G. parasuis isolates.
Figure 27.
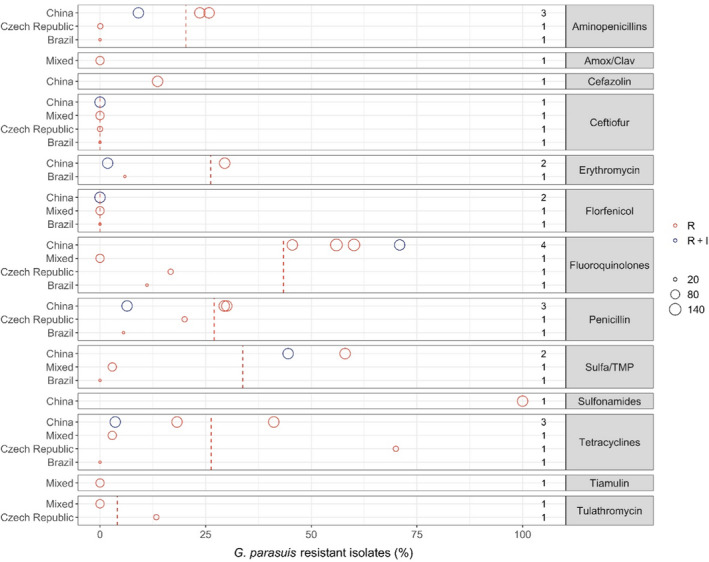
- Each circle represents one study, and the size of each circle reflects how many isolates were included in the study. The colour of a circle illustrates resistance only (red circle) or resistance merged with intermediate (blue circle). The dashed lines indicate, for each antibiotic, the weighted arithmetic mean of %R (red dashed line) or %R + I (blue dashed line). The exact percentages these lines represent are listed in Appendix E. Numbers written to the left of the antibiotic names reflect the number of studies for a certain drug/country combination.
There are no internationally recognised CBP for G. parasuis, but at least three of the studies from which data were extracted (Zhou et al., 2010; El Garch et al., 2016; Nedbalcová et al., 2017) had adapted the CLSI breakpoints available for A. pleuropneumoniae and/or P. multocida. Some other studies also referred to CLSI breakpoints, but for those it was unclear if they had used the same approach (e.g. Zhang et al. (2013)). Although these three species belong to the same family (Pasteurellaceae), adaptation of breakpoints may be problematic for predicting clinical outcome, especially as the breakpoints for the latter two species are specific for respiratory infections, and G. parasuis may cause a more diverse clinical picture of infections.
For macrolides, two studies from Europe reported data for tulathromycin. One of them, with data from Denmark, France and Germany, found full susceptibility among 68 isolates (El Garch et al., 2016), and the other with data from the Czechia reported 13.3% of 30 isolates resistant (Nedbalcová et al., 2017). Three studies reported data for erythromycin with resistance proportions ranging from 1.8% to 50%. Although the two extremes are both from China (Zhou et al., 2010; Xu et al., 2011), it is difficult to compare these proportions objectively, as there are no erythromycin breakpoints for G. parasuis or related species, and it is unclear if the same breakpoints were used by the two studies.
For the beta‐lactams, full susceptibility was reported to those drugs that are not affected by narrow‐spectrum beta‐lactamases, namely ceftiofur and amoxicillin‐clavulanic acid. Higher proportions of resistance were observed for aminopenicillins and penicillin with the highest levels of up to 30% observed in two Chinese studies (Xu et al., 2011; Zhang et al., 2014) – again with the reservation of unclear breakpoints.
By far the highest levels of resistance to fluoroquinolones (45–71%) were observed in 4 Chinese studies. This suggests a geographical trend, but also for the drug tested here (enrofloxacin) the interpretation of AST data was unclear. Particularly strange was that two studies (Zhang et al., 2013; Zhao et al., 2018) referred to a human CLSI guideline, which would not have any breakpoints for a veterinary drug like enrofloxacin.
The 4 studies testing susceptibility to florfenicol reported no resistance among the isolates tested. This included two Chinese studies, although 4.5% of isolates in one of them were intermediate (Xu et al., 2011).
For tetracycline, one Chinese study reported only 3.6% resistance (Zhou et al., 2010). Figure 27 indicates that even lower levels of resistance to tetracycline were detected in a Brazilian study (Serpa et al., 2020) and in a study on isolates from several European countries (El Garch et al., 2016). Importantly, the latter two studies would have had proportions of 57.1% and 47.7% if %R+I had been reported instead of %R. This illustrates the complexity of comparing data from studies reporting resistance in different ways, and again underlines that the red and blue open circles of the figures in this report are not directly comparable.
No CLSI breakpoints exist for sulfonamide–trimethoprim combinations in Pasteurellaceae; therefore, it is also complicated to interpret data for this drug.
Table 8. Weighted arithmetic mean, minimum and maximum proportion of resistance (%R or %R + I) and weighted standard deviation (SD) in G. parasuis for the target antimicrobials in each continent included in the studies. NA means that SD cannot be calculated as only one study is included
| Antibiotic | Continent | No. of papers | N (number of isolates) | Weighted arithmetic mean proportion of resistance (%) | Minimum resistance % observed | Maximum resistance % observed | Weighted standard deviation |
|---|---|---|---|---|---|---|---|
| Aminopenicillins | Asia | 3 | 332 | 19.5 | 9.1 | 25.8 | 7.4 |
| Aminopenicillins | Europe | 1 | 30 | 0.1 | 0.1 | 0.1 | NA |
| Aminopenicillins | S. America | 1 | 18 | 0 | 0 | 0 | NA |
| Amox/Clav | Europe | 1 | 68 | 0 | 0 | 0 | NA |
| Cefazolin | Asia | 1 | 110 | 13.6 | 13.6 | 13.6 | NA |
| Ceftiofur | Asia | 1 | 110 | 0 | 0 | 0 | NA |
| Ceftiofur | Europe | 2 | 98 | 0 | 0 | 0 | 0 |
| Ceftiofur | S. America | 1 | 18 | 0 | 0 | 0 | NA |
| Erythromycin | Asia | 2 | 222 | 15.8 | 1.8 | 29.5 | 13.9 |
| Erythromycin | S. America | 1 | 18 | 5.9 | 5.9 | 5.9 | NA |
| Florfenicol | Asia | 2 | 222 | 0 | 0 | 0 | 0 |
| Florfenicol | Europe | 1 | 68 | 0 | 0 | 0 | NA |
| Florfenicol | S. America | 1 | 18 | 0 | 0 | 0 | NA |
| Fluoroquinolones | Asia | 4 | 503 | 58 | 45.5 | 70.9 | 8.6 |
| Fluoroquinolones | Europe | 2 | 98 | 5.1 | 0 | 16.7 | 7.7 |
| Fluoroquinolones | S. America | 1 | 18 | 11.1 | 11.1 | 11.1 | NA |
| Penicillin | Asia | 3 | 332 | 22 | 6.4 | 30 | 11 |
| Penicillin | Europe | 1 | 30 | 20 | 20 | 20 | NA |
| Penicillin | S. America | 1 | 18 | 5.6 | 5.6 | 5.6 | NA |
| Sulfa/TMP | Asia | 2 | 222 | 51.3 | 44.5 | 58 | 6.8 |
| Sulfa/TMP | Europe | 1 | 68 | 2.9 | 2.9 | 2.9 | NA |
| Sulfa/TMP | S. America | 1 | 18 | 0 | 0 | 0 | NA |
| Sulfonamides | Asia | 1 | 110 | 100 | 100 | 100 | NA |
| Tetracyclines | Asia | 3 | 332 | 21.1 | 3.6 | 41.1 | 15.5 |
| Tetracyclines | Europe | 2 | 98 | 23.4 | 2.9 | 70 | 31.1 |
| Tetracyclines | S. America | 1 | 18 | 0 | 0 | 0 | NA |
| Tiamulin | Europe | 1 | 68 | 0 | 0 | 0 | NA |
| Tulathromycin | Europe | 2 | 98 | 4.1 | 0 | 13.3 | 6.2 |
3.1.8. Bordetella bronchiseptica
3.1.8.1. Results of the ELR by bacterium
Bordetella bronchiseptica is a commensal of the upper respiratory tract. Toxigenic strains may cause turbinate hypoplasia in piglets, but the more severe signs of atrophic rhinitis (wrinkled and shortened snout, epistaxis, etc.) usually require the simultaneous presence of toxigenic P. multocida.
In total, six studies with ≥ 10 B. bronchiseptica isolates and results for one or more of the relevant antibiotics (ampicillin/amoxicillin, enrofloxacin/ciprofloxacin, penicillin, sulfonamide‐trimethoprim, tetracyclines, tildipirosin, tulathromycin) were included. Those studies were distributed as follows: Africa (0), Asia (1), Europe (3), Oceania (1), North America (1) and South America (0). Among these, zero, one, three, one, one and zero studies included isolates from Africa, Asia, Europe, Oceania, North America and South America, respectively.
The distribution of B. bronchiseptica isolates per site of infection is shown in Figure 28. Most isolates originated from respiratory infections.
Figure 28.
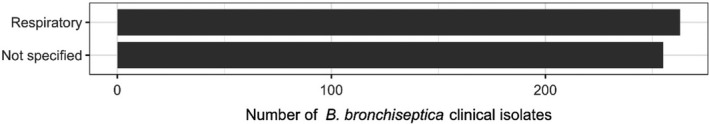
Distribution of B. bronchiseptica isolates per site of infection
Figure 29 shows for each country the proportion of resistance reported in individual studies with at least 10 B. bronchiseptica isolates.
Figure 29.
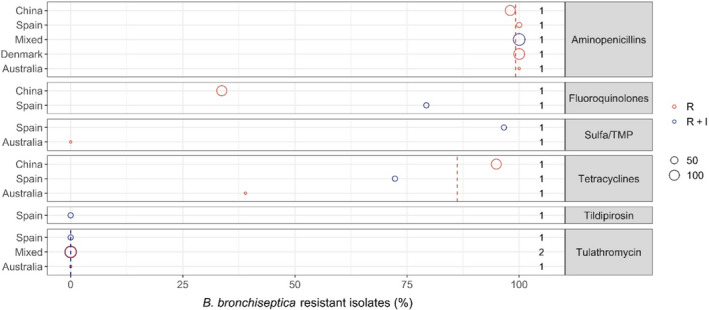
- Each circle represents one study, and the size of each circle reflects how many isolates were included in the study. The colour of a circle illustrates resistance only (red circle) or resistance merged with intermediate (blue circle). The dashed lines indicate, for each antibiotic, the weighted arithmetic mean of %R (red dashed line) or %R + I (blue dashed line). The exact percentages these lines represent are listed in Annex V. Numbers written to the left of the antibiotic names reflect the number of studies for a certain drug/country combination.
Among the clinically relevant antibiotics, macrolides appear to be most frequently efficient against B. bronchiseptica. The three studies reporting data on tulathromycin showed full susceptibility to this drug, except for 0.8% of isolates in the study by El Garch et al. (2016) being intermediate. Full susceptibility was also observed for tildipirosin in the study by Vilaro et al. (2020).
High or very high levels of resistance were observed for tetracyclines. In that regard, there are no internationally recognised veterinary tetracycline breakpoints for B. bronchiseptica, and data from the three studies reporting data for these compounds are likely to be not comparable. For example, Dayao et al. (2014) adapted the tetracycline breakpoint of A. pleuropneumoniae and P. multocida (R ≥ 2 mg/L), whereas Vilaro et al. (2020) appeared to do the same. However, a closer look at the latter study shows that they tested doxycycline instead of tetracycline. Also, they report isolates below the clinical breakpoint as susceptible, but in fact isolates equal to the clinical breakpoint should also be considered susceptible according to CLSI (S ≤ 0.5 mg/L). For the third study (Zhao et al., 2011), it was not clear exactly which breakpoint had been used for testing susceptibility to tetracycline, except that it was from the M31‐A2 CLSI veterinary guide.
As for tetracyclines, there are no veterinary breakpoints for fluoroquinolones and sulfonamide–trimethoprim against B. bronchiseptica. This creates some of the same problems for interpretation of data, e.g. Zhao et al. (2011) and Vilaro et al. (2020) appeared to adapt enrofloxacin breakpoints from other porcine pathogens. Figure 29 indicates a large difference in the percentage of enrofloxacin resistance recorded for these studies, but results are very similar if the intermediate category is taken into account – in fact, %R + I is higher for the Chinese study (85.7%) than for the Spanish one (79.3%), in contrast with the result when %R for the Chinese study is considered as in Figure 14 (see Appendix B for details). Again, this emphasises the problem of comparing % R with % R + I for some drug/bug combinations.
Five studies tested the susceptibility of B. bronchiseptica to aminopenicillins, and all of them reported all – or nearly all – isolates as resistant to this drug. This shows what may be considered intrinsic resistance and that these drugs are not useful for empiric treatment of B. bronchiseptica infections in pigs. The same is true for narrow‐spectrum penicillins, as the resistance is due to the presence of beta‐lactamases.
Table 9. Weighted arithmetic mean, minimum and maximum proportion of resistance (%R or %R + I) and weighted standard deviation (SD) in B. bronchiseptica for the target antimicrobials in each continent included in the studies. NA means that SD cannot be calculated as only one study is included
| Antibiotic | Continent | No. of papers | N (number of isolates) | Weighted arithmetic mean proportion of resistance (%) | Minimum resistance % observed | Maximum resistance % observed | Weighted standard deviation |
|---|---|---|---|---|---|---|---|
| Aminopenicillins | Asia | 1 | 98 | 98 | 98 | 98 | NA |
| Aminopenicillins | Europe | 2 | 145 | 100 | 100 | 100 | 0 |
| Aminopenicillins | N. America | 1 | 139 | 100 | 100 | 100 | NA |
| Aminopenicillins | Oceania | 1 | 18 | 100 | 100 | 100 | NA |
| Fluoroquinolones | Asia | 1 | 98 | 33.7 | 33.7 | 33.7 | NA |
| Fluoroquinolones | Europe | 1 | 29 | 79.3 | 79.3 | 79.3 | NA |
| Sulfa/TMP | Europe | 1 | 29 | 96.6 | 96.6 | 96.6 | NA |
| Sulfa/TMP | Oceania | 1 | 18 | 0 | 0 | 0 | NA |
| Tetracyclines | Asia | 1 | 98 | 94.9 | 94.9 | 94.9 | NA |
| Tetracyclines | Europe | 1 | 29 | 72.3 | 72.3 | 72.3 | NA |
| Tetracyclines | Oceania | 1 | 18 | 39 | 39 | 39 | NA |
| Tildipirosin | Europe | 1 | 29 | 0 | 0 | 0 | NA |
| Tulathromycin | Europe | 2 | 147 | 0 | 0 | 0 | 0 |
| Tulathromycin | N. America | 1 | 139 | 0 | 0 | 0 | NA |
| Tulathromycin | Oceania | 1 | 18 | 0 | 0 | 0 | NA |
3.1.8.2. Results from the national AMR surveillance reports
GERM‐Vet (Germany)
For B. bronchiseptica in 2014 76, in 2015 90 and in 2017 75 isolates were tested. In all years ampicillin resistance was stated as 100%, resistance against florfenicol was 2,4% in 2014, 14,4 % in 2015 and 4% in 2017 intermediate resistance was much higher with 60,6% in 2014, 77,8% in 2015 and 80% in 2017. No tulathromycin resistant isolates were reported in GERM‐Vet 2014, 2015 and 2017.
3.1.9. Staphylococcus aureus and Staphylococcus hyicus
3.1.9.1. Results of the ELR by bacterium
Staphylococci are opportunistic pathogens of the skin and mucosal membranes. In pigs, S. hyicus is known as an important pathogen causing exudative epidermitis in piglets up to 3 months of age. The infection causes a greasy skin along with anorexia and fever and depression, and it is often associated with high morbidity and mortality rates. S. aureus is less specific and may cause a variety of different infections in pigs.
In total, three studies with ≥ 10 S. hyicus or S. aureus isolates and results for one or more of the relevant antibiotics (ampicillin/amoxicillin, ceftiofur, lincomycin, oxacillin, penicillin, sulfonamide‐trimethoprim, tiamulin) were included. These studies comprised isolates from Canada, Denmark and Germany, respectively.
The distribution of Staphylococcus spp. isolates per site of infection is shown in Figure 30. Most isolates originated from skin and soft tissue infections.
Figure 30.
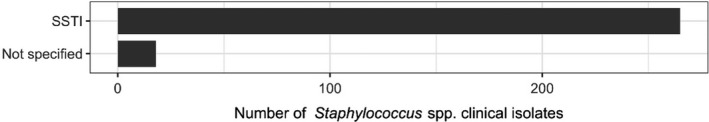
Distribution of Staphylococcus isolates per site of infection
Figure 31 shows for each country the proportion of resistance reported in individual studies with at least 10 S. hyicus or S. aureus isolates.
Figure 31.
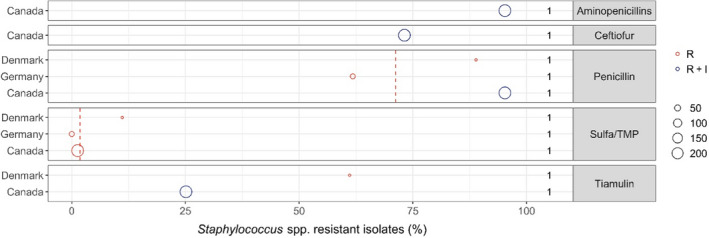
- Each circle represents one study, and the size of each circle reflects how many isolates were included in the study. The colour of a circle illustrates resistance only (red circle) or resistance merged with intermediate (blue circle). The red dashed lines indicate, for each antibiotic, the weighted arithmetic mean of %R. The exact percentages these lines represent are listed in Appendix E. Numbers written to the left of the antibiotic names reflect the number of studies for a certain drug/country combination.
Merging data for two staphylococcal species was carried out here for convenience due to the limited number of studies. The only study reporting data for S. aureus was Park et al. (2013), and for most drugs proportions of resistance were similar to what the same study reported for S. hyicus. The only exception was tiamulin for which a higher level of resistance was shown in S. hyicus than S. aureus (31% vs. 15%).
Among the clinically relevant drugs, sulfonamide–trimethoprim appeared as the better option against staphylococcal infections in pigs with either full susceptibility or very small levels of resistance reported.
There are no CBP for tiamulin against staphylococci, so at least for the study by Park et al. (2013) it is unclear how data were interpreted for this drug using the CLSI veterinary guideline. Holmer et al. (2019) used a EUCAST ECOFF for interpretation, but it is likely this ECOFF has been updated since (currently 2 mg/L but reported by Holmer et al. (2019) as 16 mg/L).
The high levels (> 60%) of aminopenicillin and penicillin resistance were expected, as most staphylococci have the blaZ beta‐lactamase gene. The similarly high level of ceftiofur resistance reported by Park et al. (2013) suggests widespread presence of methicillin resistance. Ceftiofur is however not the best indicator of methicillin resistance, and furthermore, the only ceftiofur CLSI clinical breakpoint for this drug in staphylococci is for bovine mastitis. Therefore, confirmation of methicillin resistance in S. aureus and S. hyicus would warrant further investigation by other methods.
Table 10. Weighted arithmetic mean, minimum and maximum proportion of resistance (%R or %R + I) and weighted standard deviation (SD) in staphylococci for the target antimicrobials in each continent included in the studies. NA means that SD cannot be calculated as only one study is included
| Antibiotic | Continent | No. of papers | N (number of isolates) | Weighted arithmetic mean proportion of resistance (%) | Minimum resistance % observed | Maximum resistance % observed | Weighted standard deviation |
|---|---|---|---|---|---|---|---|
| Aminopenicillins | N. America | 1 | 231 | 95.2 | 95.2 | 95.2 | NA |
| Ceftiofur | N. America | 1 | 231 | 73.1 | 73.1 | 73.1 | NA |
| Penicillin | Europe | 2 | 52 | 71.2 | 61.8 | 88.9 | 13 |
| Penicillin | N. America | 1 | 231 | 95.2 | 95.2 | 95.2 | NA |
| Sulfa/TMP | Europe | 2 | 52 | 3.8 | 0 | 11.1 | 5.3 |
| Sulfa/TMP | N. America | 1 | 231 | 1.3 | 1.3 | 1.3 | NA |
| Tiamulin | Europe | 1 | 18 | 61.1 | 61.1 | 61.1 | NA |
| Tiamulin | N. America | 1 | 231 | 25.1 | 25.1 | 25.1 | NA |
3.1.10. Brachyspira hyodysenteriae
3.1.10.1. Results of the ELR by bacterium
Brachyspira hyodysenteriae can be present in the intestine of both clinically healthy and diseased pigs. Healthy carriers may shed the bacterium for several months and in this way spread it to more susceptible individuals. The bacterium causes dysentery in pigs from 6 to 12 weeks of age.
In total, three studies with ≥ 10 B. hyodysenteriae isolates and results for one or more of the relevant antibiotics (erythromycin, lincomycin, tetracyclines, tiamulin, tylosin, tylvalosin and valnemulin were included. These studies comprised isolates from Belgium, Italy and Sweden, respectively.
The distribution of B. hyodysenteriae isolates per site of infection is shown in Figure 32. All isolates originated from gastrointestinal infections.
Figure 32.
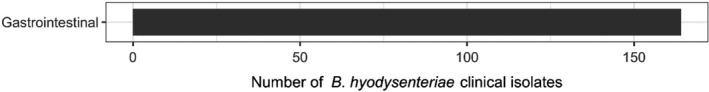
Distribution of B. hyodysenteriae isolates per site of infection
Figure 33 shows for each country the proportion of resistance reported in individual studies with at least 10 B. hyodysenteriae isolates.
Figure 33.
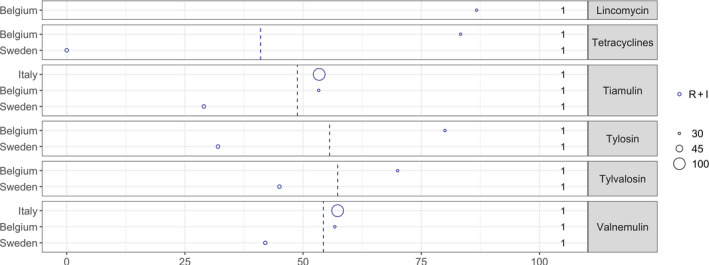
Brachyspira hyodysenteriae resistance data for each included study sorted by country
Each circle represents one study, and the size of each circle reflects how many isolates were included in the study. The blue circle illustrates resistance merged with intermediate. The blue dashed lines indicate, for each antibiotic, the weighted arithmetic mean of %R+I. The exact percentages these lines represent are listed in Appendix E. Numbers written to the left of antibiotic names reflect the number of studies for a certain drug/country combination. Only data interpreted according to the ECOFFs proposed by Pringle et al. (2012) are included.
There are no internationally recognised CBP for B. hyodysenteriae, yet several different ways of interpreting susceptibility data were encountered during the literature search. For the sake of comparability, only data interpreted according to the ECOFFs proposed by Pringle et al. (2012) were included here. Isolates above the ECOFF are known as non‐wild‐type, but for simplicity they are referred to as resistant in the following.
Overall, fairly high levels of resistance were observed in B. hyodysenteriae, the only exception being the full susceptibility to doxycycline reported among 31 isolates in Sweden (Swedres‐Svarm, 2019).
For the macrolides tylosin and tylvalosin, resistance varied from 32% to 80%, and for the pleuromutilins tiamulin and valnemulin resistance levels were slightly lower ranging from 29% to 77%. In all cases, the lower levels were reported in Sweden (Swedres‐Svarm, 2019), whereas the higher levels were reported in Italy (Rugna et al., 2015) and Belgium (Mahu et al., 2017).
The overall highest proportion of resistance (87%) was observed in the Belgian isolates for lincomycin.
Table 11. Weighted arithmetic mean, minimum and maximum proportion of resistance and weighted SD in B. hyodysenteriae for the target antimicrobials in each continent included in the studies. NA means that standard deviation (SD) cannot be calculated as only one study is included. Only data interpreted according to the ECOFFs proposed by Pringle et al. (2012) are included
| Antibiotic | Continent | No. of papers | N (number of isolates) | Weighted arithmetic mean proportion of resistance (%) | Minimum resistance % observed | Maximum resistance % observed | Weighted standard deviation |
|---|---|---|---|---|---|---|---|
| Lincomycin | Europe | 1 | 30 | 86.7 | 86.7 | 86.7 | NA |
| Tetracyclines | Europe | 2 | 61 | 41 | 0 | 83.3 | 42 |
| Tiamulin | Europe | 3 | 164 | 48.8 | 29 | 53.4 | 9.6 |
| Tylosin | Europe | 2 | 61 | 55.6 | 32 | 80 | 24.2 |
| Tylvalosin | Europe | 2 | 61 | 57.3 | 45 | 70 | 12.6 |
| Valnemulin | Europe | 3 | 164 | 54.3 | 42 | 57.3 | 6 |
3.1.10.2. Results from the national AMR surveillance reports
SWEDRES‐Svarm (Sweden)
For B. hyodysenteriae, MIC values from isolates retrieved from faecal samples (one isolate per herd each year) for five antimicrobials of interest for this opinion are provided aggregated for the period 2016–2018 (31 isolates), and classified as non‐wild type (resistant) according to the cut‐off proposed by Pringle et al. (2012). These data are already provided in Figure 18 (data from Sweden) and indicated that the proportion of antimicrobial resistant isolates was between 29 and 45% for all antimicrobials (tiamulin, tylosin, tylvalosin and valnemulin) except for doxycycline for which no resistant isolates were reported.
3.1.11. Trueperella (Arcanobacterium) pyogenes
3.1.11.1. Results of the ELR by bacterium
Trueperella pyogenes (previously named A. pyogenes) resides in mucous membranes and is an opportunistic pathogen of many domestic animal species including pigs. It may cause a variety of suppurative infections such as osteomyelitis, abscessation, lymphadenitis, etc.
Only one eligible study with ≥ 10 T. pyogenes isolates was included (Galán‐Relaño et al., 2019). The study comprised 180 isolates obtained in Spain from various slaughterhouse samples with macroscopic lesions of infection. Most isolates (98.3%) were resistant to sulfonamide‐trimethoprim, whereas for penicillin only 2.2% of isolates were resistant. Interpretation of MIC data was carried out according to the tentative, non‐validated breakpoints suggested by CLSI in the Vet06 document (CLSI, 2017).
3.1.12. Erysipelothrix rhusiopathiae
3.1.12.1. Results of the ELR by bacterium
Erysipelothrix rhusiopathiae is carried by up to approximately one‐half of healthy pigs in tonsillar tissue and is shed in various secretions and faeces. It causes swine erysipelas, which can present in different forms and cause septicaemia, characteristic diamond‐shaped erythematous skin lesions, arthritis and endocarditis. Pigs are typically susceptible to infection after weaning with the cessation of maternal antibodies through milk.
One eligible study with ≥ 10 E. rhusiopathiae isolates was included (UK‐VARSS, 2019). This British surveillance report comprised only 11 isolates collected from infections of pigs in England and Wales. All isolates were susceptible to ampicillin, tylosin and lincomycin, whereas two and four isolates were resistant to sulfonamide‐trimethoprim and tetracycline, respectively. The low number of isolates in just one study obviously hampers any good interpretation and extrapolation of data.
3.1.12.2. Results from the national AMR surveillance reports
UK‐VARSS (United Kingdom)
Finally, for E. rhusiopathiae, resistance to five antimicrobials of interest for this opinion were determined in between 3 and 18 isolates during the 2015–2019 period (for a total of 44 isolates tested throughout all years). No resistance to ampicillin, enrofloxacin, lincomycin or tylosin was found in this very small collection of isolates, while 30% and 39% of all isolates were resistant to tetracycline and sulfonamides/trimethoprim respectively. As the UK‐VARSS report was in fact the only source of evidence for resistance in E. rhusiopathiae clinical isolates in the ELR, there are no other values to compare with.
3.2. ToR 2: identifying the most relevant bacteria in the EU
Following the methodology presented in the scientific opinion on the ad hoc method for the assessment of animal diseases caused by bacteria resistant to antimicrobials within the AHL framework (EFSA AHAW Panel, 2021), the evidence available was assessed individually by all working group members who provided individual judgements on the perceived relevance to swine of the antimicrobial‐resistant bacteria included in the list.
After discussion of the individual judgements for each bacterium (relevant/non‐relevant/cannot be assessed based on available evidence), it was agreed with > 66% certainty that the most relevant antimicrobial resistant bacteria in swine for the EU were E. coli and B. hyodysenteriae (Figure 34). Both bacterial species were identified as very relevant and frequently reported pathogens in swine. For E. coli, high resistance levels to several antimicrobials frequently used to treat diseases due to this bacterium in Europe were found, often involving multidrug resistant phenotypes (e.g. ESBL‐producing E. coli). Its importance is further emphasised by the large number of studies (Table 4) and AST results for the antimicrobials of interest retrieved through the ELR, and their inclusion in all the national monitoring programmes reporting data on AMR from swine clinical isolates (Table 3).
Figure 34.
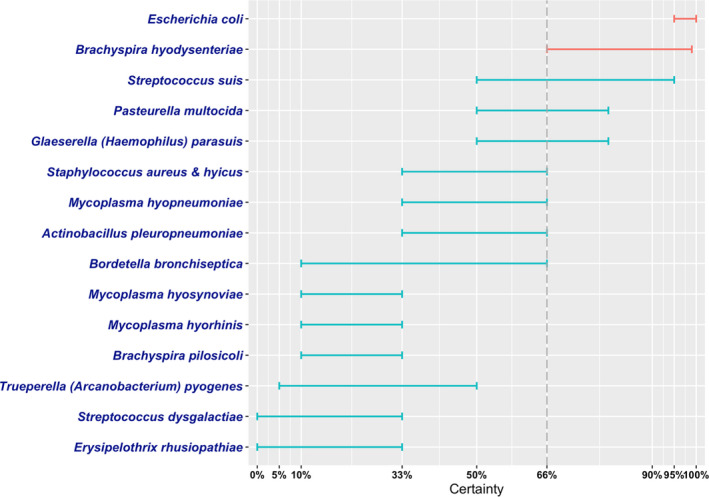
Level of certainty for the inclusion of the selected antimicrobial resistant pathogens of swine among the most relevant in the EU
Brachyspira hyodysenteriae was also selected as one of the most relevant resistant bacteria for the EU in spite of the much more limited evidence in terms of AMR frequency. This was due to the perceived importance of use of antimicrobials to control B. hyodysenteriae infections (no vaccines currently available in spite of its importance), coupled with the limited number of antibiotics licensed for use to control Brachyspira infections in pigs (Hampson et al., 2019). The absence of quantitative data demonstrating that the prevalence of infection due to resistant B. hyodysenteriae isolates is definitely associated with the difficulties in performing AST in fastidious bacteria such as members of the Brachyspira genus, and the lack of CLSI or EUCAST standardised methods for this pathogen, which has resulted in the absence of internationally recognised clinical breakpoints to define resistance for this pathogen. In this review, only studies using the cut‐off to differentiate non‐wild type strains proposed by Pringle et al. (2012) after the analysis of isolates retrieved in Sweden over a 20 year between 1990 and 2010 were analysed in an attempt to allow meaningful comparisons, what resulted in only three studies being included reporting data from Sweden, Belgium and Italy (Table 3), all of which reported a high proportion of ‘resistant’ (i.e. non‐wild type) isolates. This is in line with other studies based on the assessment of changes on MIC values, which also described reduced susceptibility (often to multiple antimicrobials) in clinical isolates from e.g. Spain and the Czech Republic (Hidalgo et al., 2011; Šperling et al., 2011) thus suggesting that this is a problem occurring in several European countries. Moreover, an assessment of changes in MICs to several antimicrobials used as therapeutic options against B. hyodysenteriae infections over time suggests that values have in fact increased in the last decades (Hampson et al., 2019). Nevertheless, the limited amount of hard data quantifying the proportion of resistant isolates circulating in swine farms (particularly outside Europe) led to a higher degree of uncertainty regarding its inclusion among the most relevant swine resistant bacteria (66–99% compared with 95–100% for E. coli).
Streptococcus suis was not included among the selected most relevant resistant bacteria for the EU in spite of its clinical importance in swine and the evidence retrieved suggesting that resistance to several antimicrobial classes (e.g. tetracyclines and potentiated sulfonamides) was not uncommon (and the large number of studies and AST results retrieved through the ELR, further suggesting its relevance as a pathogen and the importance of assessing its resistance phenotype). This was due to consistent evidence (both from the ELR and from the national control programmes) indicating that resistance to the first therapeutic options (penicillins/aminopenicillins) was very uncommon even though these are widely used in swine, resulting in a lower certainty regarding its inclusion among the most relevant bacteria for the EU.
For P. multocida and G. parasuis the evidence available was more limited, and even though several studies showed that resistance to certain antimicrobials could be found, overall the certainty regarding their inclusion among the most relevant resistant bacteria for the EU was lower given their more limited clinical impact and that first line therapeutic options to treat infection are still available in the majority of cases.
The consensus judgement on the EU relevance of resistant M. hyopneumoniae, S. aureus and S. hyicus and A. pleuropneumoniae was lower. Mycoplasma hyopneumoniae is an important swine pathogen whose presence can result in increased antimicrobial use in a farm, but there are limited data characterising the frequency of resistant strains (partly due to technical difficulties associated with the in‐vitro growth of this microorganism) and the role of AMR in treatment failures is not well determined. Similarly, although S. aureus can cause significant problems in farms – often associated with joint infections that are difficult to treat – therapeutic failures can be due to difficulties reaching suitable concentrations (rather than to AMR of the clinical strains), and very few data in the ELR were found. Finally, A. pleuropneumoniae is one of the top respiratory pathogens in swine, but consistent evidence suggesting that resistance was uncommon was found both through the ELR and the data in the national monitoring programmes.
The remaining pathogens had a more limited clinical relevance and fewer data were available and/or data found suggested resistance potentially leading to therapeutic failures was uncommon, therefore resulting in narrower and lower certainties for their inclusion among the most relevant resistant bacteria for the EU (Figure 34).
4. Conclusions
In this opinion, EFSA presents the results of the assessment conducted to answer ToR 1 (global state of play of antimicrobial‐resistant animal bacteria) and the first part of ToR 2 (identifying the most relevant resistant bacteria in the EU) according to the ad hoc methodology (EFSA AHAW Panel, 2021). The second part of ToR 2 and ToR 3, namely the animal health impact of the selected species on swine in the EU, and their eligibility for being listed and categorised in the framework of the AHL, will be assessed in the next step of this EFSA project.
The scientific assessment of the global state of play of the resistant bacterial pathogens of swine included in this opinion and of their EU relevance is hampered by several important sources of uncertainty derived from the available data and the methodology followed in this assessment, as mentioned in Section 2.4 of EFSA AHAW Panel (2021) and in the preceding sections of this opinion:
Due to the scope of the ELR, only studies published in the last 10 years and in English were considered eligible (except for the GERM‐VET report, originally in German), therefore introducing a possible selection bias.
Information on the rationale and study design for the references retrieved in the ELR was limited and very heterogeneous, making the detailed assessment of the representativeness of the isolates included in each study very difficult. For example, approximately 45% of the references (33/77) included isolates collected through the regular testing of veterinary diagnostic laboratories for which typically very limited information on representativeness is available. Moreover, they often originated from animals subjected to previous antimicrobial treatments, which may lead to higher levels of resistance in tested isolates. Furthermore, several of the bacterial species included here can also be found in healthy animals (e.g. E. coli, S. suis). Therefore, even if they originated from diseased animals, they may not be the causative agent in a proportion of cases that cannot be quantified.
Even though only studies exceeding a minimum quality threshold were included (e.g. use of international or national standards) the methodology used was also diverse (e.g. use of disk diffusion or microdilution methods, CBP or ECOFFs, consideration or not of the intermediate category, etc.). Therefore, descriptive statistics provided here (average proportion of resistant isolates for bacterium, country and antimicrobial) should be considered carefully as they may not be representative of the true underlying situation, particularly in cases in which the sample size was small.
AMR data referring to one or more of the bacterial pathogens of interest were retrieved from six national AMR monitoring reports. However, comparison of data reported in the different countries is difficult due to differences in: (a) the bacterial species considered, (b) the geographical and temporal coverage of each report, (c) the choice of antimicrobials included in the panel for AST, (d) the methods for antimicrobial susceptibility determination (disk diffusion vs. broth microdilution, CBPs vs. ECOFFs) and (e) the limited sample sizes achieved and the potential biases associated with the process by which the panels of isolates were built.
EFSA has summarised the global state of play on AMR in swine for the following bacteria: E. coli, S. suis, A. pleuropneumoniae, P. multocida, G. parasuis, B. bronchiseptica, S. aureus, S. hyicus, B. hyodysenteriae, T. pyogenes, E. rhusiopathiae, S. dysgalactiae, M. hyosynoviae, M. hyorhinis, M. hyopneumoniae and B. pilosicoli.
Among those bacteria, based on the evidence available and expert opinion, EFSA identified E. coli and B. hyodysenteriae as the most relevant antimicrobial‐resistant swine pathogens in the EU with > 66% certainty.
Several major data gaps were identified, derived mainly from the lack of information from many countries in the world (and to a lesser extent from some regions in Europe), the insufficient information on the origins of the bacterial isolates tested (which could result in unknown selection biases) and the variety of antimicrobials, methodologies and breakpoints used to generate the data considered in this assessment.
The impact of the uncertainties deriving from these data gaps on the scientific assessment was incorporated into the results through expert opinion.
5. Recommendation
Data on AMR in bacterial pathogens are necessary to enhance animal health, promote the rational use of antimicrobials and identify specific therapeutic challenges attributable to AMR. The very wide ranges of AMR levels observed in pathogenic bacteria isolated from swine in the same region or country highlight the difficulties in obtaining reliable estimates from scientific publications, which are often based on susceptibility testing of specific (and often biased) isolate collections. Furthermore, there was very limited information from several selected species (B. hyodysenteriae and B. pilosicoli, M. hyopneumoniae, M. hyosynoviae and M. hyorhinis) due to the lack of standardised methods and technical challenges for AST associated with their fastidious nature, further hampering the assessment of the importance of antimicrobial resistant phenotypes in these species.
National monitoring systems for AMR in diseased pigs are only available in certain countries and there are limitations that hamper the comparability of data reported by different countries (Mader et al., 2021). Moreover, the few available national reports have limited geographical scope when considering the global situation, particularly outside Europe. Because of the very limited sample sizes it is difficult to extract definitive conclusions in terms of AMR levels in swine populations based on the EU national reports assessed in this opinion, although stable AMR trends were found for most pathogen–drug combinations and levels of resistance were in general low for most pathogen‐antimicrobial combinations. Although the significance of these observations should not be overinterpreted due to the above‐mentioned limitations, assuming that sampling and methodological biases are relatively constant over time for a given monitoring programme, these longitudinal data can be helpful to detect the potential emergence of new AMR phenotypes of clinical importance or changes in resistance proportions in pathogens of swine, and therefore help to guide antimicrobial stewardship. This may be particularly relevant for the case of S. suis, to ensure that clinical isolates remain susceptible to penicillins, and for A. pleuropneumoniae, P. multocida and G. parasuis, as these are all relevant swine pathogens frequently leading to clinical problems in farms and driving a significant amount of antimicrobial use in pig production.
In the future, standardisation and harmonisation of the methodology used by national surveillance programmes, including selection criteria for collecting bacterial isolates and performance of AST, or development of supra‐national monitoring systems, would allow more meaningful comparisons between countries (Mader et al., 2021). Alternatively, access to raw AST data generated by such programmes could enable analysis of data from different countries using the same interpretive criteria (CBPs or ECOFFs), and facilitating identification of geographical differences in the distribution of specific antimicrobial resistant phenotypes of clinical relevance.
Abbreviations
- 3GC
third generation cephalosporin
- AHL
animal health law
- AST
antimicrobial susceptibility testing
- CLSI
Clinical and Laboratory Standards Institute
- ECOFF
epidemiological cut‐off
- ELR
extensive literature review
- ESBL
extended‐spectrum beta‐lactamase
- ESC
extended‐spectrum cephalosporinase
- EUCAST
European Committee on Antimicrobial Susceptibility Testing
- I
intermediate
- MIC
minimum inhibitory concentration
- MR
methicillin resistance
- MRSA
methicillin‐resistant Staphylococcus aureus
- MRSP
methicillin‐resistant Staphylococcus pseudintermedius
- PCR
polymerase chain reaction
- R
resistant
- S
susceptible
- UTI
urinary tract infection
Appendix A – search strings applied
1.
PubMed :
Common search string “Antimicrobials”
((“antibiotic”[Title/Abstract] OR “antibiotics”[Title/Abstract] OR “antimicrobial”[Title/Abstract] OR “antimicrobials”[Title/Abstract] OR “Anti‐Bacterial Agents”[MeSH Terms:noexp]) AND (“resistan*”[Title/Abstract] OR “susceptib*”[Title/Abstract])) OR (“Microbial Sensitivity Tests”[MeSH Terms] OR “drug resistance, microbial”[MeSH Terms])
Host‐based strings:
“pig”[Title/Abstract] OR “pigs”[Title/Abstract] OR “Swine”[Title/Abstract] OR “porcine”[Title/Abstract] OR “Swine”[MeSH Terms]
“Bacterial species”
“Actinobacillus pleuropneumoniae”[MeSH Terms] OR “Actinobacillus suis”[MeSH Terms] OR “Haemophilus parasuis”[MeSH Terms] OR “Mycoplasma hyopneumoniae”[MeSH Terms] OR “Mycoplasma hyorhinis”[MeSH Terms] OR “Mycoplasma hyosynoviae”[MeSH Terms] OR “Staphylococcus hyicus”[MeSH Terms] OR “Escherichia coli”[MeSH Terms] OR “Corynebacterium pyogenes”[MeSH Terms] OR “Bordetella bronchiseptica”[MeSH Terms] OR “Brachyspira hyodysenteriae”[MeSH Terms] OR “Brachyspira pilosicoli”[Supplementary Concept] OR “Erysipelothrix”[MeSH Terms] OR “Lawsonia Bacteria”[MeSH Terms] OR “Pasteurella multocida”[MeSH Terms] OR “Streptococcus dysgalactiae”[Supplementary Concept] OR “Streptococcus suis”[MeSH Terms] OR “Actinobacillus pleuropneumoniae”[Title/Abstract] OR “Actinobacillus suis”[Title/Abstract] OR “Actinobaculum suis”[Title/Abstract] OR “Arcanobacterium pyogenes”[Title/Abstract] OR “Trueperella pyogenes”[Title/Abstract] OR “Haemophilus parasuis”[Title/Abstract] OR “Mycoplasma hyopneumoniae”[Title/Abstract] OR “Mycoplasma hyorhinis”[Title/Abstract] OR “Mycoplasma hyosynoviae”[Title/Abstract] OR “Mycoplasma suis”[Title/Abstract] OR “Staphylococcus hyicus”[Title/Abstract] OR “Escherichia coli”[Title/Abstract] OR “Corynebacterium pyogenes”[Title/Abstract] OR “Bordetella bronchiseptica”[Title/Abstract] OR “Brachyspira hyodysenteriae”[Title/Abstract] OR “Brachyspira pilosicoli”[Title/Abstract] OR “Chlamydia pecorum”[Title/Abstract] OR “Erysipelothrix rhusiopathiae”[Title/Abstract] OR “Lawsonia intracellularis”[Title/Abstract] OR “Pasteurella multocida”[Title/Abstract] OR “Streptococcus dysgalactiae”[Title/Abstract] OR “Streptococcus suis”[Title/Abstract]
Embase :
Common search string “Antimicrobials”
antibiotic resistance/ or exp antibiotic sensitivity/ or exp drug resistance/
susceptib*.mp. [mp=title, abstract, heading word, drug trade name, original title, device manufacturer, drug manufacturer, device trade name, keyword, floating subheading word, candidate term word]
resistan*.mp. [mp=title, abstract, heading word, drug trade name, original title, device manufacturer, drug manufacturer, device trade name, keyword, floating subheading word, candidate term word]
2 or 3
antibiotic.mp. [mp=title, abstract, heading word, drug trade name, original title, device manufacturer, drug manufacturer, device trade name, keyword, floating subheading word, candidate term word]
antibiotics.mp. [mp=title, abstract, heading word, drug trade name, original title, device manufacturer, drug manufacturer, device trade name, keyword, floating subheading word, candidate term word]
antimicrobial.mp. [mp=title, abstract, heading word, drug trade name, original title, device manufacturer, drug manufacturer, device trade name, keyword, floating subheading word, candidate term word]
antimicrobials.mp. [mp=title, abstract, heading word, drug trade name, original title, device manufacturer, drug manufacturer, device trade name, keyword, floating subheading word, candidate term word]
5 or 6 or 7 or 8
antibiotic agent/
10 or 9
11 and 4
12 or 1
Host‐based strings:
pig/
(pig or pigs or swine or porcine).mp. [mp=title, abstract, heading word, drug trade name, original title, device manufacturer, drug manufacturer, device trade name, keyword, floating subheading word, candidate term word]
1 or 2
‘Bacterial species’
Actinobacillus pleuropneumoniae/
Actinobacillus suis/
Trueperella pyogenes/
Haemophilus parasuis/
Mycoplasma hyopneumoniae/
Mycoplasma hyorhinis/
Mycoplasma hyosynoviae/
Mycoplasma suis/
Staphylococcus hyicus/
Escherichia coli/
bordetella bronchiseptica/
Brachyspira hyodysenteriae/
Brachyspira pilosicoli/
Chlamydia pecorum/
Erysipelothrix rhusiopathiae/
Desulfovibrionaceae infection/
Pasteurella multocida/
Streptococcus dysgalactiae/
Streptococcus suis/
(“Actinobacillus pleuropneumoniae” or “Actinobacillus suis” or “Actinobaculum suis” or “Arcanobacterium pyogenes” or “Trueperella pyogenes” or “Glässerella parasuis” or “Haemophilus parasuis” or “Mycoplasma hyopneumoniae” or “Mycoplasma hyorhinis” or “Mycoplasma hyosynoviae” or “Mycoplasma suis” or “Staphylococcus hyicus” or “Escherichia coli” or “Corynebacterium pyogenes” or “Bordetella bronchiseptica” or “Brachyspira hyodysenteriae” or “Brachyspira pilosicoli” or “Chlamydia pecorum” or “Erysipelothrix rhusiopathiae” or “Lawsonia intracellularis” or “Pasteurella multocida” or “Streptococcus dysgalactiae” or “Streptococcus suis”). mp. [mp = title, abstract, heading word, drug trade name, original title, device manufacturer, drug manufacturer, device trade name, keyword, floating subheading word, candidate term word]
1 or 2 or 3 or 4 or 5 or 6 or 7 or 8 or 9 or 10 or 11 or 12 or 13 or 14 or 15 or 16 or 17 or 18 or 19
20 or 21
Appendix B – Excel file with all the data extracted
1.
Information on all the full‐text studies that were assessed, including the reason for exclusion for those that were excluded at the full‐text screening and the data extracted from the included studies, can be consulted at https://doi.org/10.5281/zenodo.5106316.
Appendix C – Clinically relevant antibiotics for which data were extracted)
1.
| Bacterial species/group | Relevant resistance tested |
|---|---|
| Actinobacillus pleuropneumoniae | Ampicillin or AmoxicillinAmoxi‐clavCeftiofurCefazolinCephalothinEnrofloxacin or CiprofloxacinFlorfenicolFlumequineGamithromycinPenicillinSulfonamide‐trimethoprimSulfonamidesTetracyclines (oxy/doxy/chlor/tet)ThiamfenicolTiamulinTildipirosinTilmicosinTulathromycin |
| Bordetella bronchiseptica | Ampicillin or AmoxicillinEnrofloxacin or CiprofloxacinPenicillinSulfonamide‐trimethoprimTetracyclines (oxy/doxy/chlor/tet)TildipirosinTulathromycin |
| BRACHYSPIRAB. hyodysenteriaeB. pilosicoli | ErythromycinLincomycinTetracyclines (oxy/doxy/chlor/tet)TiamulinTylosinTylvalosinValnemulin |
| Erysipelothrix rhusiopathiae | Ampicillin or AmoxicillinLincomycinPenicillinSulfonamide‐trimethoprimTetracyclines (oxy/doxy/chlor/tet)Tylosin |
| E. coli(NB: important to make a note of which disease E. coli causes, e.g. post‐weaning diarrhoea, neonatal diarrhoea, oedema disease etc.) | Ampicillin or AmoxicillinAmoxicillin‐clavulanic acidApramycinThird generation cephalosporins (cefpodoxime, cefotaxime, ceftazidime or ceftriaxone or ceftiofur)ColistinEnrofloxacin or CiprofloxacinESBL/AmpC gene or result of ESBL double disk/synergy test: NO EXTRACTION BUT MAKE A NOTE THAT DATA ARE THEREGentamicinNeomycinParomomycinSpectinomycinSulfonamide‐trimethoprimSulfonamidesTetracyclines (oxy/doxy/chlor/tet)Thiamphenicol |
| Haemophilus (Glässerella) parasuis | Ampicillin or AmoxicillinAmoxi‐clavCefazolinCeftiofurCephalothinEnrofloxacin or CiprofloxacinErythromycinFlorfenicolPenicillinSulfonamide‐trimethoprimSulfonamideTetracyclines (oxy/doxy/chlor/tet)ThiamphenicolTiamulinTildipirosinTulathromycin |
| MYCOPLASMAM. hyorhinisM. hyosynoviaeM. hyopneumoniae | Ampicillin or AmoxicillinEnrofloxacin or CiprofloxacinErythromycinFlorfenicolGentamicinLincomycinPenicillinSpectinomycinSulfonamide‐trimethoprimTetracyclines (oxy/doxy/chlor/tet)TiamulinTilmicosinTulathromycinTylosinTylvalosinValnemulin |
| Pasteurella multocida | Ampicillin or AmoxicillinAmoxi‐clavCefazolinCeftiofurCephalothinColistinEnrofloxacin or CiprofloxacinErythromycinFlorfenicolPenicillinSulfonamide‐trimethoprimSulfonamideTetracyclines (oxy/doxy/chlor/tet)TildipirosinTilmicosinTulathromycinTylosin |
| STAPHYLOCOCCIS. aureusS. hyicus | Ampicillin or AmoxicillinCefoxitinCeftiofurLincomycinmecA geneOxacillinPenicillinSulfonamide‐trimethoprimTiamulin |
| STREPTOCOCCIS. suisS. dysgalactiae | Ampicillin or AmoxicillinCefazolinCeftiofurCephalothinFlorfenicolPenicillinSulfonamide‐trimethoprimSulfonamideTetracyclines (oxy/doxy/chlor/tet)TiamulinTylosin |
| Trueperella (Arcanobacterium) pyogenes | Ampicillin or AmoxicillinPenicillinSulfonamide‐trimethoprim |
Appendix D – Data on proportion of resistance, sorted by country
1.
The figures show for E. coli, A. pleuropneumoniae, S. suis and P. multocida, the available data on the proportion of resistance sorted by country. The total number of studies by country and antimicrobial is reported on the right side. Each circle represents one study and the size of each circle reflects how many isolates were included in the study. The colour of a circle illustrates whether the proportion represents resistance only (red circle) or resistance merged with intermediate (blue circle). The dashed lines indicate, for each antibiotic, the weighted arithmetic mean of % resistance, not taking into account the difference between %R and %R + I.
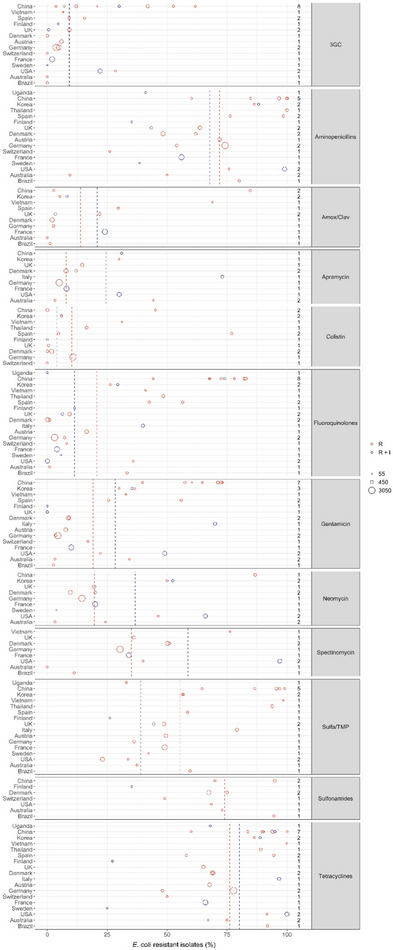
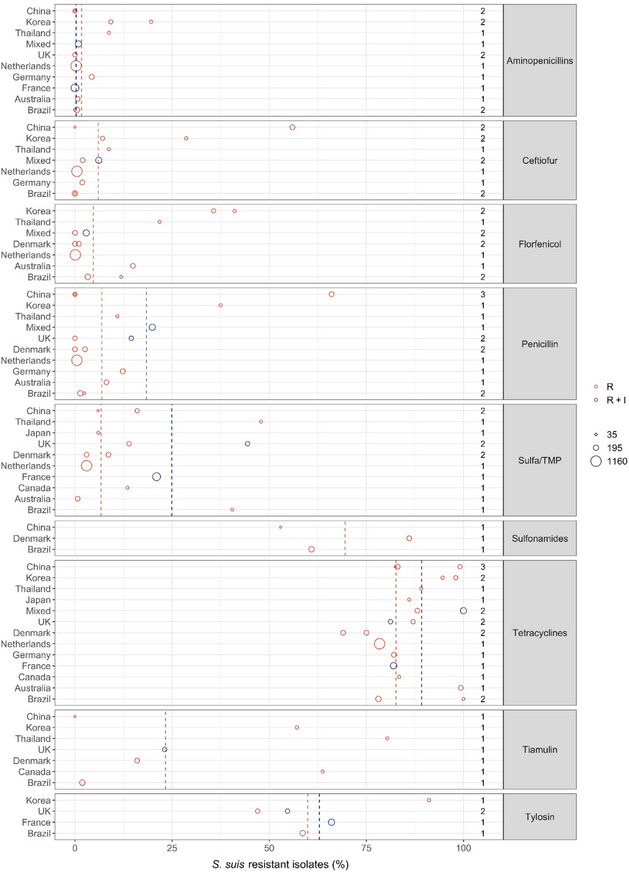
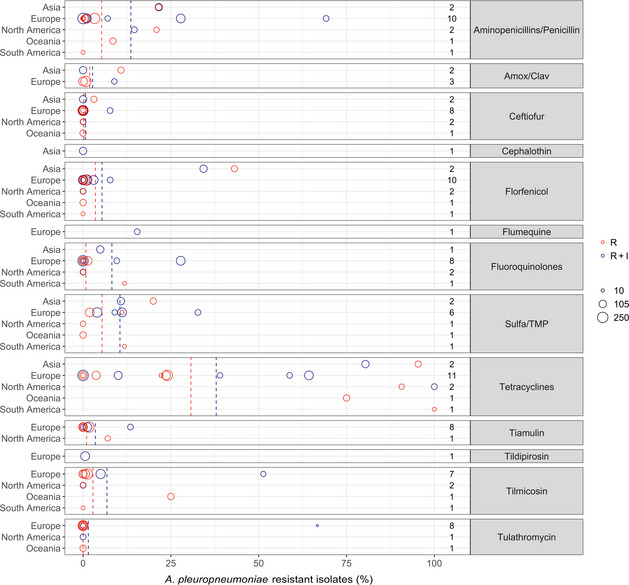
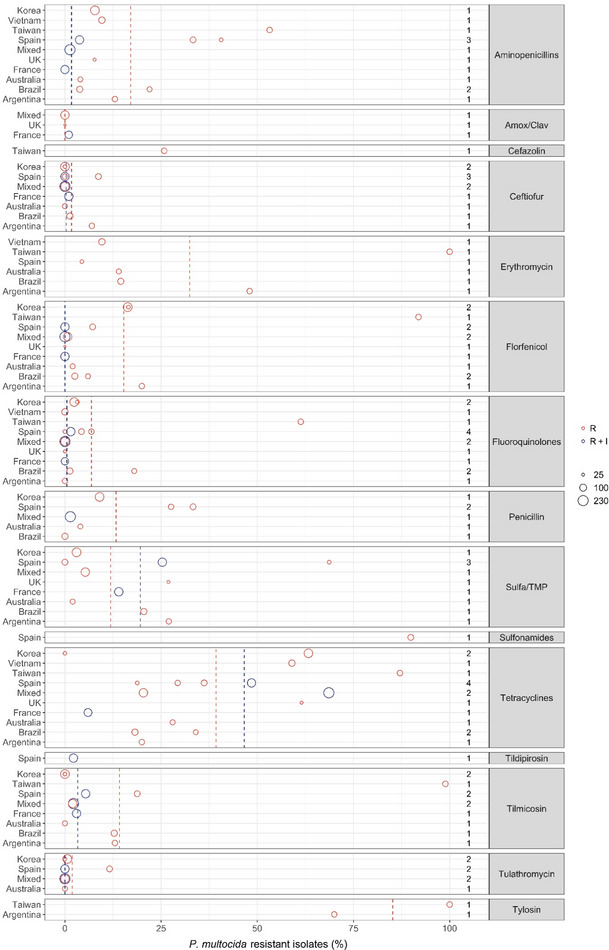
Appendix E – Exact percentages of weighted arithmetic means of %R and %R + I, respectively, displayed as dashed lines in figures
1.
| Bacterial species/genus | Antibiotic | How resistance is reported (%R or %R + I) | Weighted arithmetic mean proportion of resistance (%) | Maximum resistance % observed | Minimum resistance % observed | Weighted standard deviation |
|---|---|---|---|---|---|---|
| B. bronchiseptica | Aminopenicillins | R | 99.2 | 100 | 98 | 1 |
| Tetracyclines | R | 86.2 | 94.9 | 39 | 20.3 | |
| Tulathromycin | R | 0 | 0 | 0 | 0 | |
| Tulathromycin | R + I | 0 | 0 | 0 | 0 | |
| Tetracyclines | R + I | 41 | 83.3 | 0 | 42 | |
| Tiamulin | R + I | 48.8 | 53.4 | 29 | 9.6 | |
| Tylosin | R + I | 55.6 | 80 | 32 | 24.2 | |
| Tylvalosin | R + I | 57.3 | 70 | 45 | 12.6 | |
| Valnemulin | R + I | 54.3 | 57.3 | 42 | 6 | |
| E. coli | 3GC | R | 9.1 | 61.8 | 0 | 12.6 |
| 3GC | R + I | 9.2 | 30 | 0 | 10.3 | |
| Aminopenicillins | R | 71.8 | 100 | 9.4 | 17.3 | |
| Aminopenicillins | R + I | 67.7 | 99 | 35.2 | 21.6 | |
| Amox/Clav | R | 13.8 | 84.6 | 0 | 23.1 | |
| Amox/Clav | R + I | 20.8 | 24 | 3.4 | 7 | |
| Apramycin | R | 7.8 | 44.3 | 3.1 | 6.1 | |
| Apramycin | R + I | 24.4 | 73 | 8 | 21.7 | |
| Colistin | R | 10.2 | 76.9 | 0 | 13.9 | |
| Colistin | R + I | 3.9 | 5.9 | 0 | 2.8 | |
| Fluoroquinolones | R | 20.7 | 82.8 | 0.1 | 27.5 | |
| Fluoroquinolones | R + I | 11.3 | 74 | 0 | 18.2 | |
| Gentamicin | R | 19.1 | 73 | 2.6 | 23.8 | |
| Gentamicin | R + I | 28.3 | 70 | 0 | 23.6 | |
| Neomycin | R | 19.6 | 86.7 | 3.1 | 18 | |
| Neomycin | R + I | 36.7 | 66 | 3.8 | 21.9 | |
| Spectinomycin | R | 35.1 | 76.2 | 0 | 11.7 | |
| Spectinomycin | R + I | 58.7 | 97 | 34 | 30.8 | |
| Sulfa/TMP | R | 55.5 | 99 | 23 | 22.4 | |
| Sulfa/TMP | R + I | 38.9 | 44.4 | 26.1 | 8.4 | |
| Sulfonamides | R | 73.9 | 94.9 | 49 | 12.5 | |
| Tetracyclines | R | 76.1 | 100 | 48.1 | 11.2 | |
| Tetracyclines | R + I | 80.1 | 100 | 25 | 19.1 | |
| G. parasuis | Aminopenicillins | R | 20.3 | 25.8 | 0 | 9.5 |
| Ceftiofur | R | 0 | 0 | 0 | 0 | |
| Erythromycin | R | 26.2 | 29.5 | 5.9 | 8.2 | |
| Florfenicol | R | 0 | 0 | 0 | 0 | |
| Fluoroquinolones | R | 43.4 | 60.1 | 0 | 21.3 | |
| Penicillin | R | 27 | 30 | 5.6 | 6.5 | |
| Sulfa/TMP | R | 33.8 | 58 | 0 | 27.7 | |
| Tetracyclines | R | 26.3 | 70 | 0 | 20.3 | |
| Tulathromycin | R | 4.1 | 13.3 | 0 | 6.2 | |
| P. multocida | Aminopenicillins | R | 17.1 | 53.2 | 3.8 | 15.5 |
| Aminopenicillins | R + I | 1.7 | 3.8 | 0 | 1.5 | |
| Amox/Clav | R | 0 | 0 | 0 | 0 | |
| Ceftiofur | R | 1.7 | 8.7 | 0 | 3.1 | |
| Ceftiofur | R + I | 0.3 | 1 | 0 | 0.5 | |
| Erythromycin | R | 32.4 | 100 | 4.4 | 33.4 | |
| Florfenicol | R | 15.3 | 91.9 | 0 | 24.2 | |
| Florfenicol | R + I | 0 | 0 | 0 | 0 | |
| Fluoroquinolones | R | 6.9 | 61.3 | 0 | 15.7 | |
| Fluoroquinolones | R + I | 0.5 | 1.5 | 0 | 0.7 | |
| Penicillin | R | 13.3 | 33.3 | 0 | 12 | |
| Sulfa/TMP | R | 11.9 | 68.7 | 0 | 16.1 | |
| Sulfa/TMP | R + I | 19.6 | 25.3 | 14 | 5.7 | |
| Tetracyclines | R | 39.3 | 87.1 | 0 | 22.6 | |
| Tetracyclines | R + I | 46.6 | 68.6 | 6 | 25.4 | |
| Tilmicosin | R | 14.2 | 98.9 | 0 | 27.9 | |
| Tilmicosin | R + I | 3.3 | 5.4 | 2.2 | 1.3 | |
| Tulathromycin | R | 1.9 | 11.6 | 0 | 4 | |
| Tulathromycin | R + I | 0 | 0 | 0 | 0 | |
| Tylosin | R | 85.2 | 100 | 70 | 15.1 | |
| A. pleuropneumoniae | Amox/Clav | R | 1.9 | 10.8 | 0 | 3.6 |
| Amox/Clav | R + I | 2.7 | 8.9 | 0 | 4.1 | |
| Ceftiofur | R | 0.2 | 3.1 | 0 | 0.8 | |
| Ceftiofur | R + I | 0.7 | 7.7 | 0 | 2.2 | |
| Florfenicol | R | 3.5 | 43.1 | 0 | 11.2 | |
| Florfenicol | R + I | 5.4 | 34.3 | 0 | 10.8 | |
| Fluoroquinolones | R | 0.8 | 11.8 | 0 | 2.2 | |
| Fluoroquinolones | R + I | 8.2 | 27.8 | 0 | 11.4 | |
| Penicillins | R | 5.3 | 21.5 | 0 | 7 | |
| Penicillins | R + I | 13.6 | 69.2 | 0 | 18.1 | |
| Sulfa/TMP | R | 5.4 | 20 | 0 | 7.4 | |
| Sulfa/TMP | R + I | 10.5 | 32.7 | 4 | 7.8 | |
| Tetracyclines | R | 30.7 | 100 | 0 | 31.8 | |
| Tetracyclines | R + I | 37.9 | 100 | 0 | 35.4 | |
| Tiamulin | R | 1 | 7 | 0 | 1.7 | |
| Tiamulin | R + I | 3.5 | 13.5 | 0 | 5.1 | |
| Tilmicosin | R | 2.8 | 25 | 0 | 7 | |
| Tilmicosin | R + I | 6.8 | 51.3 | 0 | 14 | |
| Tulathromycin | R | 0 | 0 | 0 | 0 | |
| Tulathromycin | R + I | 1.5 | 66.7 | 0 | 9.9 | |
| Staphylococci | Penicillin | R | 71.2 | 88.9 | 61.8 | 13 |
| Sulfa/TMP | R | 1.8 | 11.1 | 0 | 2.5 | |
| S. suis | Aminopenicillins | R | 1.7 | 19.6 | 0 | 3.7 |
| Aminopenicillins | R + I | 0.3 | 0.9 | 0 | 0.4 | |
| Ceftiofur | R | 6 | 56 | 0 | 15 | |
| Florfenicol | R | 4.7 | 41.1 | 0 | 10.3 | |
| Penicillin | R | 6.9 | 66 | 0 | 16.5 | |
| Penicillin | R + I | 18.4 | 19.9 | 14.5 | 2.4 | |
| Sulfa/TMP | R | 6.7 | 47.9 | 0.7 | 9 | |
| Sulfa/TMP | R + I | 24.9 | 44.4 | 21 | 8.7 | |
| Sulfonamides | R | 69.5 | 86 | 52.9 | 12.9 | |
| Tetracyclines | R | 82.6 | 100 | 69 | 8 | |
| Tetracyclines | R + I | 89.2 | 100 | 81.2 | 9 | |
| Tiamulin | R | 23.3 | 80.4 | 0 | 27.7 | |
| Tylosin | R | 59.9 | 91.1 | 47 | 13.9 | |
| Tylosin | R + I | 62.9 | 66 | 54.7 | 5 |
Suggested citation: EFSA AHAW Panel (EFSA Panel on Animal Health and Welfare) , Nielsen SS, Bicout DJ, Calistri P, Canali E, Drewe JA, Garin‐Bastuji B, Gonzales Rojas JL, Gortazar Schmidt C, Herskin M, Michel V, Miranda Chueca MA, Padalino B, Pasquali P, Roberts HC, Sihvonen LH, Spoolder H, Stahl K, Velarde A, Viltrop A, Winckler C, Dewulf J, Guardabassi L, Hilbert F, Mader R, Baldinelli F and Alvarez J, 2021. Scientific Opinion on the assessment of animal diseases caused by bacteria resistant to antimicrobials: Swine. EFSA Journal 2021;19(12):7113, 66 pp. 10.2903/j.efsa.2021.7113
Requestor: European Commission
Question number: EFSA‐Q‐2021‐00412
Panel members: Søren Saxmose Nielsen, Julio Alvarez, Dominique Joseph Bicout, Paolo Calistri, Elisabetta Canali, Julian Ashley Drewe, Bruno Garin‐Bastuji, Jose Luis Gonzales Rojas, Christian Gortazar Schmidt, Mette Herskin, Virginie Michel, Miguel Angel Miranda Chueca, Barbara Padalino, Paolo Pasquali, Helen Clare Roberts, Liisa Helena Sihvonen, Hans Spoolder, Karl Stahl, Antonio Velarde, Arvo Viltrop and Christoph Winckler.
Declarations of interest: The declarations of interest of all scientific experts active in EFSA's work are available at https://ess.efsa.europa.eu/doi/doiweb/doisearch.
Acknowledgements: The AHAW Panel wishes to thank Peter Damborg, Carmen Espinosa‐Gongora, Steffen Lynge Jørgensen from the University of Copenhagen for conducting the extensive literature review under the contract OC/EFSA/ALPHA/2020/02 – LOT 1, Verena Oswaldi from EFSA and Peter Davies from the University of Minnesota for the support provided for this scientific output.
Adopted: 23 June 2021
This article was originally published on the EFSA website http://www.efsa.europa.eu on 3 August 2021 as part of EFSA’s publication procedures.
Notes
References
- Abraham S, Jordan D, Wong HS, Johnson JR, Toleman MA, Wakeham DL, Gordon DM, Turnidge JD, Mollinger JL, Gibson JS and Trott DJ, 2015. First detection of extended‐spectrum cephalosporin‐ and fluoroquinolone‐resistant Escherichia coli in Australian food‐producing animals. Journal of Global Antimicrobial Resistance, 3, 273–277. [DOI] [PubMed] [Google Scholar]
- Amaral AF, Rebelatto R, Klein CS, Takeuti KL, Filho JXO, Morés N, Cardoso MRI and Barcellos DESN, 2019. Antimicrobial susceptibility profile of historical and recent Brazilian pig isolates of Pasteurella multocida. Pesquisa Veterinária Brasileira, 39, 107–111. 10.1590/1678-5150-pvb-5810 [DOI] [Google Scholar]
- Bessone FA, Perez MLS, Zielinski G, Dibarbora M, Conde MB, Cappuccio J and Alustiza F, 2019. Characterization and comparison of strains of Pasteurella multocida associated with cases of progressive atrophic rhinitis and porcine pneumonia in Argentina. Veterinary World, 12, 434–439. 10.14202/vetworld.2019.434-439 [DOI] [PMC free article] [PubMed] [Google Scholar]
- Burow E, Rostalski A, Harlizius J, Gangl A, Simoneit C, Grobbel M, Kollas C, Tenhagen B-A and Käsbohrer A, 2019. Antibiotic resistance in Escherichia coli from pigs from birth to slaughter and its association with antibiotic treatment. Preventive Veterinary Medicine, 165, 52–62. [DOI] [PubMed] [Google Scholar]
- Callens B, Faes C, Maes D, Catry B, Boyen F, Francoys D, de Jong E, Haesebrouck F and Dewulf J, 2015. Presence of antimicrobial resistance and antimicrobial use in sows are risk factors for antimicrobial resistance in their offspring. Microbial Drug Resistance, 21, 50–58. 10.1089/mdr.2014.0037 [DOI] [PubMed] [Google Scholar]
- Cid D, Fernandez-Garayzabal JF, Pinto C, Dominguez L and Vela AI, 2019. Antimicrobial susceptibility of Pasteurella multocida isolated from sheep and pigs in Spain ‐ Short communication. Acta Veterinaria Hungarica, 67, 489–498. 10.1556/004.2019.048 [DOI] [PubMed] [Google Scholar]
- CLSI (Clinical and Laboratory Standards Institute), 2017. Methods for antimicrobial susceptibility testing of infrequently isolated or fastidious bacteria isolated from animals. CLSI supplement VET06 . 1st Edition. Wayne, PA: Clinical and Laboratory Standards Institute. [Google Scholar]
- Cuevas I, Carbonero A, Cano D, Garcia-Bocanegra I, Amaro MA and Borge C, 2020. Antimicrobial resistance of Pasteurella multocida type B isolates associated with acute septicemia in pigs and cattle in Spain. BMC Veterinary Research, 16, 222. 10.1186/s12917-020-02442-z [DOI] [PMC free article] [PubMed] [Google Scholar]
- DANMAP , 2019. Use of antimicrobial agents and occurrence of antimicrobial resistance in bacteria from food animals, food and humans in Denmark. 1600-2032. Available online: https://www.danmap.org/Reports/2019
- Dayao DA, Gibson JS, Blackall PJ and Turni C, 2014. Antimicrobial resistance in bacteria associated with porcine respiratory disease in Australia. Veterinary Microbiology, 171, 232–235. 10.1016/j.vetmic.2014.03.014 [DOI] [PubMed] [Google Scholar]
- EFSA AHAW Panel , Nielsen SS, Bicout DJ, Calistri P, Canali E, Drewe JA, Garin-Bastuji B, Gonzales Rojas JL, Gortazar Schmidt C, Herskin M, Michel V, Miranda Chueca MA, Padalino B, Pasquali P, Roberts HC, Sihvonen LH, Spoolder H, Stahl K, Velarde A, Viltrop A, Winckler C, Dewulf J, Guardabassi L, Hilbert F, Mader R, Smith P, Aznar I, Baldinelli F and J A, 2021. Ad hoc method for the assessment of animal diseases caused by bacteria resistant to antimicrobials. EFSA Journal 2021;19(6):e06645, 45 pp. 10.2903/j.efsa.2021.6645 [DOI] [PMC free article] [PubMed] [Google Scholar]
- El Garch F, de Jong A, Simjee S, Moyaert H, Klein U, Ludwig C, Marion H, Haag-Diergarten S, Richard-Mazet A, Thomas V and Siegwart E, 2016. Monitoring of antimicrobial susceptibility of respiratory tract pathogens isolated from diseased cattle and pigs across Europe, 2009–2012: VetPath results. Veterinary Microbiology, 194, 11–22. [DOI] [PubMed] [Google Scholar]
- EUCAST , 2017. EUCAST guidelines for detection of resistance mechanisms and specific resistances of clinical and/or epidemiological importance. Version 2.0 Edition. Place. [Google Scholar]
- FINRES-Vet (Finnish Food Authority), 2019. Finnish Veterinary Antimicrobial Resistance Monitoring and Consumption of Antimicrobial Agents. 2669-8307, Helsinki, Finland. Available online: https://www.ruokavirasto.fi/globalassets/viljelijat/elaintenpito/elainten-laakitseminen/antibioottiresistenssin_seuranta/finres-vet_2019_summary_en.pdf
- Galán-Relaño A, Gomez-Gascon L, Luque I, Barrero-Dominguez B, Casamayor A, Cardoso-Toset F, Vela AI, Fernandez-Garayzabal JF and Tarradas C, 2019. Antimicrobial susceptibility and genetic characterization of Trueperella pyogenes isolates from pigs reared under intensive and extensive farming practices. Veterinary Microbiology, 232, 89–95. 10.1016/j.vetmic.2019.04.011 [DOI] [PubMed] [Google Scholar]
- Garcia-Menino I, Garcia V, Alonso MP, Blanco JE, Blanco J and Mora A, 2021. Clones of enterotoxigenic and Shiga toxin‐producing Escherichia coli implicated in swine enteric colibacillosis in Spain and rates of antibiotic resistance. Veterinary Microbiology, 252. 10.1016/j.vetmic.2020.108924 [DOI] [PubMed] [Google Scholar]
- Gurung M, Tamang MD, Moon DC, Kim SR, Jeong JH, Jang GC, Jung SC, Park YH and Lim SK, 2015. Molecular basis of resistance to selected antimicrobial agents in the emerging zoonotic pathogen Streptococcus suis . Journal of Clinical Microbiology, 53, 2332–2336. 10.1128/JCM.00123-15 [DOI] [PMC free article] [PubMed] [Google Scholar]
- Haimi-Hakala M, Halli O, Laurila T, Raunio-Saarnisto M, Nokireki T, Laine T, Nykasenoja S, Pelkola K, Segales J, Sibila M, Oliviero C, Peltoniemi O, Pelkonen S and Heinonen M, 2017. Etiology of acute respiratory disease in fattening pigs in Finland. Porcine Health Management, 3, 19. 10.1186/s40813-017-0065-2 [DOI] [PMC free article] [PubMed] [Google Scholar]
- Hampson DJ, Lugsomya K, La T, Phillips ND, Trott DJ and Abraham S, 2019. Antimicrobial resistance in Brachyspira–an increasing problem for disease control. Veterinary Microbiology, 229, 59–71. 10.1016/j.vetmic.2018.12.019 [DOI] [PubMed] [Google Scholar]
- Hidalgo Á, Carvajal A, Vester B, Pringle M, Naharro G and Rubio P, 2011. Trends towards lower antimicrobial susceptibility and characterization of acquired resistance among clinical isolates of Brachyspira hyodysenteriae in Spain. Antimicrobial Agents and Chemotherapy, 55, 3330–3337. [DOI] [PMC free article] [PubMed] [Google Scholar]
- Holmer I, Salomonsen CM, Jorsal SE, Astrup LB, Jensen VF, Hog BB and Pedersen K, 2019. Antibiotic resistance in porcine pathogenic bacteria and relation to antibiotic usage. BMC Veterinary Research, 15, 449. 10.1186/s12917-019-2162-8 [DOI] [PMC free article] [PubMed] [Google Scholar]
- Kim B, Hur J, Lee JY, Choi Y and Lee JH, 2016. Molecular serotyping and antimicrobial resistance profiles of Actinobacillus pleuropneumoniae isolated from pigs in South Korea. Veterinary Quartely, 36, 137–144. 10.1080/01652176.2016.1155241 [DOI] [PubMed] [Google Scholar]
- Kim J, Kim JW, Oh SI, So B, Kim WI and Kim HY, 2019. Characterisation of Pasteurella multocida isolates from pigs with pneumonia in Korea. BMC Veterinary Research, 15, 119. 10.1186/s12917-019-1861-5 [DOI] [PMC free article] [PubMed] [Google Scholar]
- Lee KE, Jeoung HY, Lee JY, Lee MH, Choi HW, Chang KS, Oh YH and An DJ, 2012. Phenotypic characterization and random amplified polymorphic DNA (RAPD) analysis of Pasteurella multocida isolated from Korean pigs. Journal of Veterinary Medicine Science, 74, 567–573. 10.1292/jvms.11-0418 [DOI] [PubMed] [Google Scholar]
- Li XS, Liu BG, Dong P, Li FL, Yuan L and Hu GZ, 2018. The prevalence of mcr‐1 and resistance characteristics of Escherichia coli isolates from diseased and healthy pigs. Diagnosis Microbial Infectious Disease, 91, 63–65. 10.1016/j.diagmicrobio.2017.12.014 [DOI] [PubMed] [Google Scholar]
- Luppi A, Bonilauri P, Dottori M, Gherpelli Y, Biasi G, Merialdi G, Maioli G and Martelli P, 2015. Antimicrobial resistance of F4+ Escherichia coli isolated from Swine in Italy. Transboundary Emerging Disease, 62, 67–71. 10.1111/tbed.12081 [DOI] [PubMed] [Google Scholar]
- Mader R, Damborg P, Amat J-P, Bengtsson B, Bourély C, Broens EM, Busani L, Crespo-Robledo P, Filippitzi M-E and Fitzgerald W, 2021. Building the European Antimicrobial Resistance Surveillance network in veterinary medicine (EARS‐Vet). Eurosurveillance, 26, 2001359. 10.2807/1560-7917.ES.2021.26.4.2001359 [DOI] [PMC free article] [PubMed] [Google Scholar]
- Mahu M, Pasmans F, Vranckx K, De Pauw N, Vande Maele L, Vyt P, Vandersmissen T, Martel A, Haesebrouck F and Boyen F, 2017. Presence and mechanisms of acquired antimicrobial resistance in Belgian Brachyspira hyodysenteriae isolates belonging to different clonal complexes. Veterinary Microbiology, 207, 125–132. 10.1016/j.vetmic.2017.05.022 [DOI] [PubMed] [Google Scholar]
- Malik YS, Chander Y, Olsen K and Goyal SM, 2011. Antimicrobial resistance in enteric pathogens isolated from Minnesota pigs from 1995 to 2004. Canadian Journal of Veterinary Research, 75, 117–121. [PMC free article] [PubMed] [Google Scholar]
- Nedbalcová K, Zouharová M and Šperling D, 2017. The determination of minimum inhibitory concentrations of selected antimicrobials for porcine Haemophilus parasuis isolates from the Czech Republic. Acta Veterinaria Brno, 86, 175–181. 10.2754/avb201786020175 [DOI] [Google Scholar]
- Park J, Friendship RM, Poljak Z, Weese JS and Dewey CE, 2013. An investigation of exudative epidermitis (greasy pig disease) and antimicrobial resistance patterns of Staphylococcus hyicus and Staphylococcus aureus isolated from clinical cases. Canadian Veterinary Journal, 54, 139–144. [PMC free article] [PubMed] [Google Scholar]
- Petrocchi-Rilo M, Gutierrez-Martin CB, Mendez-Hernandez JI, Rodriguez-Ferri EF and Martinez-Martinez S, 2019. Antimicrobial resistance of Pasteurella multocida isolates recovered from swine pneumonia in Spain throughout 2017 and 2018. Veterinary Animal Science, 7. 10.1016/j.vas.2018.100044 [DOI] [PMC free article] [PubMed] [Google Scholar]
- Pringle M, Landén A, Unnerstad HE, Molander B and Bengtsson B, 2012. Antimicrobial susceptibility of porcine Brachyspira hyodysenteriae and Brachyspira pilosicoli isolated in Sweden between 1990 and 2010. Acta Veterinaria Scandinavica, 54, 1–6. 10.1186/1751-0147-54-54 [DOI] [PMC free article] [PubMed] [Google Scholar]
- Rugna G, Bonilauri P, Carra E, Bergamini F, Luppi A, Gherpelli Y, Magistrali CF, Nigrelli A, Alborali GL, Martelli P, La T, Hampson DJ and Merialdi G, 2015. Sequence types and pleuromutilin susceptibility of Brachyspira hyodysenteriae isolates from Italian pigs with swine dysentery: 2003–2012. Vet J, 203, 115–119. 10.1016/j.tvjl.2014.10.033 [DOI] [PubMed] [Google Scholar]
- Serpa M, Nascimento JAFBd, Alves MF, Guedes MIMC, Reis AT, Heinemann MB, Lage AP, Lobato ZIP and Dorneles EMS, 2020. Antimicrobial resistance in bacteria isolated from pigs with respiratory clinical signs in Brazil. Brazilian Journal of Veterinary Research and Animal Science, 57. 10.11606/issn.1678-4456.bjvras.2020.160956 [DOI] [Google Scholar]
- Šperling D, Smola J and Čížek A, 2011. Characterisation of multiresistant Brachyspira hyodysenteriae isolates from Czech pig farms. Veterinary Record, 168, 215. [DOI] [PubMed] [Google Scholar]
- Spindola MG, Cunha MPV, Moreno LZ, Amigo CR, Silva APS, Parra BM, Poor AP, de Oliveira CH, Perez BP, Knobl T and Moreno AM, 2018. Genetic diversity, virulence genotype and antimicrobial resistance of uropathogenic Escherichia coli (UPEC) isolated from sows. Veterinary Quartely, 38, 79–87. 10.1080/01652176.2018.1519321 [DOI] [PMC free article] [PubMed] [Google Scholar]
- Swedres-Svarm , 2019. Sales of antibiotics and occurrence of resistance in Sweden. 1650-6332 Solna/Uppsala. Available online: https://www.sva.se/media/0hihej1c/swedres-svarm-2019.pdf
- UK-VARSS , 2019. Supplementary Material. New Haw, Addlestone: Veterinary Medicines Directorate. Available online: www.gov.uk/government/collections/veterinary-antimicrobial-resistance-and-sales-surveillance
- Vanni M, Merenda M, Barigazzi G, Garbarino C, Luppi A, Tognetti R and Intorre L, 2012. Antimicrobial resistance of Actinobacillus pleuropneumoniae isolated from swine. Veterinary Microbiology, 156, 172–177. 10.1016/j.vetmic.2011.10.022 [DOI] [PubMed] [Google Scholar]
- Vilaro A, Novell E, Enrique-Tarancon V, Balielles J, Vilalta C, Martinez S and Fraile Sauce LJ, 2020. Antimicrobial susceptibility pattern of porcine respiratory bacteria in Spain. Antibiotics (Basel), 9. 10.3390/antibiotics9070402 [DOI] [PMC free article] [PubMed] [Google Scholar]
- Weber N, Nielsen J, Hjulsager CK, Jorsal S, Haugegaard S, Hansen C and Pedersen K, 2017. Comparison of bacterial culture and qPCR testing of rectal and pen floor samples as diagnostic approaches to detect enterotoxic Escherichia coli in nursery pigs. Preventive veterinary medicine, 143, 61–67. [DOI] [PubMed] [Google Scholar]
- Xu C, Zhang J, Zhao Z, Guo L, Zhang B, Feng S, Zhang L and Liao M, 2011. Antimicrobial susceptibility and PFGE genotyping of Haemophilus parasuis isolates from pigs in South China (2008–2010). Journal of Veterinary Medicinal Science, 73, 1061–1065. 10.1292/jvms.10-0515 [DOI] [PubMed] [Google Scholar]
- Yeh JC, Lo DY, Chang SK, Chou CC and Kuo HC, 2017. Antimicrobial susceptibility, serotypes and genotypes of Pasteurella multocida isolates associated with swine pneumonia in Taiwan. Veterinary Record, 181, 323. 10.1136/vr.104023 [DOI] [PubMed] [Google Scholar]
- Yongkiettrakul S, Maneerat K, Arechanajan B, Malila Y, Srimanote P, Gottschalk M and Visessanguan W, 2019. Antimicrobial susceptibility of Streptococcus suis isolated from diseased pigs, asymptomatic pigs, and human patients in Thailand. BMC Veterinary Research, 15, 5. 10.1186/s12917-018-1732-5 [DOI] [PMC free article] [PubMed] [Google Scholar]
- Yoo AN, Cha SB, Shin MK, Won HK, Kim EH, Choi HW and Yoo HS, 2014. Serotypes and antimicrobial resistance patterns of the recent Korean Actinobacillus pleuropneumoniae isolates. Veterinary Record, 174, 223. 10.1136/vr.101863 [DOI] [PubMed] [Google Scholar]
- Zhang Q, Zhou M, Song D, Zhao J, Zhang A and Jin M, 2013. Molecular characterisation of resistance to fluoroquinolones in Haemophilus parasuis isolated from China. International Journal of Antimicrobial Agents, 42, 87–89. 10.1016/j.ijantimicag.2013.03.011 [DOI] [PubMed] [Google Scholar]
- Zhang J, Xu C, Shen H, Li J, Guo L, Cao G, Feng S and Liao M, 2014. Biofilm formation in Haemophilus parasuis: relationship with antibiotic resistance, serotype and genetic typing. Research Veterinary Science, 97, 171–175. 10.1016/j.rvsc.2014.04.014 [DOI] [PubMed] [Google Scholar]
- Zhang C, Zhang Z, Song L, Fan X, Wen F, Xu S and Ning Y, 2015. Antimicrobial resistance profile and genotypic characteristics of Streptococcus suisCapsular type 2 isolated from clinical carrier sows and diseased pigs in China. BioMed Research International, 2015, 1–9. 10.1155/2015/284303 [DOI] [PMC free article] [PubMed] [Google Scholar]
- Zhao Z, Xue Y, Wang C, Ding K, Wu B, He Q, Cheng X and Chen H, 2011. Antimicrobial susceptibility of Bordetella bronchiseptica isolates from pigs with respiratory diseases on farms in China. Journal of Veterinary Medicinal Science, 73, 103–106. 10.1292/jvms.10-0184 [DOI] [PubMed] [Google Scholar]
- Zhao Y, Guo L, Li J, Huang X and Fang B, 2018. Characterization of antimicrobial resistance genes in Haemophilus parasuis isolated from pigs in China. PeerJ, 6. 10.7717/peerj.4613 [DOI] [PMC free article] [PubMed] [Google Scholar]
- Zhou X, Xu X, Zhao Y, Chen P, Zhang X, Chen H and Cai X, 2010. Distribution of antimicrobial resistance among different serovars of Haemophilus parasuis isolates. Veterinary Microbiology, 141, 168–173. 10.1016/j.vetmic.2009.05.012 [DOI] [PubMed] [Google Scholar]