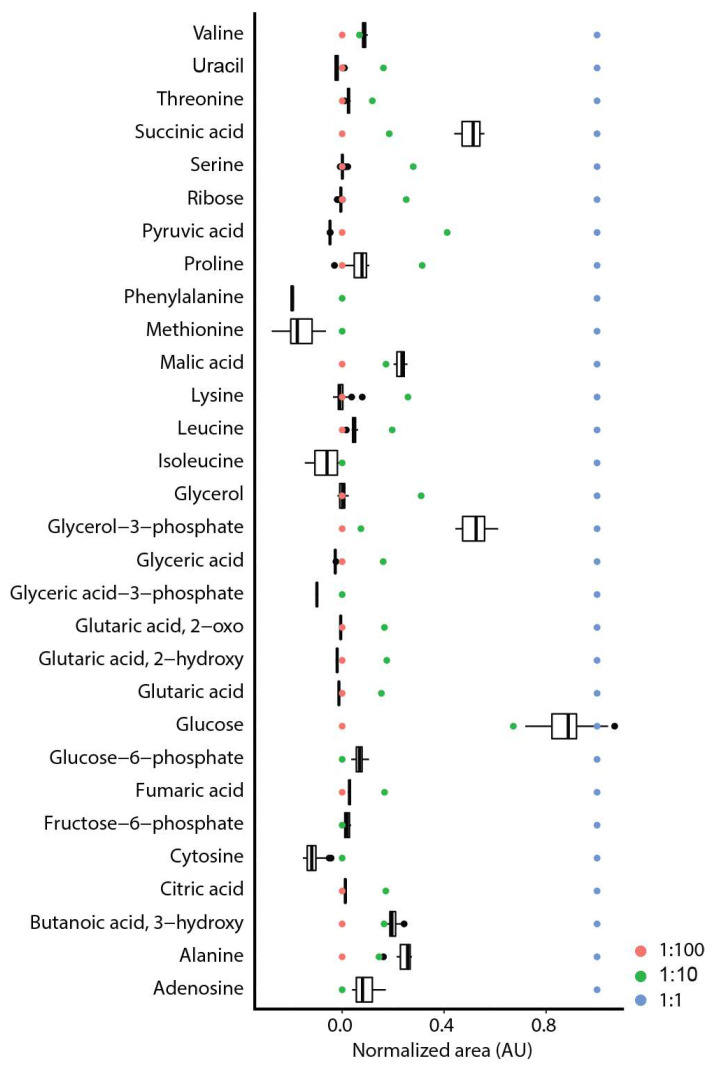
Figure 1.
Concentration range of 30/42 detected compounds in mouse liver. A calibration mixture at high (1:1), middle (1:10) and low (1:100) concentration was used for comparison (one for calibration mixture and n = 18 for liver). A minimum/maximum normalization was performed on the calibration mixture for the single compounds.

