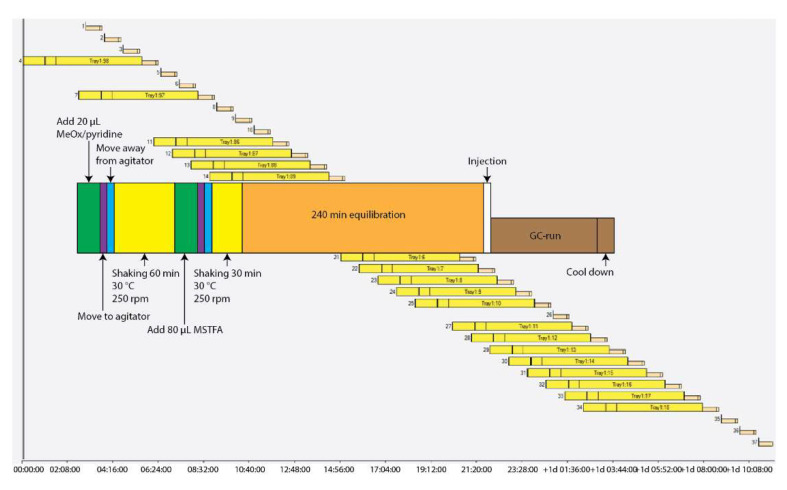
Figure 4.
Schematic of a typical automatic derivatization sequence. The multicolored diagram in the foreground displays the order of events for a single typical sample. The background diagram shows how these events are overlapped with different samples to maximize GC-MS instrument time. The GC-MS runs that are not attached to a derivatization sequence (salmon colored) represent MSTFA washes which are injected throughout the run to assess for any carryover.

