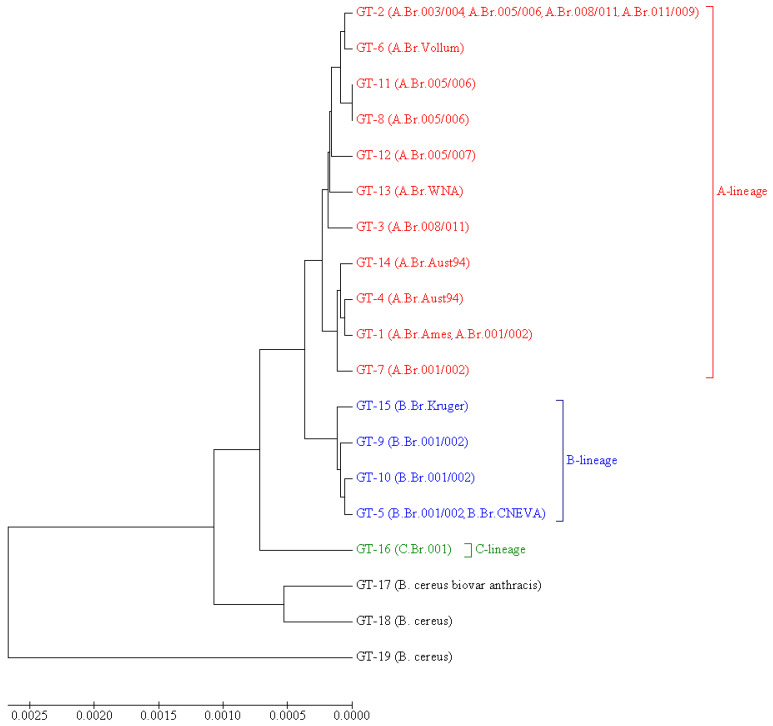
Figure 1.
UPGMA dendrogram illustrating the phylogenetic relationships of MVLSTpXO1 genotypes. Opposite each GT, it is indicated in parentheses which canSNP groups this GT includes. For each GT, which includes strains that do not belong to B. anthracis, the species is indicated instead of the canSNP group. Braces and colors mark genotypes belonging to the different evolutionary lineages: A (red color), B (blue color), and C (green color).

