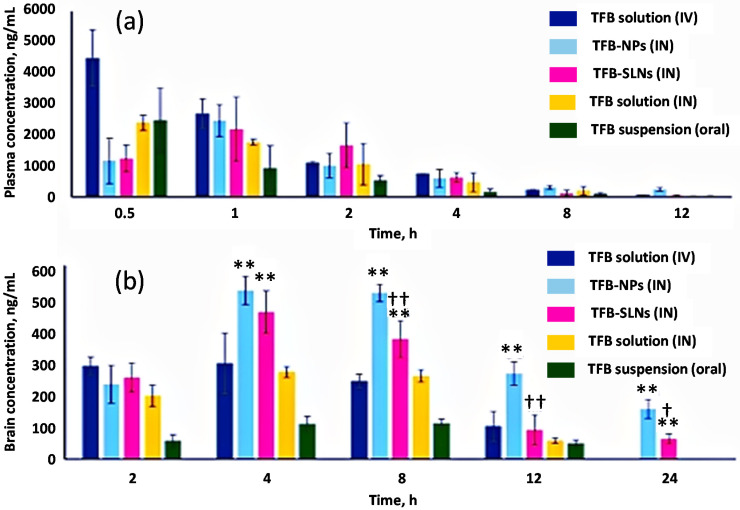
Figure 4.
Plasma concentrations (a) and brain concentrations (b) of tarenflurbil (TFB). Values are expressed as mean ± SD (n = 4). ** p < 0.0001 when compared with TFB administered by IV solution, IN solution and oral suspension, †† p < 0.0001 when compared with TFB-NPs and † p < 0.01 when compared with TFB-NPs. Adapted with permission from [139], Elsevier, 2016.

