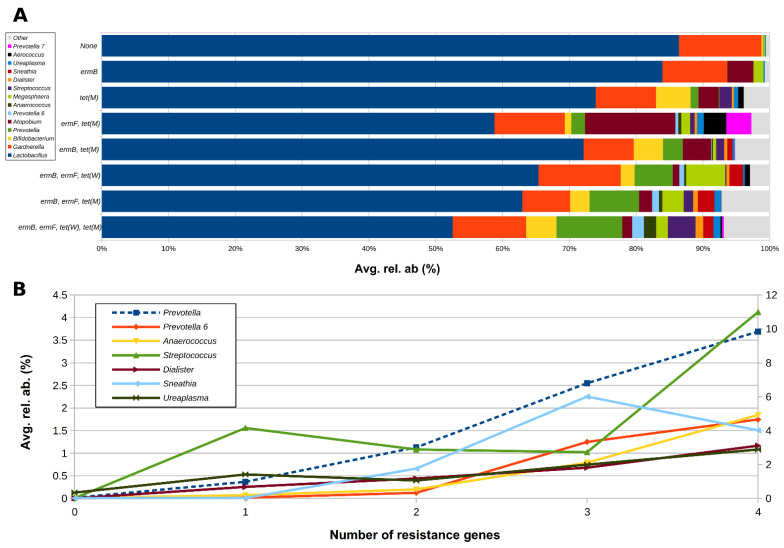
Figure 3.
(A) Horizontal barplots of the average relative abundance of the main genera constituting the vaginal microbiota of the tested women, grouped according to the combination of the different resistance genes; only combinations with >1 sample per group and only genera with avg. rel. ab. >1% in at least one combination were considered. (B) Line plot of the average relative abundance of a selection of genera from the vaginal microbiota, showing an increasing trend with increasing number of resistance genes per sample; for graphical purposes, Prevotella abundance (dashed blue line) is represented on the secondary y-axis.

