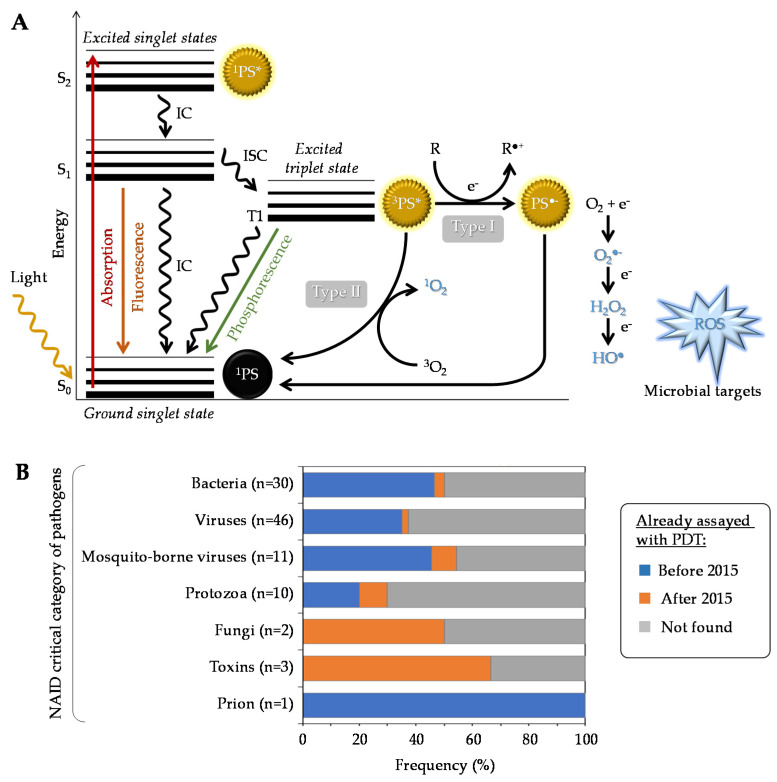
Figure 1.
(A) Modified Jablonski diagram describing the photochemical and photophysical mechanisms leading to ROS production during PDT. (B) Overview of aPDT already applied to the critical category of pathogens, as defined by the NIAID (https://www.niaid.nih.gov/research/emerging-infectious-diseases-pathogens, accessed date: 1 September 2021). For each category, the chart specifies the number and the proportion (percent of pathogens already assayed in at least one aPDT study either before or after 2015).

