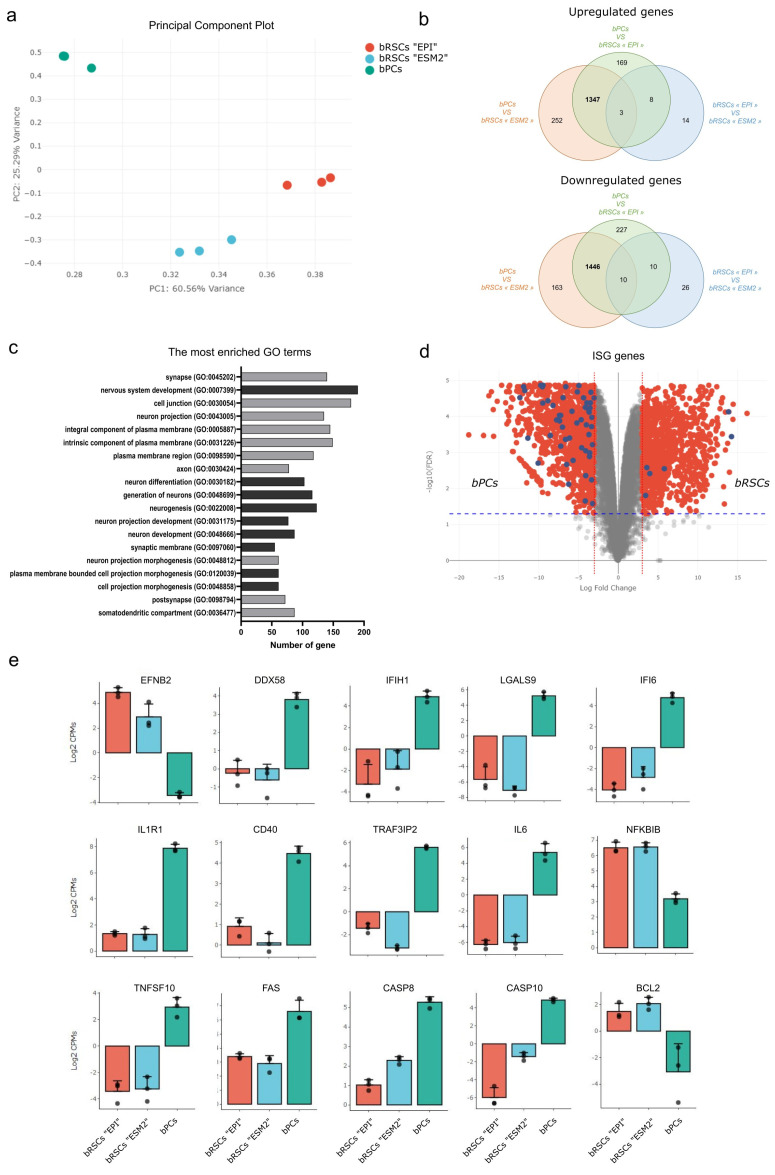
Figure 3.
Molecular features of bat reprogrammed stem cells (bRSCs). (a) Principal component analysis (PCA) of RNA-seq results for bPCs and bRSCs. Principal Component 1 (PC1, x-axis) represents 60.56% and PC2 (y-axis) represents 25.29% of the total variation in the data. (b) Venn diagram of differentially expressed genes (DEGs) between bPCs and bRSCs cultured in “EPI” or “ESM2” medium. The numbers of common DEGs between the two bRSCs cultures are in bold. (c) Gene ontology (GO) term enrichment analysis of DEGs in bRSCs. The terms with the best FDR value were selected. Dark gray represents the GO biological process and light gray represents the GO cellular component. (d) Volcano plot representation of DEGs in bPCs versus bRSCs comparison. Red dots represent all DEGs with fold change >3 and blue dots represent DEGs corresponding to interferon-stimulated genes (ISGs). (e) Bar graphs of the relative expression levels of selected genes between bPCs and bRSCs in “EPI” and “ESM2” medium: EFNB2, DDX58, IFIH1, LGALS9, IFI6, IL1R1, CD40, TRAF3IP2, IL6, NFKBIB, TNFSF10, FAS, CASP8, CASP10, and BCL2.

