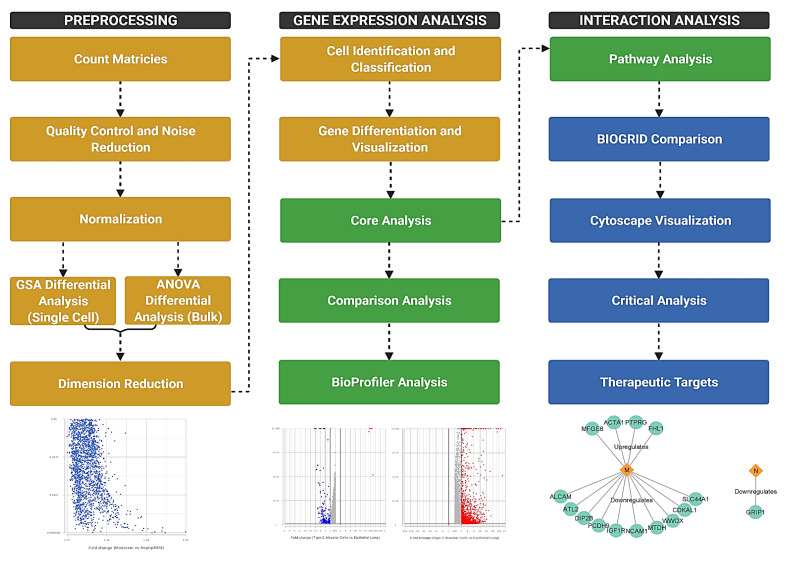
Figure 1.
Flowchart depicting the methods of the experiment. Count matrices were imported from GEO and processed for further analysis. The three major components of the study were preprocessing, gene expression analysis, and interaction analysis. Yellow steps were performed in Partek Flow, green steps in IPA, and blue steps in other software. Generated in Biorender.

