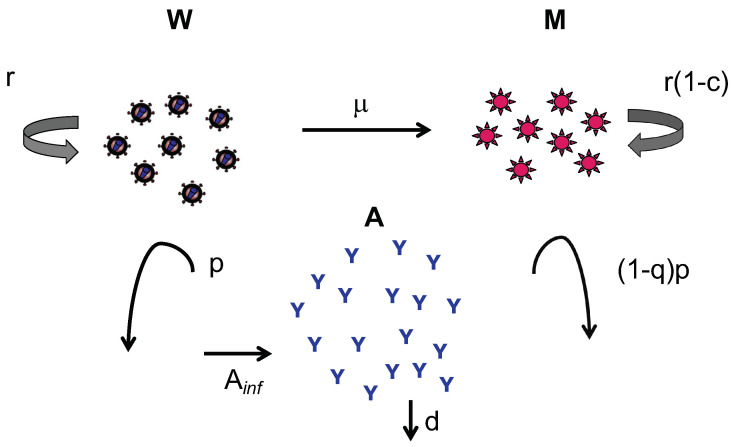
Figure 1.
Schematic diagram of the model. The wild-type population (W) increases at rate r, mutates to the mutant strain at rate and is cleared by antibodies at rate p. The mutant population increases at rate , where c is the fitness cost of the mutation; increases by mutation from the wild-type strain at rate ; and is cleared by antibodies at rate , where represents reduction in antibody blocking against the mutant. The antibody population increases at the time of each plasma infusion (by fixed amount ) and decays exponentially at rate d.

