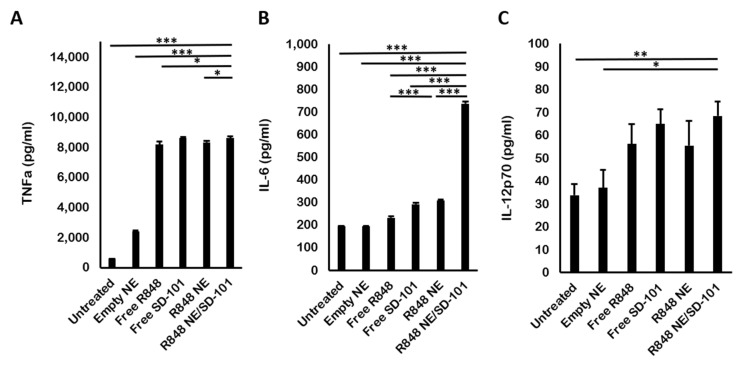
Figure 4.
In vitro ELISA for cytokine quantifications. (A) TNFa, (B) IL-6, and (C) IL-12p70 concentrations secreted by RAW 264.7 cells after 12 h treated with complete medium-only, empty NE, free R848, free SD-101, R848 NE, or R848 NE/SD-101 combination. R848 was treated at 50 μM individually, in nanoemulsion, or in combination. SD-101 was given at 300 nM individually or in combination. One-way ANOVA: * p < 0.05, ** p < 0.01, *** p < 0.001.

