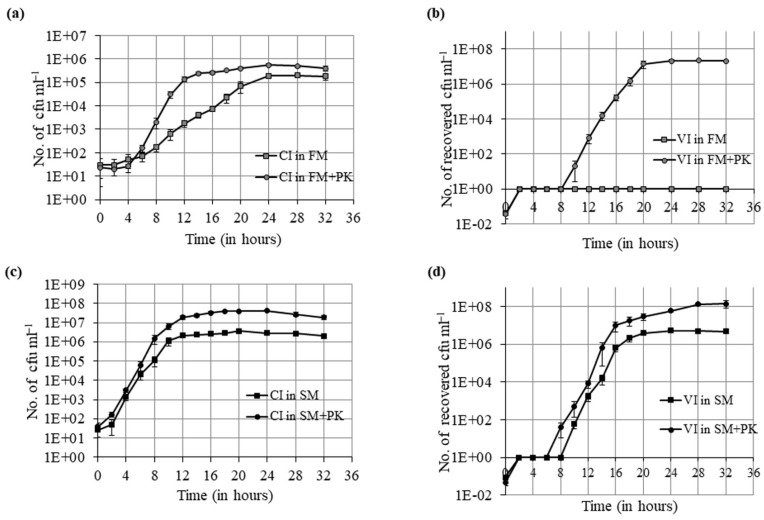
Figure 3.
Time-dependent growth curve of culturable cells and resuscitation curve of VBNC cells in ASW (FM), ASW with proteinase K ( FM + PK), spent ASW (SM) and spent ASW with proteinase K (SM + PK). (a) Growth curve of culturable cells (CI cells) in FM (■) and FM + PK (●) for 32 h at 37 °C. The viable cell count was determined by the plate count method at an interval of 2 h until the end of incubation time. (b) Resuscitation curve of VBNC cells (VI cells) in FM (■) and FM + PK (●) for 32 h at 37 °C. (c) Growth curve of CI cells in SM (■) and SM+PK (●) for 32 h at 37 °C. (d) Resuscitation curve of VI cells in SM (■) and SM+PK (●) for 32 h at 37 °C. Each data point represents the mean ± SE of three independent experiments.

