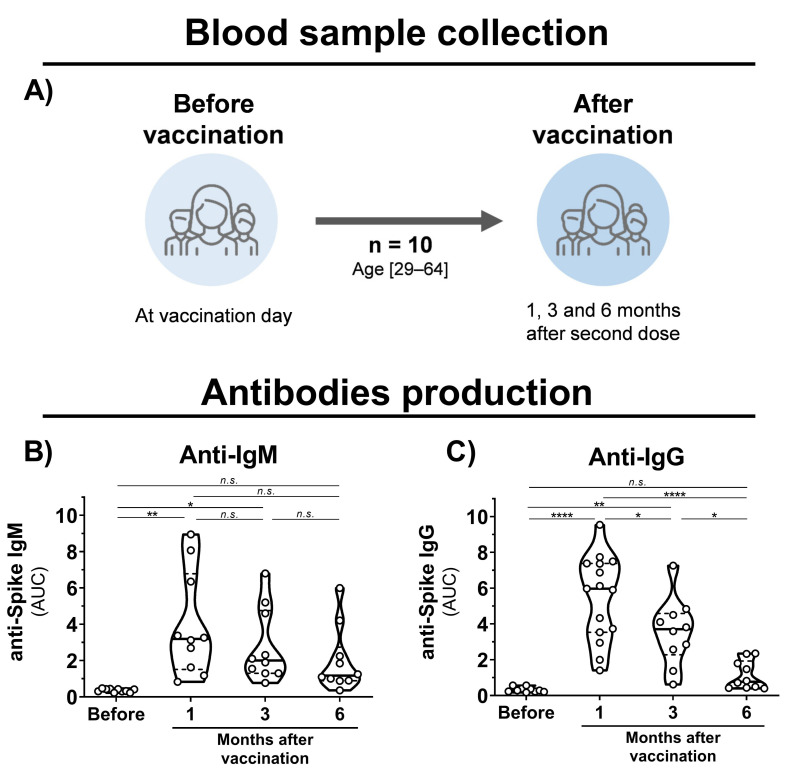
Figure 1.
Blood sample collection time points and antibody production in CoronaVac-vaccinated individuals. (A) Schematic representation of established cohort and sample collection. (B,C) Violin plots showing anti-S IgM and IgG levels, respectively, of vaccinated individuals before vaccination and after 1, 3, and 6 months of the second dose. Multiple comparisons were performed by one-way ANOVA with post hoc Tukey’s test. * p < 0.05; ** p < 0.001; **** p < 0.0001. AUC = area under curve; n.s. = not statistically significant; IgG = immunoglobulin G.

