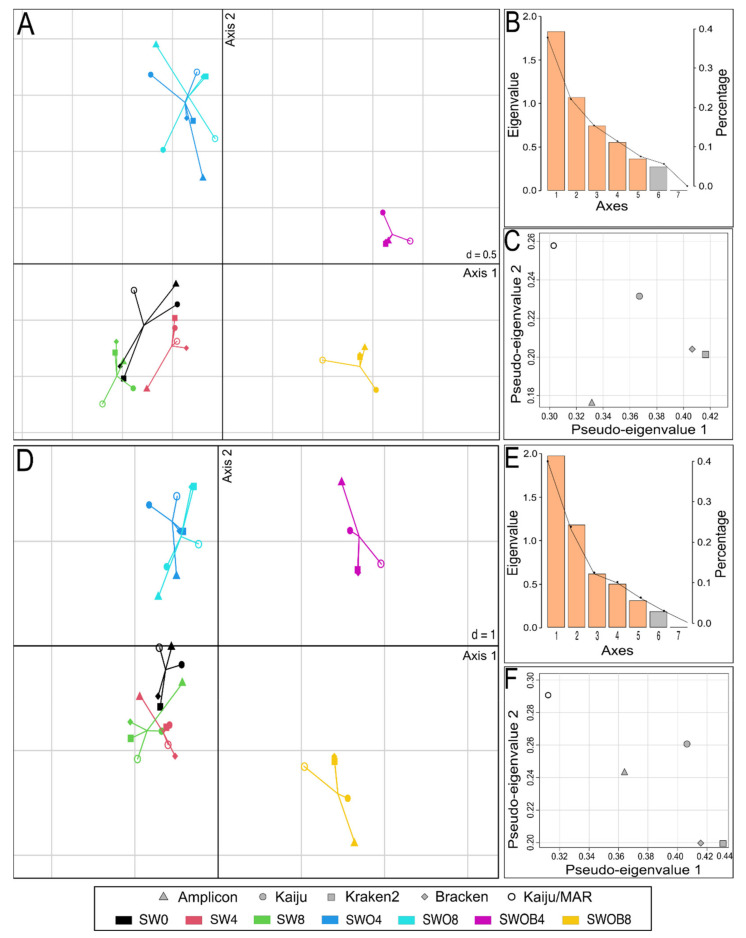
Figure 5.
Multiple co-inertia analysis (MCIA) results based on five bacterial genera proportion datasets obtained with different taxonomic assignment methods (Kaiju with NCBI-nr database, Kaiju with MARDB database, Kraken2 and Bracken with Standard Kraken2 database, and Amplicon-based sequencing with SILVA database) from seawater (SW), oil-contaminated seawater (SWO), and biostimulated oil-contaminated seawater (SWOB). The numbers in sample codes denote time in months. Subplots (A–C) depict MCIA results based on proportion data of the 50 predominant bacterial genera, and subplots (D–F) depict MCIA results based on proportion data of genera containing hydrocarbon-degrading organisms. Subplots (A,D) present the first two MCIA components in the sample space. Each sample is represented by a shape, where the five datasets for the sample are connected by lines to a center point (global score). (B,E) are Scree plots of absolute eigenvalues (bars) and the proportions of variance for the eigenvectors (line). (C,F) are data weighting graphs that show the pseudo-eigenvalue space of all datasets indicating how much variance of an eigenvalue is contributed by each dataset.

