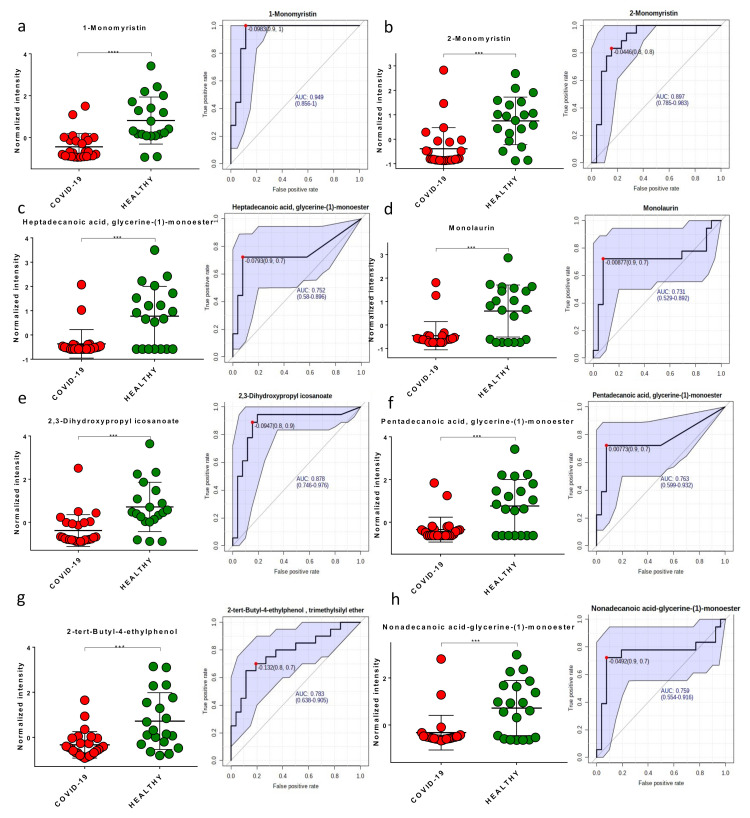
Figure 4.
Boxplots and ROC curves for the best potential biomarkers identified with metabolomics analysis (red dots: COVID-19 patients, green dots: healthy subjects). 1-monomyristin (a); 2-monomyristin (b); heptadecanoic acid, glycerine-(1)-monoester (c); monolaurin (d); 2,3-dihydroxypropylicosanoate (e); pentadecanoic acid, glycerine-(1)-monoester (f); 2-tert-butyl-4-ethylphenol (g); nonadecanoic acid, glycerine-(1)-monoester (h). ***, p-value < 0.001; ****, p-value < 0.0001.

