

Abstract
INTRODUCTION:
New therapies have been designed to stimulate the host’s immune system to fight cancer. Despite these exciting, recent successes, a large proportion of patients still do not respond to anti–programmed cell death-1 (PD-1) or anti–programmed death ligand-1 (PD-L1) therapies, and thus, biomarkers for patient selection are highly desirable. The only U.S. Food and Drug Administration–approved histopathology biomarker tests for anti–PD-1 or anti–PD-L1 therapy is assessment of PD-L1 protein expression by means of immunohistochemistry. This approach is uni-dimensional and has limitations. Innovative characterization of the tumor microenvironment (TME) with a focus on multidimensional, spatially resolved interactions at the single-cell level will provide critical mechanistic insights into therapeutic responses and potentially identify improved biomarkers for patient selection. Using multispectral approaches to image the TME and substituting cells for stars and galaxies, we applied the methodology and infrastructure developed for astronomy to pathologic analysis of specimens from patients with melanoma.
RATIONALE:
The next generation of pathologic analyses will require platforms that can characterize the coexpression of key molecules on specific cellular subsets in situ and spatial relationships between tumor cells and multiple immune elements. To that aim, we applied astronomical algorithms for high-quality imaging and the establishment of relational databases to multiplex immunofluorescence (mIF) labeling of pathology specimens, facilitating spatial analyses and immunoarchitectural characterization of the host-tumor interface. In all, we curated and coordinately mapped six markers, both individually and in combination in tumor tissue from 98 patients with melanoma receiving anti–PD-1 therapy. This dataset comprised ~127,400 image mosaics composed of more than 100 million single cells. The data outputs were linked to patient outcomes, informing in a clinically relevant way how cancer evades the immune system and potentiating biomarker assay development for precision immunotherapy.
RESULTS:
The imaging protocols used in this study were used to address outstanding questions regarding the impact of high-power field sampling strategies on biomarker performance. This information was then used to develop an approach for operator-independent field selection. The image handling strategies also facilitated the robust assessment of the intensity of PD-1 and PD-L1 expression in situ (negative, low, mid, and high levels) on different cell types. Thus, with only six markers (PD-1, PD-L1, CD8, FoxP3, CD163, and Sox10/S100), we were able to develop 41 combinations of expression patterns for these molecules and map relatively rare cells such as CD8+FoxP3+ cells to the tumor stromal boundary. Moreover, a high density of CD8+FoxP3+PD-1low/mid cells was closely associated with response to PD-1 blockade. Cell types associated with a lack of response to therapy were also identified—for example, CD163+ macrophages that were PD-L1−. This latter phenotype was also found to have a negative effect on long-term survival. When these and other key cell phenotype densities were combined, they were highly predictive of objective response and stratified long-term patient outcomes after anti–PD-1–based therapies in both a discovery cohort and an independent validation cohort.
CONCLUSION:
Here, we present the AstroPath platform, an end-to-end pathology workflow with rigorous quality control for creating quantitative, spatially resolved mIF datasets. Although the current effort focused on a six-plex mIF assay, the principles described here provide a general framework for the development of any multiplex assay with single-cell image resolution. Such approaches will vastly improve the standardization and scalability of these technologies, enabling cross-site and cross-study comparisons. This will be essential for multiplex imaging technologies to realize their potential as biomarker discovery platforms and ultimately as standard diagnostic tests for clinical therapeutic decision-making.
Next-generation tissue-based biomarkers for immunotherapy will likely include the simultaneous analysis of multiple cell types and their spatial interactions, as well as distinct expression patterns of immunoregulatory molecules. Here, we introduce a comprehensive platform for multispectral imaging and mapping of multiple parameters in tumor tissue sections with high-fidelity single-cell resolution. Image analysis and data handling components were drawn from the field of astronomy. Using this “AstroPath” whole-slide platform and only six markers, we identified key features in pretreatment melanoma specimens that predicted response to anti–programmed cell death-1 (PD-1)–based therapy, including CD163+PD-L1− myeloid cells and CD8+FoxP3+PD-1low/mid T cells. These features were combined to stratify long-term survival after anti–PD-1 blockade. This signature was validated in an independent cohort of patients with melanoma from a different institution.
Graphical Abstract
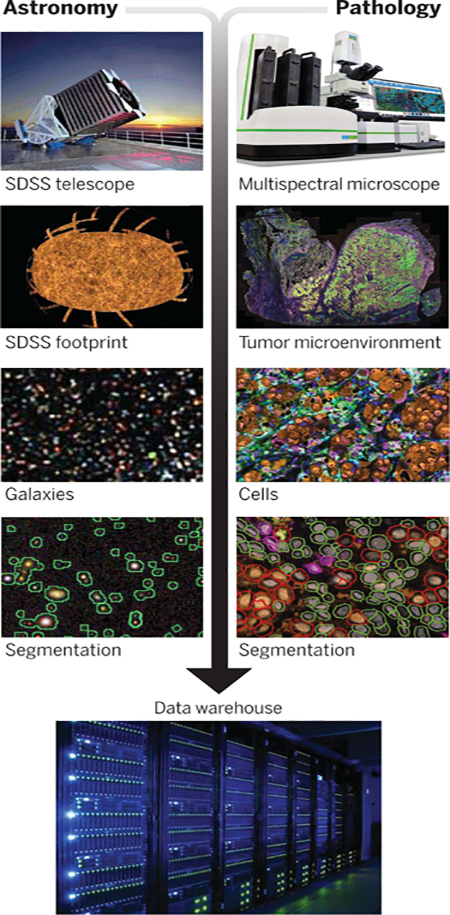
Strong parallels between multispectral analyses in astronomy and emerging multiplexing platforms for pathology. The next generation of tissue-based biomarkers are likely to be identified by use of large, well-curated datasets. To that end, image analysis approaches originally developed for astronomy were applied to pathology specimens to produce trillions of pixels of robust tissue imaging data and facilitate assay and atlas development.
Patients with multiple solid cancer types have shown unprecedented rates of tumor regression and improved survival after treatment with immune checkpoint blocking agents. This has led to U.S. Food and Drug Administration (FDA) approvals for more than 17 different tumor types for programmed cell death-1 (PD-1) or programmed death ligand-1 (PD-L1) alone (1). Unfortunately, for the majority of cancer types, less than half of patients respond to anti–PD-1 or anti–PD-L1 agents (2), and thus it is critical to develop predictive biomarkers that can precisely guide therapy for each patient. PD-L1 immunohistochemistry (IHC) in pretreatment tumor biopsies is the most common tissue-based biomarker approach for predicting response to anti–PD-1 or anti–PD-L1 treatment, with numerous FDA-approved companion diagnostic indications (3). Other approaches include assessment of microsatellite instability (also FDA-approved) (4), testing tumor mutational burden (5), detecting an interferon-γ (IFN-γ) gene signature, and quantifying multiple proteins by means of multiplex immunofluorescence (mIF)/IHC. In a recent meta-analysis, mIF/IHC demonstrated improved diagnostic performance over other tissue-based approaches when predicting response to anti–PD-1 or anti–PD-L1 treatment (6), highlighting the biomarker potential of these emerging technologies.
As the name suggests, mIF allows for the study of multiple cellular and molecular features of the tumor microenvironment (TME) in a single tissue section. In addition to being tissue-sparing, this approach has the potential to provide critical information on interconnected multidimensional variables linked to the antitumor immune response within the TME, including the coexpression of key immunomodulatory molecules on specific cellular subsets, the spatial relationships between diverse cell types, and quantitation of marker expression intensity. This is akin to what is achieved by using flow cytometry, with the added dimension of spatial resolution within the TME. However, most early multispectral mIF studies reported on categorical interpretation of markers as positive or negative, without intensity assessments (7–10). This can largely be attributed to current imaging techniques having deficiencies that limit their reliability in measuring this parameter, including variable fluorophore emission strength, improper assignment of molecules to the correct cell (for example, when cells are adjacent or overlapping in the plane of the tissue section and/or because of signal spillover from an adjacent channel), as well as luminosity variation and lens distortions that preclude accurate assessments of expression intensity in situ. Moreover, because of the data-intensive nature of mIF imaging, most multispectral mIF studies to date have characterized only a few high-power fields (HPFs) per tumor (8–11). Select HPF sampling is operator-dependent and often represents only a fraction of the available tissue for study, thus failing to represent heterogeneity across the TME (12, 13). Systematic approaches to mIF assay development, image analysis, and data handling—as well as user-independent, optimized slide sampling strategies—represent critical unmet needs before these imaging technologies can become standard-of-care diagnostics.
Here, we describe a stepwise strategy for multispectral mIF assay development and associated image analysis, which facilitates the generation of large, standardized datasets for more effective immuno-oncology biomarker identification. Because of our specific interest in measuring expression intensity in situ, our approach differs from early reports that describe multispectral mIF panel development and validation (7, 14). Emphasis was placed on the reproducible detection of low–, mid–, and high–PD-1 and –PD-L1 immune checkpoint expressions, rather than simple categorical expression. Degrees of surface expression of immune regulatory molecules, such as PD-1, have profound relevance to cellular functional states (15). As such, our development and validation process characterizes and controls for factors that affect signal intensity, such as secondary antibody selection to correct for loss of low-level signal and fluorophore titration to mitigate potential false-positive signal—that is, “bleed-through” between channels—that may result from very-high-intensity expression. Our mIF panel was quantitatively validated against single chromogenic IHC staining, which is the current clinical gold standard (16–18)
In designing our methodology to address the imaging and data handling challenges, we turned to the field of astronomy, which has vast experience in generating large multi-spectral datasets that require numerous optical corrections and normalizations. Breakthroughs in astronomy have come from a standardized approach to image collection and object identification as well as the use of large databases to properly house and analyze the amount of multispectral information to be queried (19–21). These standardized tools, integrated with large underlying data collections, are routinely accessed by thousands of astronomers, millions of times each year. Specific lessons from the astronomy experience include (i) a well-designed relational database allows for efficient data queries and makes data consistency easier; (ii) data should flow from instrument to database, with minimal human intervention; and (iii) with large enough data-sets, statistical errors become small, and systematic errors dominate. These errors can only be discovered with a conscious, methodical effort, often by using redundant observations. We applied this knowledge to object mapping. This included designing our database structure and workflows, and identifying and controlling for the potential instrumental, software, batch-to-batch variation, and field sampling error in mIF image acquisition and analysis.
The resultant “AstroPath” platform creates a framework for mIF assays and associated image analysis that can underpin the evolution of uniparameter to multiparameter imaging as a standard of diagnostics to guide application of immunotherapy regimens. We demonstrate the utility of this platform in characterizing the tumor immune microenvironment with only six markers (PD-1, PD-L1, CD8, CD163, FoxP3, and a Sox10-S100 cocktail, the latter to label melanoma cells) using an mIF assay to characterize PD-1 and/or PD-L1 expression intensity on myeloid, tumor, and T cells in situ on pretreatment tumor specimens from patients with advanced melanoma receiving anti–PD-1 therapy. We show that specific CD8+ cell phenotypes, including early effector T cells characterized by CD8+FoxP3+PD-1low/mid expression, show strong predictive value for therapeutic response. Further, a CD163+PD-L1− myeloid phenotype was identified as a feature associated with non-response. Combining these key features with operator-independent HPF selection resulted in a highly predictive composite biomarker for long-term survival.
Results
AstroPath facilitates high-quality, whole-slide mIF datasets
The creation of high-quality mIF datasets by using tyramide signal amplification (TSA) technology combined with multispectral imaging involved four main phases: (i) mIF slide staining, (ii) image acquisition and processing, (iii) cell segmentation and phenotyping, and (iv) batch-to-batch normalization. Each phase poses distinct challenges, and we have identified and quantified potential errors at each of these steps (Fig. 1 and tables S1 and S2) as well as developed quality assurance measures and corrections. We found that achieving staining in the mIF format by using TSA-based technology that was equivalent to chromogenic IHC required a detailed approach to mIF assay design, especially with regard to PD-1low/mid– and PD-L1low/mid–expressing populations (Fig. 2; a full description is provided under Materials and methods and in figs. S1 to S5). The optimization of parameters in this study was performed by using monoclonal antibodies matched to six fluorophores, but the principles are directly applicable to other antibody combinations and higher-order staining.
Fig. 1. AstroPath platform for staining optimization and image processing to generate high-quality datasets.
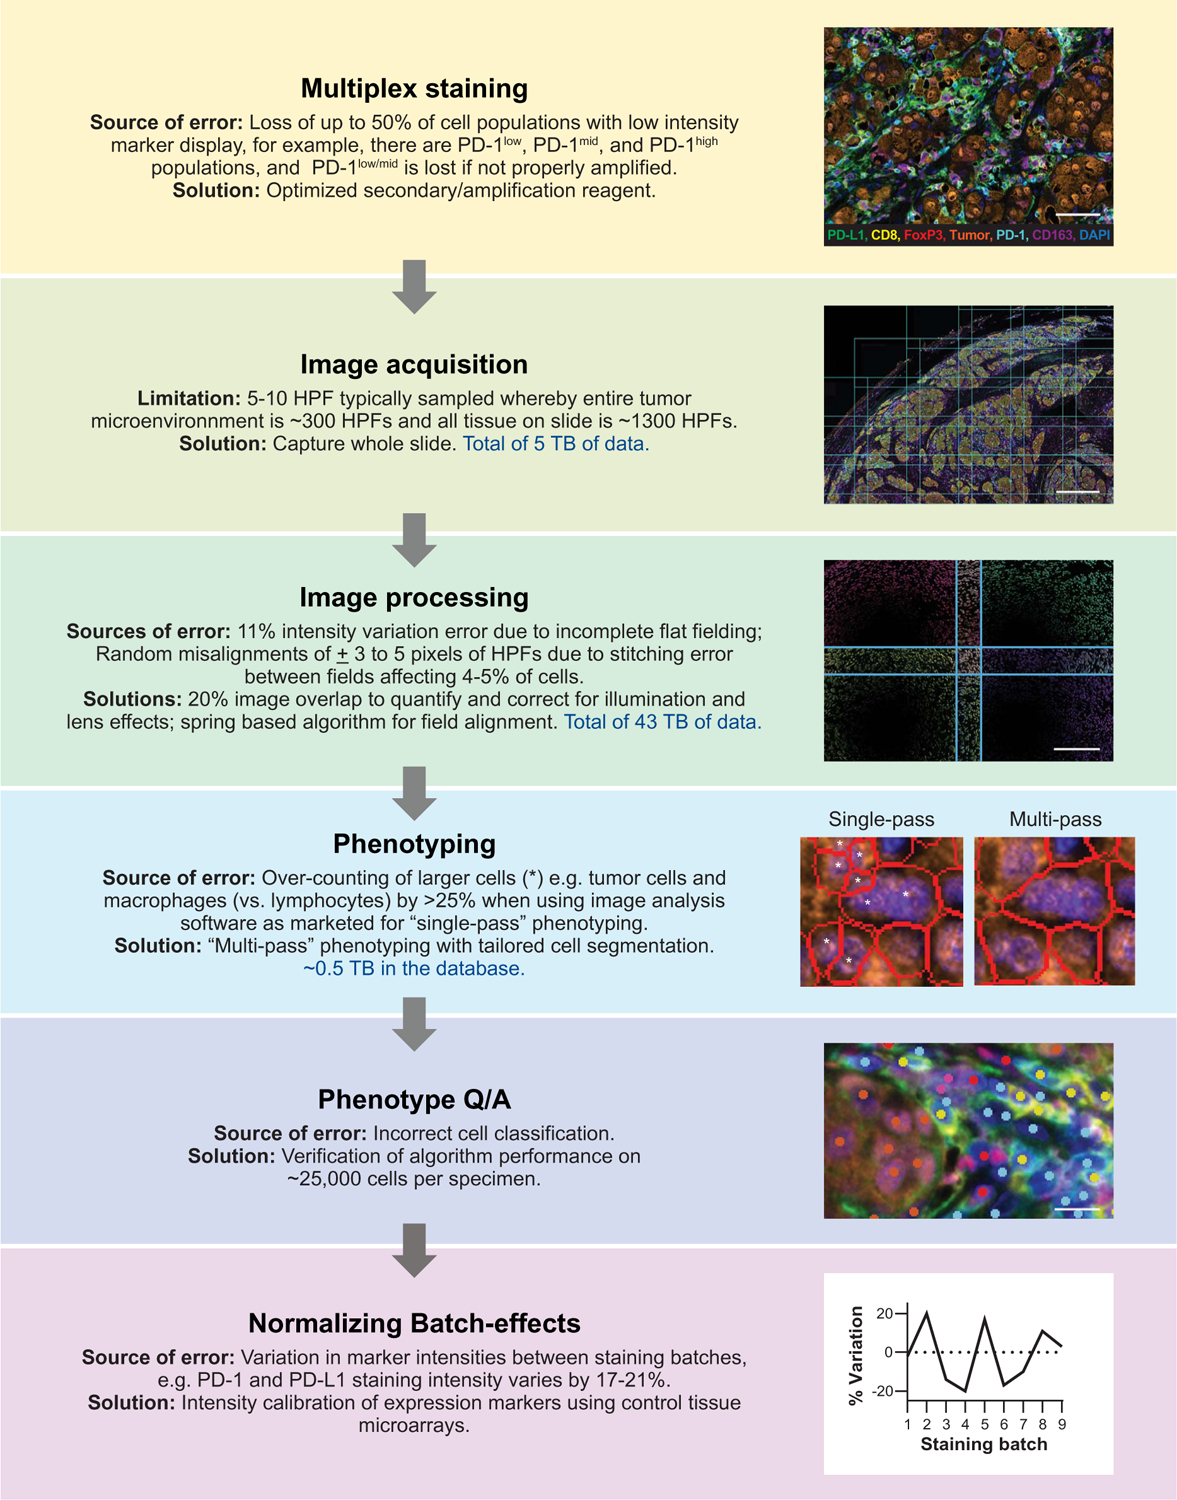
The optimization of a six-plex assay for characterizing PD-1 and PD-L1 expression (PD-1, PD-L1, CD163, FoxP3, CD8, Sox10/S100, and DAPI) is shown to detail the TSA-based AstroPath workflow of mIF with imaging and associated data usage. Solutions to common limitations and sources of error are outlined. Additional sources of error during multiplex staining and their solutions are provided in Fig. 2. Data usage amounts include the discovery and validation cohorts combined. Scale bars, top to bottom, 70 μm, 1.0 mm, 250 μm, and 12.5 μm.
Fig. 2. Optimization of staining to achieve high sensitivity and specificity by using chromogenic IHC as gold standard.
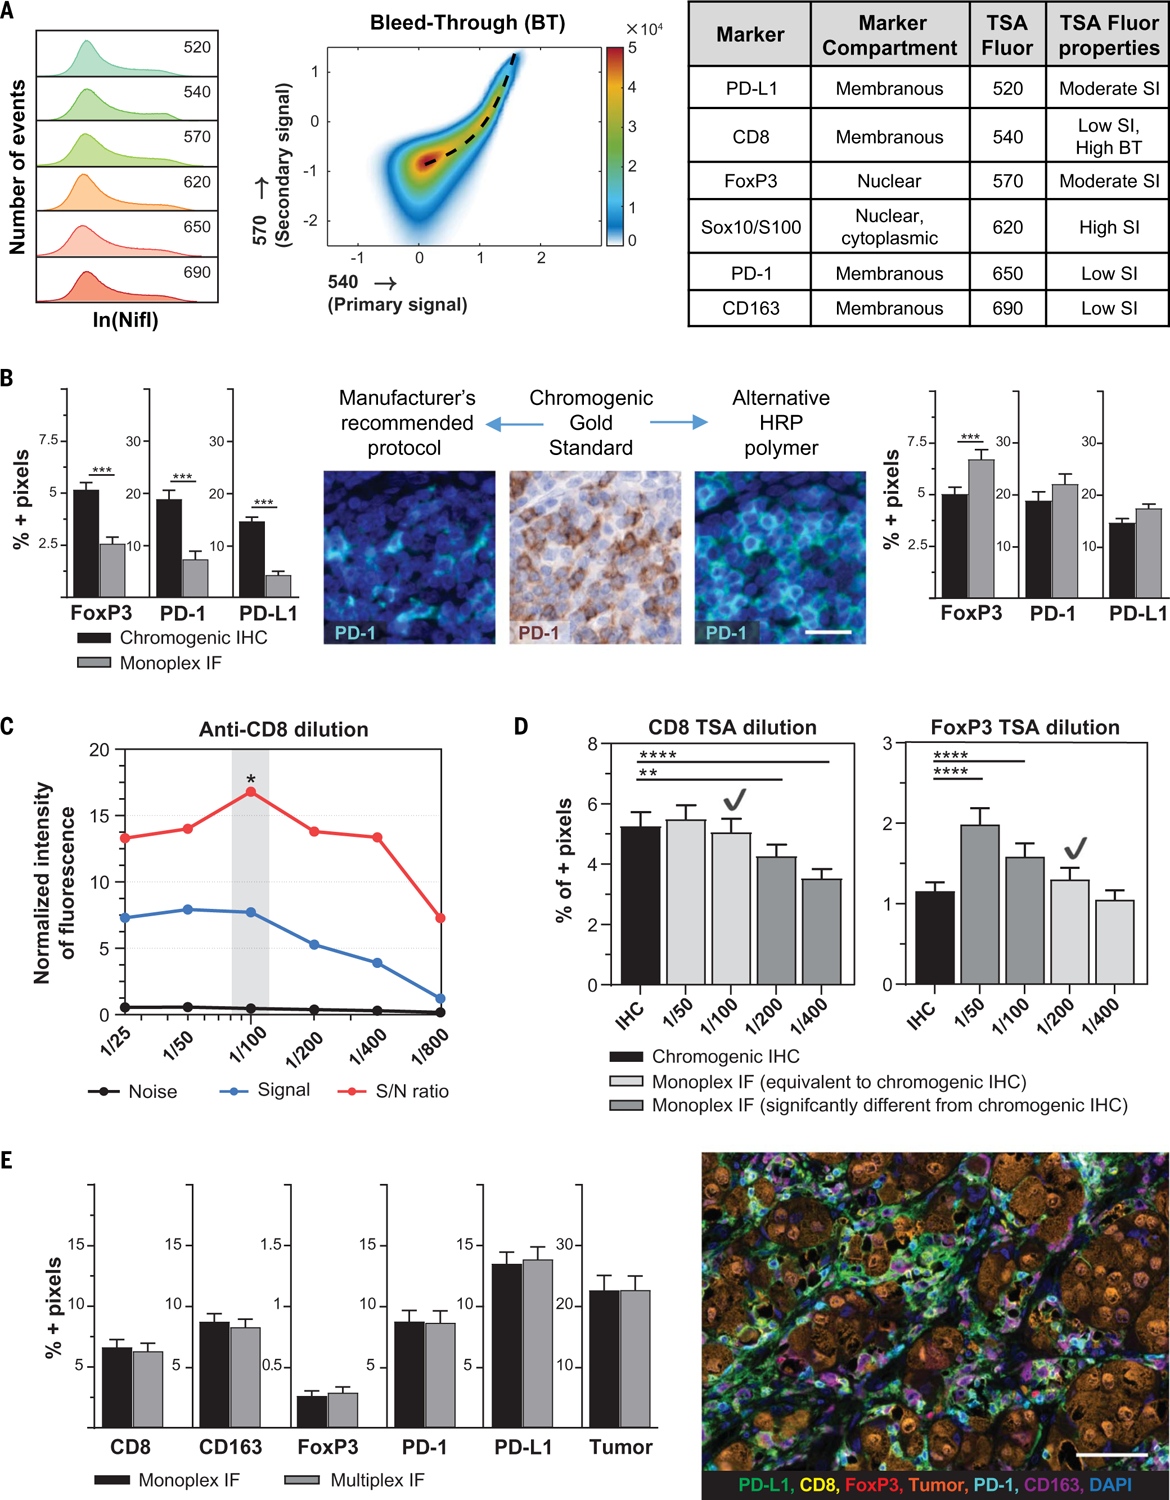
(A) Staining index (SI) and bleed-through (BT) propensity were used to inform TSA fluorophore-marker pairing. (B) Sensitivity of IF staining was compared with chromogenic IHC. The original signal was decreased in PD-1, PD-L1, and FoxP3 when using the manufacturer’s recommended protocol. The sensitivity was increased by replacing the secondary antibody. Scale bar, 25 μm. (C) Primary antibody dilutions were then performed to optimize the signal-to-noise (S/N) ratio. Representative figure for CD8 IF staining indicates that 1:100 is the optimal dilution. (D) The optimal concentration for each TSA fluorophore was determined next. Only dilutions with equivalent signal to chromogenic IHC (light gray bars) were considered to ensure sensitivity of the assay. To minimize BT between channels, the lowest acceptable TSA concentration was chosen for most markers (CD8/540 in this example). However, where a fluorophore-marker pair is prone to receive BT, the highest acceptable TSA concentration was chosen to raise the threshold of true positivity (for example, FoxP3/570). Check marks represent the dilution that was chosen. (E) For final validation, the detection of each marker in multiplex IF was compared with its respective monoplex IF, confirming equivalence. Photomicrograph shows representative image of optimized multiplex panel. Scale bar, 70 μm. *P ≤ 0.05, **P ≤ 0.01, ***P ≤ 0.001, ****P ≤ 0.0001.
In addition to careful assay optimization, we investigated the potential systematic biases in the imaging system. Controlling for such biases will be critical as large databases of tumor-immune maps composed of hundreds of millions of cells are compiled. The original intent of the microscope was for single HPF selection, and it met and exceeded the manufacturer’s stated specifications. We customized a routine to acquire whole slides with an average of 1300 HPFs in this context that has an absolute coordinate system at a submicrometer resolution, and we developed image-processing strategies with appreciably improved accuracy. This facilitates the alignment of multiple slides from the same tumor, other microscopes, and imaging data from other modalities (for example, scans from chromogenic IHC slides, tissue-based mass spectrometry, and even potentially harvesting spatially resolved single cells for genomic and transcriptomic analysis, or identifying all the “contact neighbors” of every cell in the database).
Biases that could affect robust assessments of marker intensity were of specific interest, in particular given the importance of measuring PD-1 and PD-L1 low, mid, and high expression on an individual cell basis across whole-slide images. Artifacts from the optical system were detected, including a lens curvature and illumination variation. Such errors affect each individual HPF, resulting in a high-frequency, repeating error (for reference, the median number of HPFs for the TME in a specimen in this study was ~300). To correct for these biases, we adopted an approach used in astronomy, in which each image acquired overlaps the adjacent images by 20% (Fig. 3A and fig. S6). The overlapping areas were used to quantify and correct the warping in the image corners due to the lens effect (Fig. 3B). The illumination variation in the Vectra 3.0 imaging system shows an off-center circular pattern (Fig. 3B and fig. S7A). We quantified the illumination intensity to have an 11.2% variation between the 5th and 95th percentiles of pixel intensity across an average HPF. A smooth model derived from an average of 11,508 HPFs was then used to correct each HPF image to reduce the variation to 1.2% (fig. S7, B and C), facilitating more accurate measurements of expression intensity of the imaged molecules in situ.
Fig. 3. Minimizing instrumental errors during field acquisition and stitching of whole slide by using lessons from astronomy.
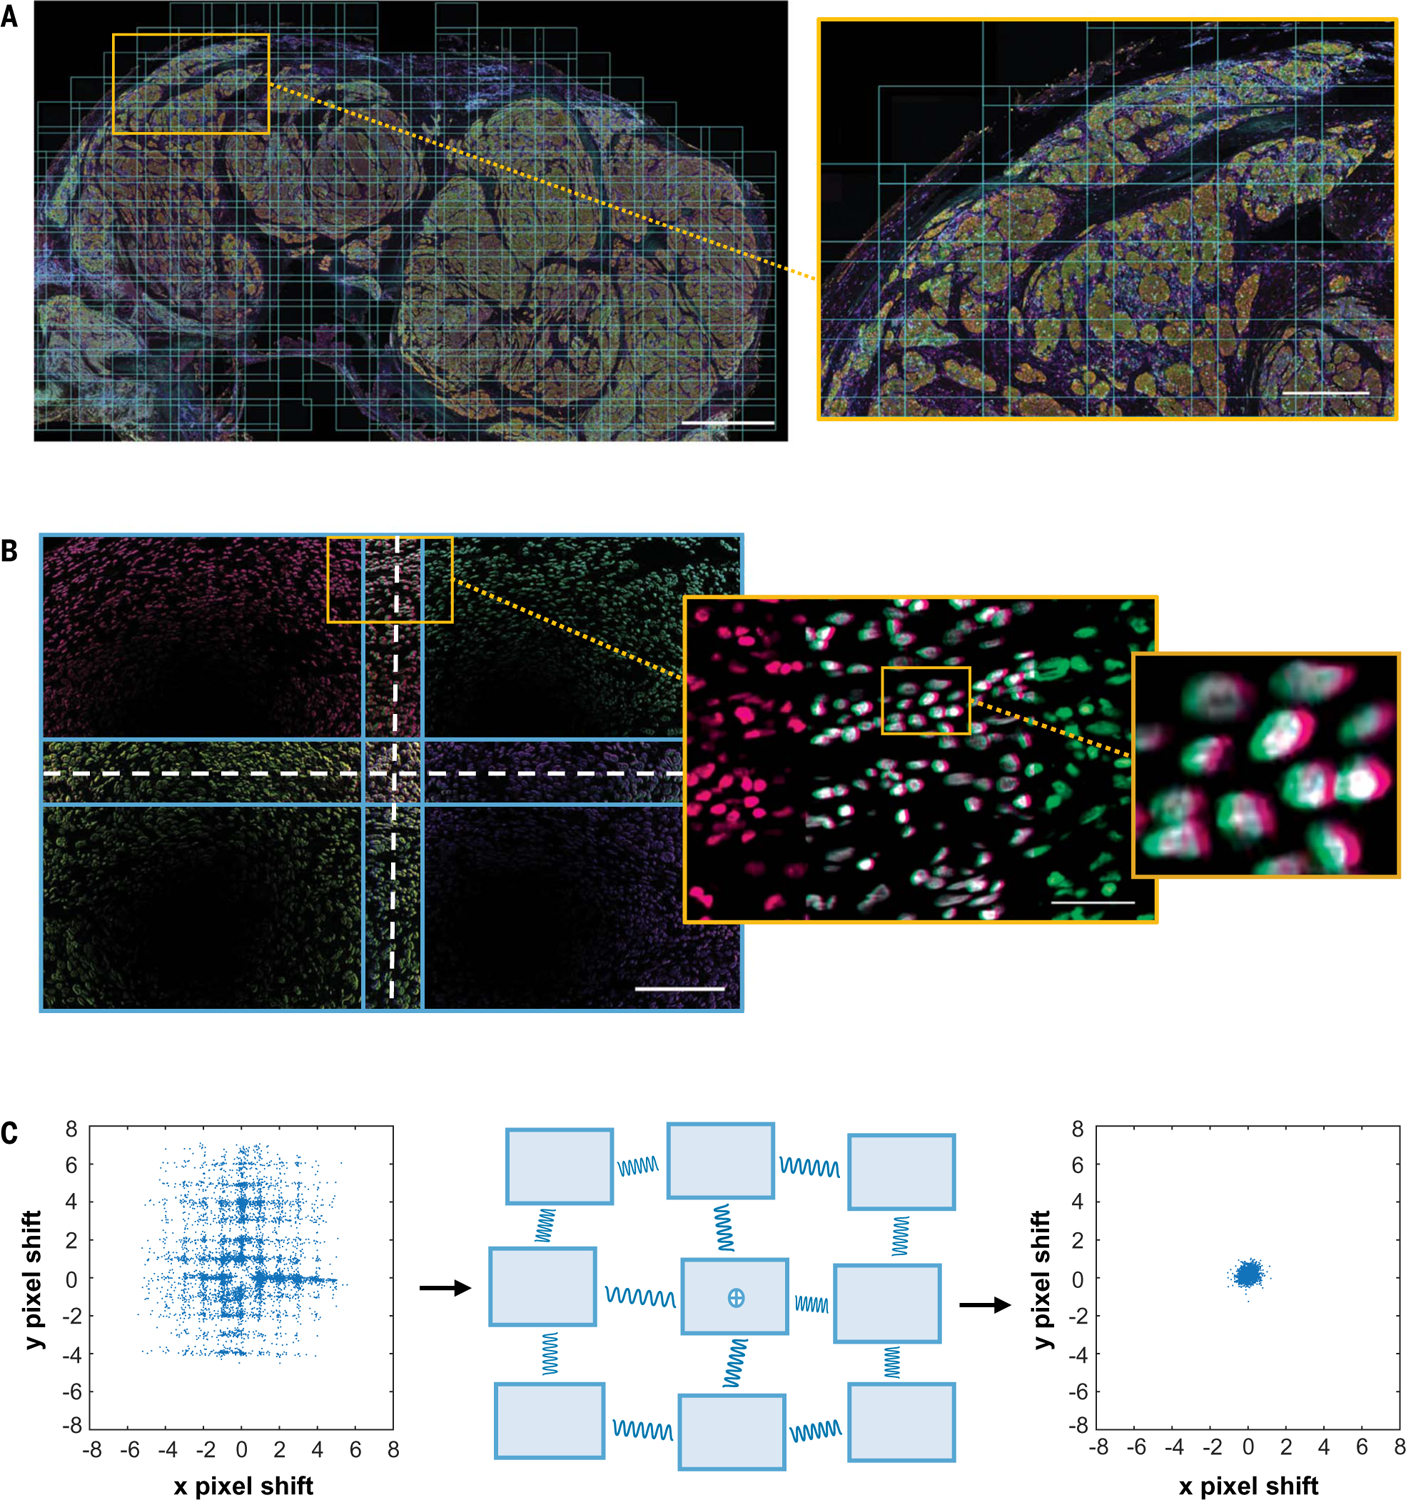
(A) The entire tissue of interest was captured by using HPFs with 20% overlap as shown in the low- and high-power images (average 1300 fields acquired per case). Scale bars, (left) 1.5 mm and (right) 1.0 mm. (B) Each HPF was found to have instrumental imaging errors, including lens distortion and variations in field illumination. Scale bars, (left) 200 μm and (right) 50 μm. (C) Pixels in overlapping image regions were compared to determine the field alignment error. To improve alignment, a spring-based model was used to minimize pixel shift. The misalignment error was reduced from ±3 pixels in the x direction and from ±5 pixels in the y direction, to less than ±1 pixel for both (ranges are reported for the 95th to 5th percentile). The illumination variation was also reduced, from 11.2% variance to 1.2% variance.
We next looked at the potential discontinuities associated when multiple HPF image tiles are assembled to image a whole slide. We observed a range of random misalignments from ±3 pixels in the x direction and ±5 pixels in the y direction, owing to local mechanical errors in stage movement. Incorrect stitching of the HPFs results in cells close to the field boundaries to be truncated, yielding incorrect shape and expression intensity estimates. This effect is proportional to the area of a stripe of a width of a typical cell radius around the perimeter of each field and can amount to ~5% of the total number of cells (fig. S8A). These errors can be mitigated by the 20% overlap in the layout of the HPFs described above. This overlap must be large enough that one can accurately register the adjacent images relative to one another. There is also a small offset in the optical scale of the microscope that results in an additional stretch of up to 40 μm across the entire slide (fig. S8, B and C). To correct for both of these, the information contained in the overlaps was also used to stitch the hundreds of HPFs together to create seamless whole-slide images. Specifically, we used a spring-based model to assist with field alignment, in which a single field is pinned down and the remaining fields are allowed to settle to minimize pixel shift in overlapping regions, reducing both the local and cumulative alignment error to <1 μm (Fig. 3C and Materials and methods) (22).
Once the HPF images were acquired and corrected, we developed an approach to improve cell segmentation and phenotyping. On the basis of our multiplex panel, we identified cell types, including CD163+ macrophages, CD8+ T cells, CD8−FoxP3+ regulatory T cells (Treg cells), tumor cells, and “other” (negative for these markers). Unexpectedly, we also identified a distinct CD8+FoxP3+ population. We found that standard segmentation algorithms processed all cells simultaneously using a “multimarker” approach and often erroneously divided larger cells into multiple cells (fig. S9). This resulted in an overestimation of the number of tumor cells and macrophages. To correct this, we tailored segmentation algorithms specifically designed to delineate the membranes of larger cells separate from those highlighting the smaller lymphocytes. After accurate cell segmentation, a “single-marker” approach to phenotyping was performed in which cells were assigned positive or negative status for each marker individually (fig. S10). Cell centers were then used to merge the individual phenotype sets into a master phenotype catalog with a universal Cartesian coordinate system (Materials and methods). The single-marker approach markedly improved segmentation and phenotyping of the larger cells, correcting the ~25% overestimation of the number of tumor and macrophages generated by the ready-to-use, standard multi-marker approach (fig. S9).
A second advantage of the single-marker phenotyping approach described here arises from the requirement to create training sets that include examples of all of the phenotypes of interest. Using the image analysis software as originally designed, it is theoretically possible to train on an unlimited number of possible phenotypes. However, (i) the number of phenotypes possible by various combinations of six markers would be very cumbersome to train, requiring training on ~20 different possible phenotypes, and (ii) when these phenotypes are rare, it can be very laborious to identify them in sufficient numbers for reliable training. By contrast, when using the single-marker approach, phenotyping algorithms defined by one marker at a time are run sequentially on the same imagery. Phenotypes are then defined by expression patterns for all markers after image analysis is performed by executing logic functions on exported data, so that training is performed for the six markers alone and phenotypes are resolved after processing. Thus, this approach makes it much easier to identify rare and/or unanticipated cell phenotypes or coexpression patterns.
Last, we were able to reduce batch effects, a common source of error when working with large data sets (23), by calibrating intensities of our lineage markers against tissue microarrays. This allowed for the subsequent calibration of PD-1 and PD-L1 intensities (fig. S11). The coefficient of variation across the six staining batches in this cohort was reduced by ~50% through this calibration strategy, thus allowing for considerably more accurate and reliable intensity comparisons between samples. Accuracy was improved by mitigating errors ranging from 3 to 50% at multiple steps in each of the phases of staining, imaging, cell identification, and batch-to-batch effects (Fig. 1 and tables S1 and S2). Many of these errors are independent of each other and thus prone to compounding.
Immune cell populations and PD-1 and PD-L1 expression vary by location within the TME
After the systematic optimization of staining and imaging, it was possible to reliably characterize cells with different PD-1 and PD-L1 expression intensities in situ (Fig. 4A). Specifically, the range of positive expression for these molecules was divided into tertiles and designated as low, medium, and high (fig. S12). This allowed us to study the spatial distribution of marker intensity, such as the relationship of PD-1 expression intensity on CD8+ cells as it relates to the tumor-stromal border. The highest density of CD8+PD-1− cells was present in the stroma, which is consistent with either naïve T cells or resting memory T cells that have not been exposed to antigen in the recent past (24). CD8+PD-1low, PD-1mid, and PD-1high cells were present in the stroma and at increasing densities in stromal regions adjacent to the tumor, whereas CD8+PD-1− cells showed a relative decrease at the tumor stromal margin. CD8+ cells within the tumor displayed a different pattern of PD-1 expression, with dramatic diminution of PD-1− cells and increasing intensity of PD-1 expression, which is consistent with increased direct exposure to antigen. We were also able to clearly identify PD-1 expression on CD8+FoxP3+ cells, which make up ~3% of the CD8+ cells within the TME. This incidence is consistent with previous flow cytometry reports on tumor digests (25, 26). These relatively rare cells have been proposed to represent tumor-reactive T lymphocytes at the earliest stage after priming (25–27). Consistent with that notion, they were highly localized to the tumor-stroma boundary (Fig. 4B).
Fig. 4. Immune cell populations and marker expression in situ vary by location.
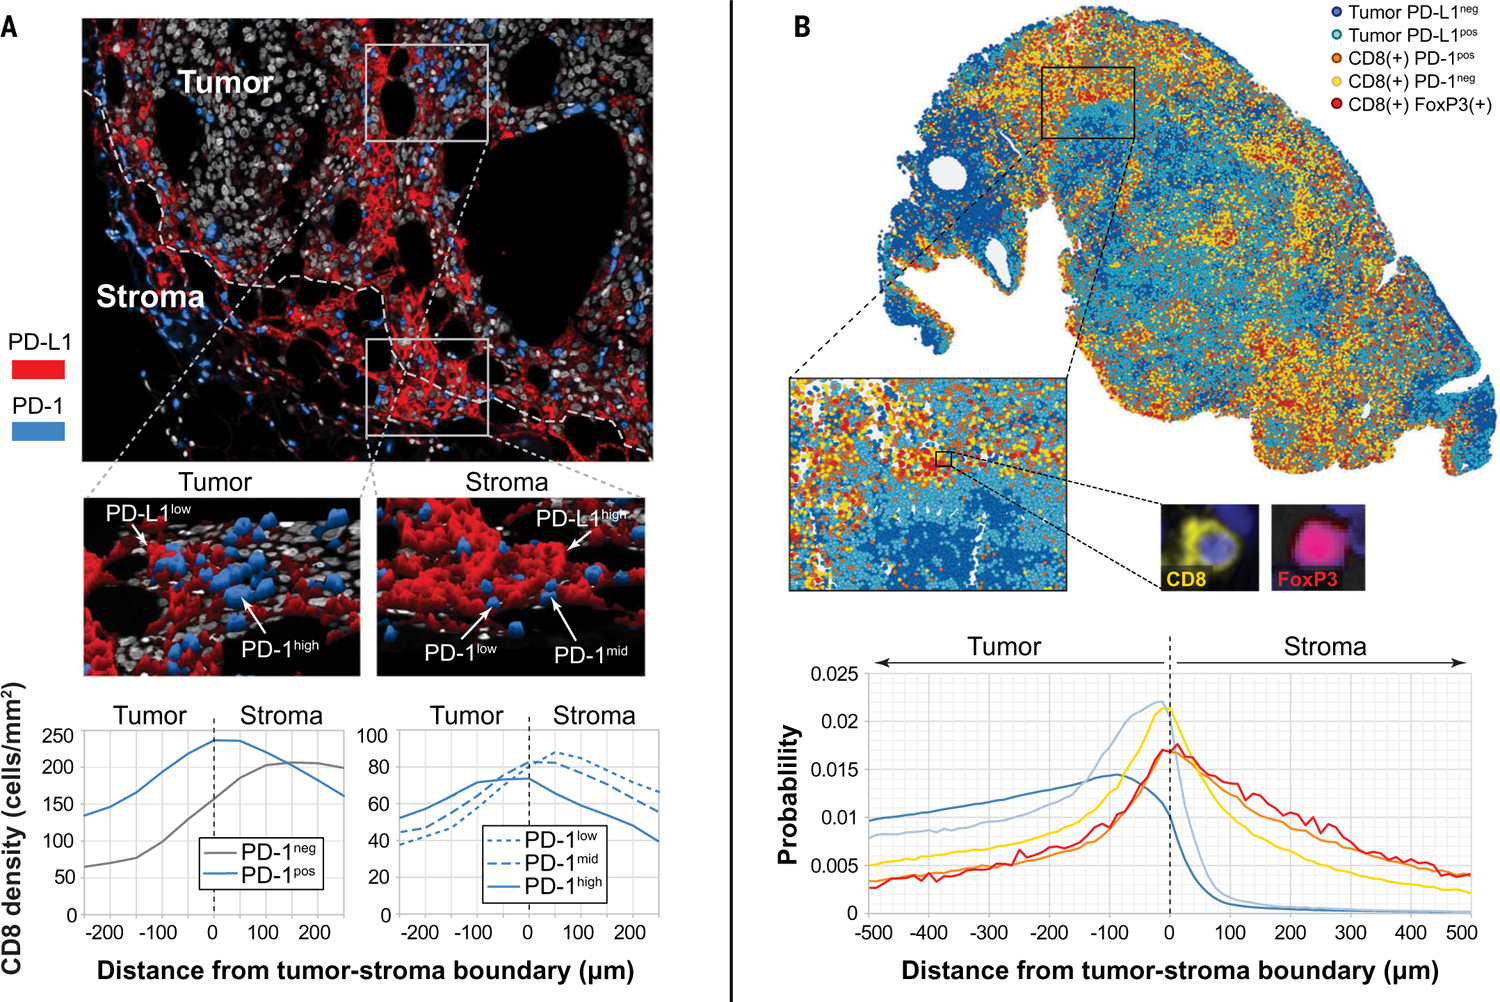
(A) Representative mIF image showing a hotspot at the edge of the tumor with PD-1low T cells adjacent to PD-L1high cells. Within the tumor parenchyma, PD-1high and PD-1mid cells were observed, adjacent to PD-L1low cells, which is consistent with a more exhausted T cell phenotype. Histograms including all cases in the cohort show cell densities of CD8+ cells displaying PD-1 as a function of distance to tumor boundary. PD-1 expression intensity increased as T cells were exposed to tumor antigen. (B) Representative image of a metastatic melanoma deposit showing localization of CD8+FoxP3+ cells in areas of dense CD8+PD-1neg and CD8+PD-1+ cell infiltrates, adjacent to tumor cells demonstrating adaptive (IFN-γ–driven) PD-L1 expression by tumor. Histograms including all cases in the cohort showed that CD8+FoxP3+ cells were most likely to be localized near CD8+PD-1− cells. Other cell types in the same relative location to the tumor-stromal boundary included CD8+PD-1+ cells and PD-L1+ tumor cells.
Achieving biomarker development for predicting response to anti–PD-1
Ultimately, the most clinically relevant application of immune imaging platforms is the prediction of clinical outcomes after immunotherapy. There are currently no FDA-approved companion or complementary diagnostics for patients with melanoma receiving anti–PD-1 or anti–PD-L1 therapies. Companion diagnostics for other tumor types use single-parameter chromogenic IHC and light microscopy interpreted visually by a pathologist to estimate the proportion of tumor cells and/or immune cells expressing PD-L1 within the TME, scored across the entire slide. When tested here, the PD-L1 22C3 chromogenic IHC assay scored for tumor cell expression (percent positive tumor cells) was not able to distinguish responders from nonresponders in a cohort of 53 patients with advanced, unresectable stage 3 or stage 4 melanoma treated with anti–PD-1–based therapy (fig. S13A). The six-plex mIF assay was next applied to the same melanoma specimens and imaged by using the AstroPath platform to test whether the total density of PD-L1+ cells, or the density of PD-L1+ tumor cells or CD163+ macrophages when assessed across the entire tumor section, were correlated with response to immunotherapy. The densities of total PD-L1+ and tumor PD-L1+ cells associated with response (P = 0.016, 0.0081, respectively), whereas CD163+PD-L1+ cells were not (fig. S13B). These findings highlight the benefit of computer-assisted cell density quantitation (number of cells per unit area) compared with a visual assessment of the proportion of positive cells for a given marker by a pathologist’s eye.
A major knowledge gap in mIF assay development surrounds the identification of critical areas and the overall proportion of the TME that need to be assessed to account for potential heterogeneity and to optimize predictive value. Using the image tiles acquired with the AstroPath imaging platform, we were able to execute operator-independent strategies of TME sampling to test these key variables for their correlation with tumor regression after immunotherapy. In both approaches, whole-slide data were acquired in an unbiased manner. In the first approach, image analysis was used to rank HPFs according to CD8+ cell density. An increasing number of HPFs were added, representing an increasing proportion of the TME sampled, starting with those with the highest CD8+ cell density; we refer to these as CD8 “‘hotspot” HPFs. In the second approach, a “representative” sampling of the TME was performed to add an increasing number of randomly selected HPFs, irrespective of the field’s cellular composition or location (central versus peripheral) in the tumor.
We next refined the analysis by assessing PD-1 or PD-L1 expression intensity on specific cellular subsets to determine whether this variable might allow for better clinical outcomes prediction. The specific subsets included T cells defined by CD8 (T effectors), FoxP3 (Treg cells or activated T cells), or a combination thereof, and also myeloid cells, defined by CD163. These were chosen because of the well-established roles of CD8+ cytotoxic T-lymphocytes, FoxP3+ Treg cells, conventional CD4+ cells (CD4 Tconv cells), and suppressive myeloid cells (CD163+ macrophages and myeloid-derived suppressive cells) as major factors in modulating antitumor immunity (28). In this analysis, ~86% of CD8−FoxP3−PD-1+ cells are considered to represent CD4 Tconv cells (fig. S14). Combining lineage markers and dividing PD-1 and PD-L1 expression into negative, low, mid, or high generated 36 coexpression features in addition to the original five markers that could be analyzed across specimens. We tested the association of these combinatorial features with objective response to anti–PD-1 using the two TME sampling strategies (Fig. 5). When PD-1 intensity on different cellular subsets was assessed, a gradient was observed for CD8+cells, in which CD8+PD-1− cells showed the strongest association with response, followed by CD8+PD-1low and CD8+PD-1mid cells. CD8+PD-1high showed no association with response, which is consistent with an exhausted phenotype after continued antigen exposure. Surprisingly, the relatively rare CD8+FoxP3+PD-1low/mid cell populations showed some of the strongest associations with response, with areas under the curve (AUCs) of 0.74 when ~10 to 30% of the TME was sampled (10%, P = 0.048; 30%, P = 0.036) (Fig. 5A). This peak was not as marked when a representative sampling strategy was used, with AUCs of ~0.70 at 30% sampling (P>0.05) (Fig. 5B). None of the CD8+ subsets were significantly associated with response after P value correction for multiple tests when the representative sampling was used. This highlights the potential benefit of strategic slide sampling strategies for optimizing signal-to-noise ratios for rare cell populations such as CD8+FoxP3+ cells within the TME. This may be further explained mathematically by using a formula, familiar in astronomy contexts, that describes the signal-to-noise ratio growing as the inverse square root of the noise present: . In this analogy, the “signal” and “noise” are HPF regions in the assay that do and do not contain CD8+ subsets, respectively. In other words, once the majority of CD8+ cells have been gathered, acquiring additional surface area of the TME that lacks CD8 infiltrates “dilutes” the discriminatory signal of CD8+ cell densities.
Fig. 5. AUC heat maps for response to therapy as a function of various immune cell types expressing PD-1/L1 and the intensity of PD-1/L1 expression by using two different slide-sampling strategies.
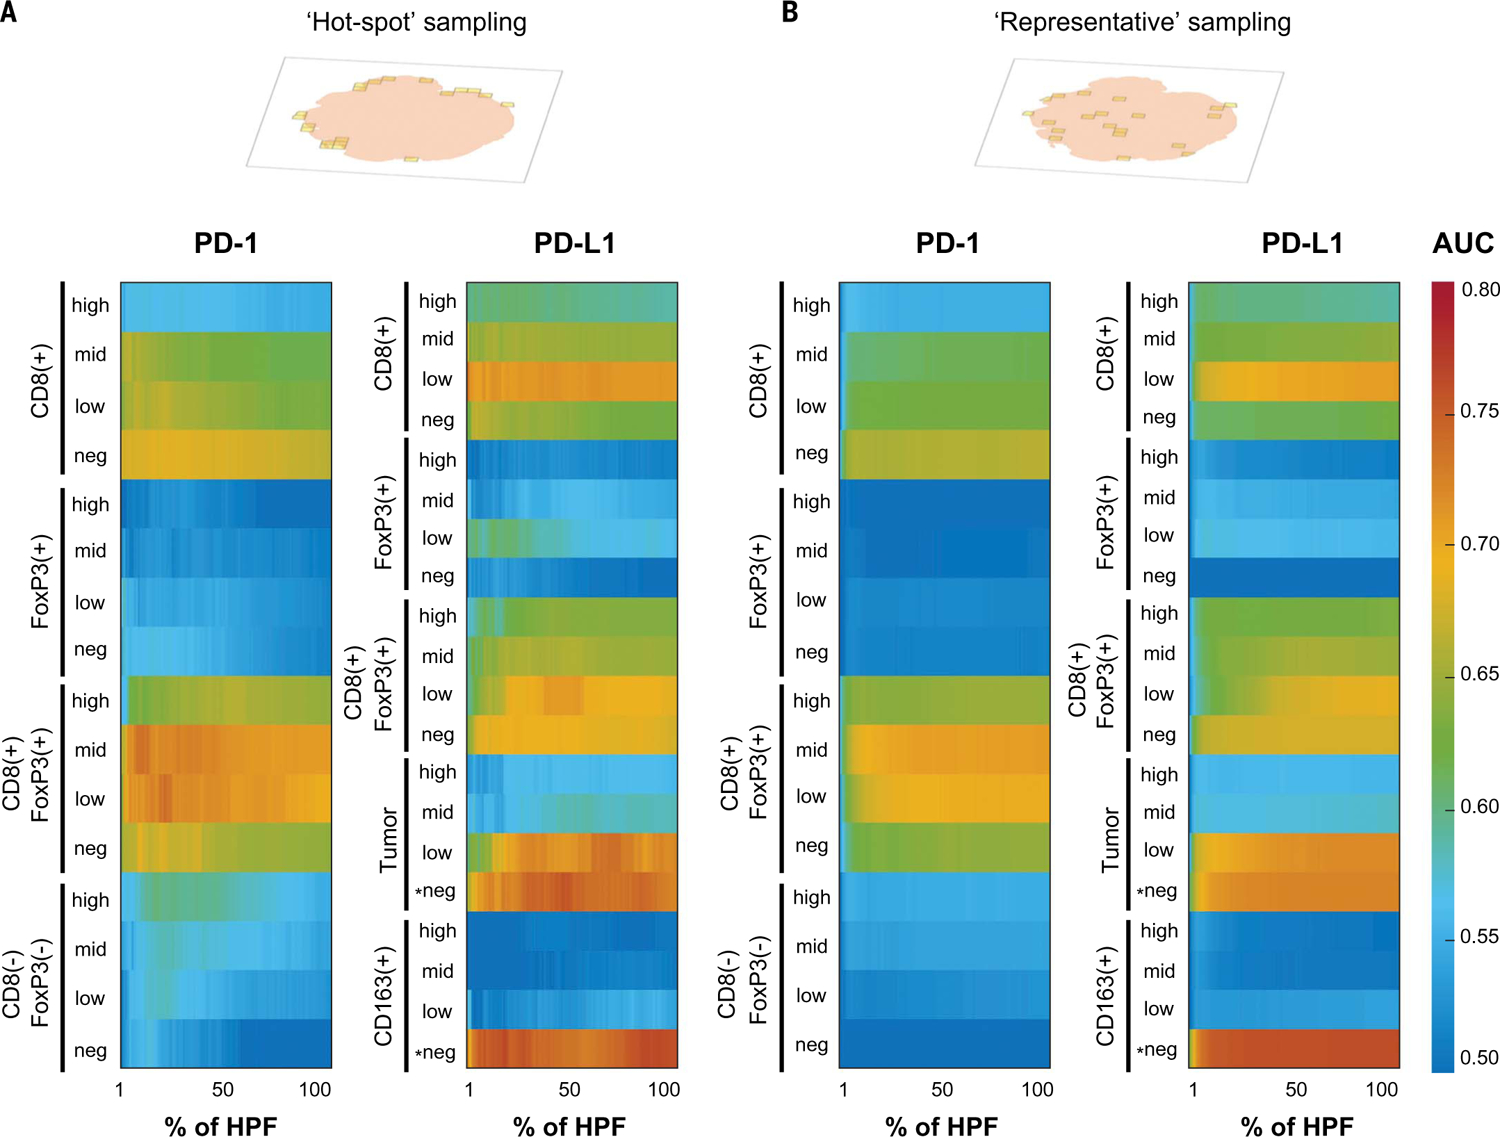
(A) PD-1/PD-L1 mIF assay combined with hotspot HPF selection showed that the densities of CD8+FoxP3+PD-1low/mid, tumor PD-L1−, and CD163+PD-L1− cells had the highest value of individual features for predicting response and nonresponse to anti–PD-1. Approximately 86% of CD8-FoxP3-PD-1pos cells in melanoma represented conventional CD4 T cells (fig. S14). (B) A similar characterization was performed by using representative field sampling and highlighted similar key features associated with response to therapy. However, the resultant AUCs, particularly for the CD8+ cell subsets, were not as high when using this approach. *Tumor PD-L1− and CD163+PD-L1− were negatively associated features; all others were positively associated features.
When PD-L1 intensity on different cellular subsets were assessed, CD8+FoxP3+PD-L1−/low, CD8+PD-L1low, and tumor cells that were PD-L1low were positively associated with therapeutic response, whereas CD163+PD-L1− cells and tumor cells that were PD-L1− were negatively associated with therapeutic response. Of these, the highest AUCs were for the “negative features”; for example, AUCs of ~0.73 to 76 were observed for the CD163+PD-L1− and tumor cell PD-L1− populations by using both the hotspot approach (at ~30 to 50% sampling) and the representative sampling approach (for example, CD163+PD-L1− at 30% sampling, P = 0.036; tumor PD-L1− at 50% sampling, P = 0.031) (Fig. 5). Tumor cell and/or “immune cell” expression (often equated with macrophages) of PD-L1 across the entire TME are the focus of most current companion diagnostics; however, our results suggest that the lack of expression in these populations may have higher predictive value. PD-L1low expression on CD8 T cells has a positive predictive value. This is likely because activated effector T cells up-regulate PD-L1.
Multifactorial analysis of mIF assay provides greater predictive accuracy
We then developed a combinatorial approach using all six markers in the mIF assay for predicting objective response in melanoma patients after immune checkpoint–blocking therapies. Inspection of the AUCs across the individual features helped us to select a 30% hotspot HPFs slide sampling strategy. Specifically, we studied the 10 features at 30% hotspot sampling associated with response by univariate analysis at P < 0.05 (Fig. 6A). We applied a logistic regression model to determine the accuracy of the combined features for predicting objective response, and the resultant AUC was 0.92 (Fig. 6B). This AUC was higher than when we tested combined features using data from the whole TME (fig. S15), indicating that slide sampling is also an element that can be optimized and standardized. This finding further supports the concept that strategic sampling of immunoactive hotspots for this combination of markers enhances predictive value. It is possible that assay performance could be further improved by using a different sampling strategy for each individual feature.
Fig. 6. Multifactorial analysis of six-plex mIF assay with a focus on PD-1 and PD-L1 intensities for predicting objective response and long-term survival.
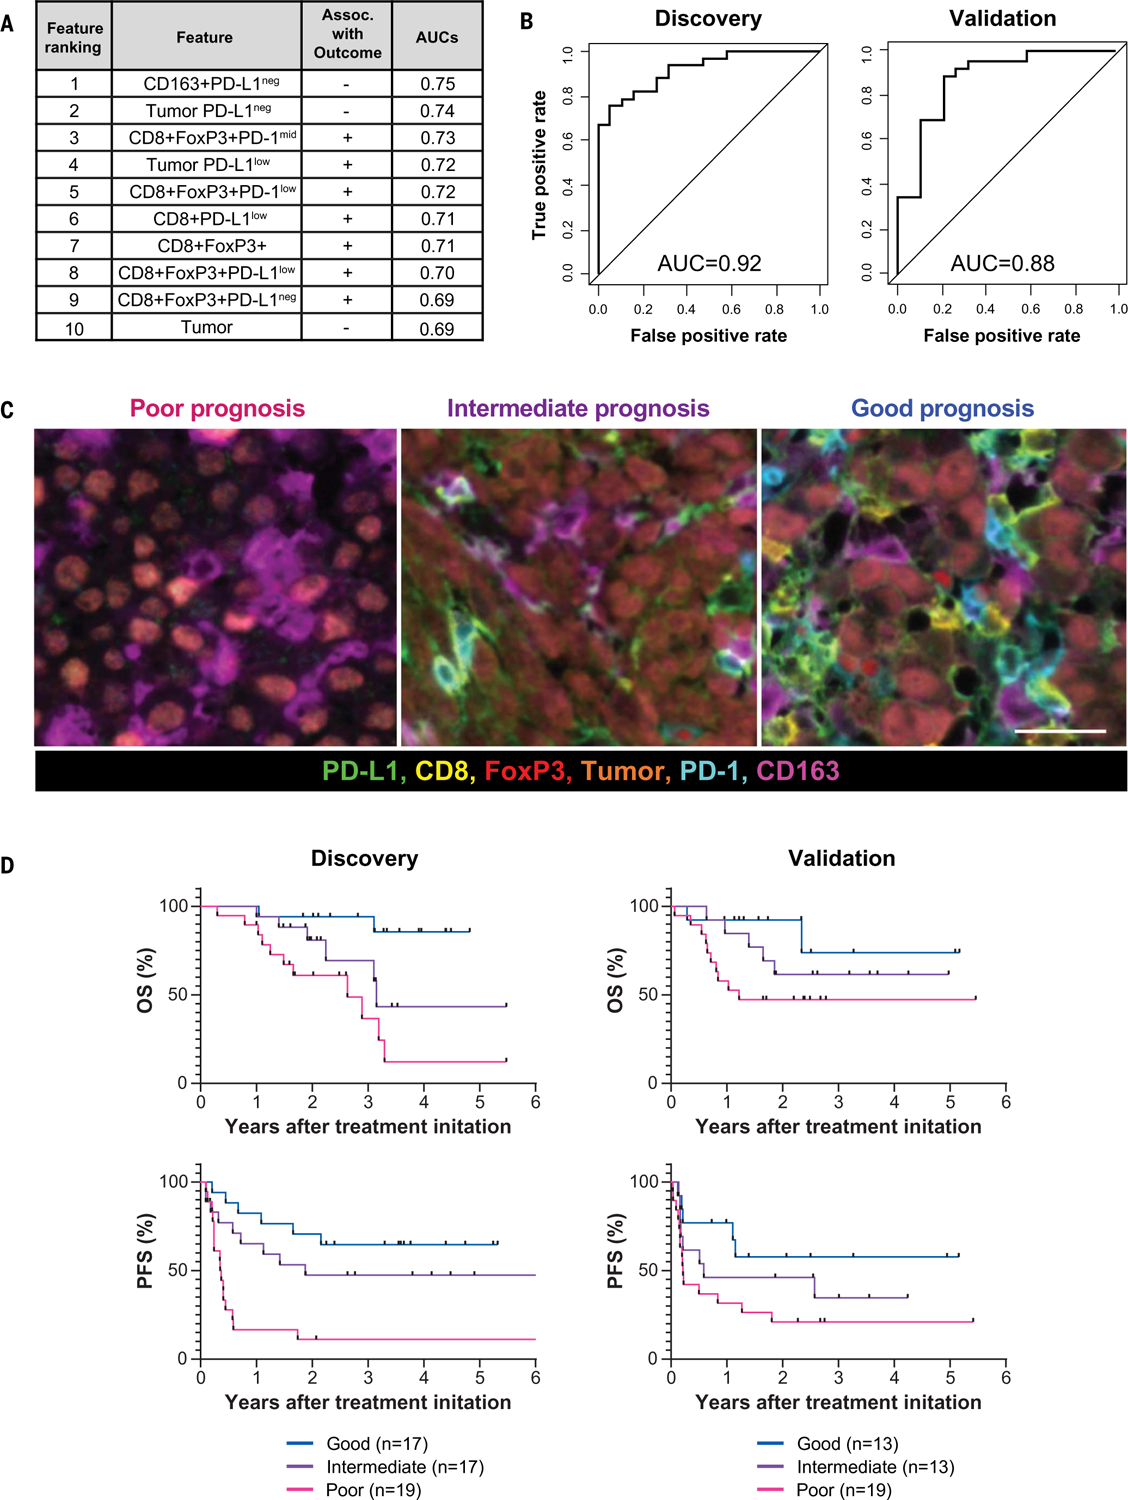
(A) The 10 features associated with response to therapy by univariate analysis at 30% hotspot HPFs. Features are listed in decreasing order of predictive value (table S3). (B) Combinatorial receiving operating characteristics (ROC) curves and the corresponding AUC values were assessed for these 10 features in the discovery cohort, as well as a second, independent cohort. (C) (Left) The TME from patients with poor prognosis was characterized by high densities of tumor cells and CD163+ cells that lack PD-L1 expression, irrespective of whether other immune cells were present. (Middle) Those with intermediate prognosis had TMEs with low level immune infiltrates and were not CD163+PD-L1neg myeloid-rich. (Right) The patients with the best prognosis had TMEs that were highly inflamed, characterized by CD8+ and CD8+FoxP3+ T cells expressing various PD-1 and PD-L1 intensities. PD-L1 expression was also evident on CD163+ cells. Scale bar, 20 μm. (D) Distinct TMEs defined by specific cell types displaying differing PD-1 and PD-L1 expression intensities stratified patients into those with poor, intermediate, and good overall survival (OS) and progression-free survival (PFS) in a discovery cohort, Kaplan-Meier analysis. Similar stratification of patient outcomes was achieved by using an independent, validation cohort from a different institution (OS, P = 0.036; PFS, P = 0.024, log-rank test). Similar analyses focused on the whole TME (100% sampling) are presented in fig. S15 and table S4.
To assess the predictive value of the key features on long-term survival, we assigned patients to three groups with characteristic cell coexpression phenotypes detected by the mIF assay (Fig. 6C): (i) those with the highest cell densities of one of the three negatively correlated features (CD163+PD-L1− cells and tumor cells, including PD-L1− tumor), irrespective of other factors; (ii) those with the highest densities of at least one of the seven positively correlated features (for example, CD8+FoxP3+PD-1low/mid and/or CD8+PD-L1low); and (iii) patients lacking either of these defining features. These groups then respectively segregated into those demonstrating poor, good, and intermediate prognoses for overall survival and progression-free survival (Fig. 6D). These findings were consistent in small biopsies as well as in larger resection specimens (fig. S16). The value of the six-plex assay for predicting objective response to therapy as well as the identification of these three prognostic groups were then validated by using a separate, independent cohort from a different academic institution (AUC for objective response = 0.88; OS, P = 0.036, PFS, P = 0.024, log-rank test) (Fig. 6, B and D). A four-plex version of the assay (CD8, CD163, PD-L1, and tumor) and also a six-plex version that did not include PD-1 and PD-L1 expression intensity groupings were also tested, and both were comparatively less effective at predicting response and stratifying patients when compared with the index six-plex mIF assay (figs. S17 and S18, respectively).
Discussion
Here, we present a detailed multistep platform for multispectral imaging of tissues that generates high-quality datasets at single-cell resolution for biomarker discovery and quantitative pathology to guide precision immunotherapy. Leveraging strategies originally developed to analyze astronomic observations at the 1022 meter scale to improve our microscopic image acquisition and associated analytics at the 10−6 meter scale, the AstroPath platform solves a number of common sources of error associated with tissue imaging. To accurately apply these image analysis programs, we had to develop specific staining protocols that generate consistent images, to which the imaging platform is applied. The resultant high-quality whole-slide multiplex image generation allowed us to map rare cell types with complex phenotypes such as CD8+FoxP3+PD-1+ T cells, characterize PD-1 and PD-L1 expression intensity in situ, and assess the biomarker value of these parameters and their spatial arrangements. AstroPath uses a scalable, reproducible, operator-independent approach to address important challenges regarding HPF sampling, which will be necessary for the development of standardized, multidimensional pathology diagnostics to guide therapeutic decisions in the rapidly growing field of precision immuno-oncology.
Differential PD-1 expression on CD8 cells is indicative of T cell activation status. PD-1−, PD-1low, PD-1mid, and PD-1high T cells in lymphocytic choriomeningitis virus (LCMV) mouse models are associated with naïve, short-term memory, activated effector, and hyper-exhausted effector T cells, respectively (15). In this model, the PD-1low and PD-1mid populations have greater proliferative potential and are more “recoverable” with PD-1/PD-L1 blockade than are PD-1high cells (29, 30). We assessed PD-1 expression intensity in human, pretreatment melanoma formalin-fixed paraffin-embedded (FFPE) tissues, and our findings corroborate findings from in vivo animal models. Specifically, we show that PD-1 expression increases as lymphocytes enter the tumor, which is consistent with increased antigen exposure and activation. Further, we demonstrate that among CD8+PD-1+ cells, PD-1low/mid are most strongly associated with response to anti–PD-1. Our findings differ from a previous human study in non–small-cell lung cancer, which indicated that CD8+PD-1high lymphocytes associated with anti–PD-1 response (31). This difference may be due to the tumor type studied or the methodology used to define PD-1 low versus mid versus high groups. Among other things, that study only identified PD-1−, PD-1low, and PD-1high subpopulations, and it is possible that cells classified as PD-1mid in this study were grouped with PD-1high in that study. Other differences include our assessment of our findings in situ as opposed to performing flow cytometry on a tumor digest. Larger cohorts will be required to confirm diagnostically meaningful thresholds for PD-1 expression groups in tumor tissues. Additional markers such as T-bet, Eomesoder-min, and/or LAG-3 in combination with cell-line tissue microarrays that express PD-1 at known intensities or concentrations could potentially be used to validate and standardize PD-1 thresholds that define distinct T cell phenotypes or subsets in situ (15, 32–34).
We found the density of CD8+FoxP3+ cells to be closely associated with a positive response to anti–PD-1 therapy. Some reports suggest that these cells can function as suppressors; however, more recent studies indicate that they represent activated T cells that can differentiate into nonexhausted tumor-specific effector cells with strong proliferative potential, IFN-γ production, and killing activity. Specifically, reports characterizing the functional properties of this population have highlighted that the cytotoxic potential (perforin and/or granzyme) and cytokine polyfunctionality (interleukin-2, IFN-γ, and/or tumor necrosis factor–α) is increased as compared with their CD8+FoxP3− counterparts (25–27, 35). Given that most of the PD-L1 expression in melanoma is through the classic adaptive resistance mechanism of IFN-γ production by activated T cells in the TME (36, 37), such functionality is compatible with the strong localization of CD8+FoxP3+ cells adjacent to peripheral tumor regions that are strongly PD-L1+.
We also identified a CD163+PD-L1− myeloid phenotype that was associated with a lack of response to therapy. A similar cell phenotype has been described in patients with pancreatic and head and neck squamous cell carcinomas (38). This cell type, when combined with a high density of tumor cells lacking PD-L1 expression, was able to specifically identify a subset of patients with the poorest long-term outcomes, potentially allowing for selection of an alternate therapeutic regimen (39). Once this poor prognostic group was identified, the remainder of the patients could be stratified into those with good and intermediate prognosis by using the positive prognostic features identified by the current assay. Specifically, we used the highest densities for any of the positive factors (for example, CD8+ cells, or subsets such as CD8+PD-L1low or FoxP3+CD8+PD-1low/mid). Future efforts should focus on improved resolution of the intermediate prognostic group and, among other things, should include characterization of tumor-draining lymph nodes, given their potential role in anti–PD-1 responses (40).
Whereas CD8+ subsets inform our understanding of mechanism of action of these agents and associated T cell biology, a distilled panel of markers providing comparable prognostic accuracy is desirable for clinical assays. We considered whether we could potentially reduce the number of core assay markers from six to four. A reduced number of markers could ease cross-site standardization and reproducibility during clinical implementation. We found that total CD8+ cell densities were less effective at predicting response and stratifying patients with good versus intermediate prognosis than when select CD8+ T cell subsets were quantified using the six-plex. Nonetheless, a potential reduction to these four markers is still of interest because it could allow for the inclusion of other parameters, which may provide substantial additive information regarding patient outcomes. Additional markers that could be explored for inclusion in future mIF assays include those for antigen presentation, myeloid, dendritic, or natural killer (NK) or B cell markers, other immune checkpoints, or proliferation markers, among others (38, 39, 41–47). Further, it may also be possible to include a marker that could facilitate a more streamlined workflow—for example, a pan-membrane stain to assist cell segmentation algorithms and potentially obviate the need for single-marker phenotyping.
One aspect of the slide imaging strategy described here is the unbiased acquisition of the entire TME followed by standardized selection of discrete HPFs. This approach facilitates the characterization of optimal tissue sampling for a given biomarker. For example, the association of CD8+FoxP3+PD-1low/mid cell densities with response was most clearly demonstrated after the entire slide was scanned, CD8+ cell densities were calculated per HPF for the entire TME, and at least 10% of the highest hotspot fields were assessed. This correlates to a median of ~20 HPFs. Previous studies using multispectral mIF to characterize the TME in meaningfully sized cohorts have typically evaluated ~5 to 10 manually selected HPFs per sample by using either subjectively identified hotspots or a deliberate sampling of heterogeneous TME regions (8–10). These approaches have been used empirically and are operator-dependent. Our findings suggest that for the panel tested here, those approaches likely provide an insufficient description of the TME. The idea of incrementally assessing field selection and associated specimen adequacy has not been previously addressed for tissue-based biomarkers for immuno-oncology in a rational way. Leveraging the whole-slide data to identify the optimal subsampling strategy allows refinement of candidate biomarkers and the development of more efficient and robust clinical diagnostic assays.
As the immuno-oncology field moves beyond proof-of-principle tissue-based multiplexing studies, there is a risk that large volumes of data will be generated by using multiplex as-says and associated microscopes that may not be comparable across research programs. The detailed multistep approach to multiplex staining and imaging handling described here will help support the standardization of results across the large, multi-institutional datasets that will be prerequisites for clinical implementation. For example, staining sensitivity was benchmarked to chromogenic IHC, and a single-marker digital image analysis strategy for cell segmentation was implemented to ensure that the multiplex assay output reflected the “ground truth,” single-marker analysis. Systematic characterization of the entire system, from the fluorophores used to the image sampling strategies, allowed for the measurement and mitigation of errors at each step. As such, this effort provides a framework for assay development and associated data quality standards for multispectral IF, as well as related multiplexing technologies. It is possible that commercial solutions to some of the errors identified here will become available through continued technology development, although those are likely to be focused on standardization within an individual platform. By contrast, the approach described here allows for the modular integration of different commercial or open-source offerings at multiple points within the AstroPath platform, provided they adhere to a universal performance standard.
Universal standards also facilitate scaling out and up, which will be of particular interest as tumor-immune atlases are generated that include multiplex IF-IHC maps of thousands of slides across multiple tumor types. We captured individual cells, their immunoactive marker expression, and associated positions within tissue and calibrated them carefully because in the studies of the TME, coexpression analyses on single cells as well as relative proximities are extremely important. The individual tiles used to image whole slides were each corrected for systematic errors such as illumination variation and lens distortions. The corrected images were then used to compensate for small errors in the mechanical stage positioning in order to build an absolute coordinate system for the whole slide, similar to approaches used in astronomy for mapping the sky. In the future, such approaches will enable the integration of whole-slide output from multiple microscopes run in parallel. It will also facilitate the assessment of multiple slides from the same tumor, by using the same or different slide imaging technologies. The database architecture was also designed with data consistency, modularity, and parallelism in mind. The metadata files were organized in a rigid file hierarchy, consisting of cohorts, projects, slides, controls, batches, and other information. This organization allowed us to readily automate most parts of the platform; for example, we designed the single-marker phenotyping merging software to automatically run off industry-standard output files. Additional gains in scale will be aided by further automation.
The whole-slide protein-based profiling by using multispectral IF as performed here is computationally equivalent to whole-genome sequencing. Specifically, one mIF panel of six markers generates approximately 50 GB of data. After processing, the raw data are on par with sequencing a full human genome with 30× coverage on an Illumina platform. The total data volumes for the discovery and validation cohorts here amounted to 5 TB of raw imaging data, which expanded during processing to 43 TB and was composed of 2.5 million individual files and 7545 folders. The final volume of the calibrated data in the database for analysis is 0.5 TB. Until recently, technical challenges coupled with insufficient computing capacity and analytic strategies have limited the application of this emerging technology. Scaling up to whole-slide analysis was achieved by combining a robust hardware infrastructure with a systematic reduction of errors that would otherwise be compounded when generating large datasets. Specifically, expertise developed in the field of astronomy was leveraged to build a relational database linking geographically resolved single-cell proteomic data with annotated, whole-slide mIF images and clinical information to enable integrated analyses. The resultant AstroPath platform demonstrates the feasibility of building and querying an integrated database from whole-slide mIF data. Such architectures will underpin future, open-source, tumor-immune atlases with billions of spatially mapped single cells, enabling analyses at unprecedented scales.
Materials and methods
Case selection
Staining optimization of the mIF assays was performed on archival, FFPE sections of tonsil and melanoma. Once the index mIF assay (PD-1, PD-L1, CD8, FoxP3, CD163, S100/Sox10) was optimized, a retrospective analysis was performed on a discovery cohort of pre-treatment FFPE tumor specimens from 53 patients with metastatic melanoma who went on to receive anti-PD-1-based therapy. Thirty-four patients received anti-PD-1 monotherapy (nivolumab or pembrolizumab) and 19 patients received dual anti-PD-1/CTLA-4 blocking therapy (nivolumab and ipilimumab). Patients were classified as responders (complete response or partial response) or non-responders on the basis of RECIST 1.1 criteria. 5-year overall and progression free survival information was also determined. Additional clinicopathologic characteristics of the cohort were also collected, such as age, sex, and stage of disease (table S5). A single representative FFPE block was chosen from each patient specimen for mIF staining. The PD-L1 IHC companion diagnostic assay (22C3) was also performed on these specimens. An independent validation cohort of pre-treatment FFPE tumor specimens from 45 patients with metastatic melanoma was also studied, (table S6). The cohorts differed slightly in whether patients had received immunotherapy prior to anti-PD-1-based therapy and whether patients received BRAF inhibitor therapy if they progressed on anti-PD-1.
The optimized 6-plex mIF assay was applied to the specimens from the discovery and validation cohorts and correlated with objective response and long-term survival. Cases in both the cohorts were reviewed by a board-certified dermatopathologist (JMT or IBS) to confirm the diagnosis of melanoma. Cases with less than 5 mm of tumor on the slide, those with extensive necrosis or folded tissue, or those of a pure desmoplastic histologic subtype were excluded from analysis.
A separate tissue microarray (TMA) was used to characterize the lymphocyte subsets expressing PD-1 in the melanoma TME, using a second mIF assay (PD-1, CD8, CD4, CD20, FoxP3 and Sox10/S100). The TMA contained tissue from ninety-four patients with metastatic melanoma. A single representative FFPE block from each tumor specimen was chosen for inclusion in the tissue microarray. Six 1.2 mm cores were taken from each block representing both the central and peripheral areas of the tumor and tiled in a tissue microarray format. The resultant TMAs were reviewed, and cores with tissue folds, excessive necrosis, and/or <10% surface area occupied by tumor cells were excluded from analysis.
The study was performed in accordance with Johns Hopkins University and Yale University IRB approvals. The discovery cohort was from Johns Hopkins and used tissue collected under protocols # NA_00085595 and 00090257. The tissue assessed in the validation cohort was obtained from the Yale Pathology Archives based on Yale Human Investigation Committee protocols #9505008219, #0304025173 and #0003011706. These protocols allow for the retrieval of tissue from archives from consenting patients or were approved for use with waiver of consent.
Reagents and Multispectral Microscope
Fluorophore reagents and multiplex staining
FFPE slides were stained using tyramide signal amplification (TSA) technology in order to achieve superior amplification and higher plexing compared to standard IF detection (fig. S1). In comparison to detection of primary antibodies with directly labeled secondary antibodies, TSA technology utilizes HRP-polymer secondary mediated detection. A single HRP-polymer secondary can catalyze the activation of several fluorophore labeled tyramides (TSA fluorophore). Following activation, the TSA fluorophores can covalently bind to surrounding tyrosine residues and remain deposited on the tissue during heat treatment steps that strip off primary and secondary antibodies. By employing sequential rounds of staining and stripping, we labeled 6 markers plus 4′,6-diamidino-2-phenylindole (DAPI) on a single FFPE tissue section.
Slide scanning and multispectral unmixing
Images were scanned with the Vectra 3.0 Automated Quantitative Pathology Imaging System (Akoya Biosciences) and processed using digital image analysis software, inForm (Ver 2.3, Akoya Biosciences). A schematic of the multispectral imaging microscope system is shown in fig. S2. The system captures 20X multispectral images consisting of a multi-layer image ‘cube’ of 35 image planes. These planes correspond to the wavelengths selected by the liquid crystal tunable filter, acquired across the visible light spectrum. Images of multiplex stained samples are then unmixed, using an inverse least squares fitting approach that minimizes the square difference between the measured and the characteristic emission spectrum of each fluorophore (see below). Unmixing separates the autofluoresence and the overlapping emission signals of each fluorophore, thus removing autofluoresence background and creating eight signal specific ‘component’ planes; one for each fluorophore plus DAPI and autofluoresence.
In order to unmix the multispectral image cube, the known characteristic emission spectra of the TSA fluorophores, DAPI, and a spectrum representative of the background autofluoresence are used to generate an unmixing library. To acquire the pure spectra for the library, 4 μm thick FFPE tonsil sections were stained with anti-CD20 (dilution 1:400, clone L26 Leica microsystems) by monoplex IF (“Monoplex IF” section) with each fluorophore. The TSA concentrations were adjusted to obtain pixel normalized fluorescence intensity (NFI) counts of 10 to 15 for each TSA fluorophore (520 1:150, 540 1:500, 570 1:200, 620 1:150, 650 1:200, 690 1:50). DAPI was not added at the end of the protocol. One tonsil section was stained with DAPI alone to extract the DAPI spectrum while the autofluorescence spectrum was extracted from an unstained slide of the tissue of interest. The slides were imaged and the spectra extracted in inForm using automated tools for library creation. Similarly, for spectral unmixing of chromogenic stains, a spectral library of DAB and hematoxylin was used.
Staining optimization
During the staining process, sources of potential error arise when signal is not fully detected or when false positive signal is detected in a given channel due to spillover from a different channel, a.k.a. ‘bleed-through’. The design and optimization of the 6-plex panel therefore involved (i) determination of a staining index (SI) for each fluorophore and pairing of TSA fluorophores with markers based on bleed-through calculation, (ii) selection of secondary/amplification reagents, as well as selection of the concentration of (iii) primary antibody and (iv) fluorophores for maximal sensitivity and specificity. The final step is the combination of all the optimized monoplex protocols into the multiplex assay format such that equivalent staining is achieved for each marker between 6-plex mIF, monoplex IF, and single stain chromogenic IHC (Fig. 2 and table S1).
Characterizing TSA fluorophores—Staining index (SI), bleed-through (BT), and marker pairing
To explore fluorophore staining indices, sequential slides from five archival tonsil specimens were stained by monoplex IF with anti-CD8 (dilution 1:100) and each TSA fluorophore at dilution 1:50. Single-cell data were exported from inForm. The SI was calculated as the difference between the mean fluorescence intensity of the positive and negative cell populations divided by two standard deviations of the negative population.
The same tonsil specimens were used to characterize bleed-through or spillover of fluorophore emission spectra, a frequent limitation of multiparametric fluorescent methods. Pairwise dot plots of the logarithm of normalized fluorescence intensity counts were created for all channels. We consistently observed a linear relationship at low intensity counts and an exponential relationship at high intensities (fig. S3). In order to account for this duality we parameterized a hyperbolic sine curve and fit it to each paired dataset using a non-linear least squares model. To improve the accuracy of the fit we removed outliers in the noise population. We then inverted the data and centered it about the median of the original noise. The propensity of BT was then calculated as the linear term * the non-linear term of the fitted curve.
The SI and bleed-through information was then used to pair TSA fluorophores with markers (Fig. 2A). For example, a fluorophore with high SI was paired with a marker with lower intensity expression, e.g., TSA fluorophore 520 and PD-L1. Fluorophore pairs “at risk” for bleed-through were assigned to markers found in different cellular compartments, allowing any potential bleed-through to be removed during image analysis, e.g., CD8, a membrane stain, was paired with TSA fluorophore 540, while FoxP3, a nuclear stain, was paired with TSA fluorophore 570.
Chromogenic staining
Four-micron thick sections were stained individually for CD8, CD163, PD-1, PD-L1, FoxP3, Sox10, S100 and a Sox10/S100 cocktail. Briefly, slides were deparaffinized, rehydrated, and subjected to heat-induced epitope retrieval (HIER) in pH 6 target antigen retrieval buffer (S1699, Dako) for 10 min at 120°C (Decloaking chamber, Biocare Medical). Blocking for endogenous peroxidase (3% H2O2, H325–500, Fisher Scientific) and protein (ACE Block, BUF029, Bio-Rad) was performed. For the protocols using a biotinylated secondary antibody, endogenous biotin was also blocked (Avidin/Biotin Blocking Kit, SP-2001, Vector Labs). Primary antibodies were incubated at 4°C for 22 hours, followed by secondary antibodies at room temperature (RT) for 30 min, as noted in table S7. For the protocols using a biotinylated secondary antibody, a tyramide signal amplification (TSA) system was used as described previously (13). Antigen-antibody binding was visualized with the use of 3,3′-diaminobenzidine (D4293, Sigma). Slides were counterstained with hematoxylin and coverslipped (VectaMount, H-5000, VectorLabs).
Monoplex IF
Monoplex IF staining was performed on sequential slides, 3 tonsils and melanomas (the latter for Sox10 and S100), to titrate each primary antibody (table S8). Briefly, slides were deparaffinized and subjected to microwave HIER (Haier 1000W) in pH 9 followed by pH 6 buffer (AR900 and AR600, respectively, Akoya Biosciences) for 45 s at 100% power and 15 min at 20% power. Endogenous peroxidase removal (3% H2O2, H325–500, Fisher) and protein blocking (Antibody Diluent Background Reducing, S3022, Dako) were performed followed by primary antibody incubations at RT, starting at double the optimal concentration used for chromogenic staining and serially diluting. All secondary antibodies were incubated for 10 min at RT. The TSA fluorophore (Opal 7 color kit, NEL811001KT, Akoya Biosciences) paired with a given marker was then applied for 10 min. A final microwave step was performed at pH 6, slides were stained with DAPI (Opal 7 color kit, NEL811001KT, Akoya Biosciences) and coverslipped (ProLong Diamond Antifade Mountant, P36970, Life Technologies). For comparison of primary titrations we selected 10 corresponding high power fields (HPFs) for each dilution and evaluated the signal to noise ratio (SNR) using both pixel-based and cell-based approaches (fig. S4A and section “Approaches to signal quantification”). Ten corresponding HPFs were also chosen for comparison to chromogenic IHC. HPFs were specifically chosen to capture a broad dynamic range of PD-1 and PD-L1 expression (fig. S12).
Evaluation of the secondary antibody/amplification reagent is a key optimization step early in the process. If this step is left until later in panel optimization, it may not be possible to achieve comparable staining levels to chromogenic IHC for certain markers. For example, when using a ‘less powerful’ secondary antibody/HRP polymer system, only 50% of PD-1 expressing cells were identified compared to chromogenic IHC (Fig. 2B). Specifically, the assay was only sensitive enough to detect cells expressing PD-1 at high intensities, which may only represent the ‘exhausted’ subset that may not be recoverable by anti-PD-1 therapy (7). PD-L1 and FoxP3 also showed lower levels of expression, while all other markers showed comparable staining between monoplex IF and chromogenic IHC. To address the relative loss of detection of PD-1, PD-L1, and FoxP3, different components of the assay were modified, including the primary and secondary antibody reagents, incubation times, and different amplification methods. A new secondary antibody (PowerVision Poly-HRP, 1:1 dilution, Leica Biosystems) improved the assay sensitivity for these markers (Fig. 2B) and thus was adopted for PD-1, PD-L1, and FoxP3 in the panel. Importantly, we found that it was key to select the secondary antibody for each marker prior to primary antibody or TSA dilution optimization.
The primary antibody concentration is determined next (Fig. 2C and fig. S4), followed by selection of the TSA concentration for each fluorophore (Fig. 2D). These latter two steps serve to optimize the signal to noise ratio and to prevent signal bleed-through or blocking), respectively. After the optimal primary antibody concentration was identified, TSA titrations were performed on 5 melanoma tumor sections for all markers (table S9). HIER steps were performed both before and after staining in accordance with how the slides would be treated in the final multiplex assay. Ten corresponding HPFs for each IF condition and the related chromogenic IHC were selected for analysis (see approach to signal quantification below). Equivalence of signal compared to chromogenic IHC and bleed-through between fluorescent channels was considered to select the optimal TSA concentration for each marker.
Multiplex IF
The final step in assay validation is to combine all of the optimized monoplex protocols into the multiplex assay format. Single sections from five FFPE melanoma specimens were stained for all 6 markers in the multiplex panel, (table S10). In addition, the three 4 μm thick tissue sections before and after the slide used for the 6-plex panel were stained for the individual markers. Ten HPFs were compared between the multiplex IF and the corresponding monoplex IF (see approach to signal quantification below). When following the approach detailed above, equivalent staining is achieved for each marker between 6-plex mIF, monoplex IF, and single stain chromogenic IHC (Fig. 2E and fig. S5A). Of note, while the total cell counts in multiplex format matched those in monoplex, the dynamic range (as representative of the intensity spread between the 95th and 5th percentile cell expressing a given marker) of the immunofluorescence signal was lower in the multiplex versus monoplex format (fig. S5B).
Approaches to signal quantification
Signal was quantified by a number of different approaches, including cell-based and pixel-based approaches, both with and without machine learning. The cell-based approach combined with machine learning is recommended by the manufacturer. It labels individual cell types and assigns them Cartesian coordinates and thus facilitates analysis of cell densities, fluorescence intensities of markers in different cell compartments, marker coexpression, and distance metrics between cells. Cell-based quantification was performed by using the Cell Segmentation Module (which identifies and maps individual cells) in the inForm software, followed by machine-learning based-phenotyping, i.e., assigning a cell-type.
A cell-based approach without machine learning was also used to quantify signal, since it is faster and requires less user input. The Cell Segmentation Module was used to output the mean fluorescence intensity for each fluorophore in the compartment of interest for each cell. The data were then binned into 10% relative intensity intervals, and the median of the top 10% was extracted as signal and the bottom 10% as noise for quantile-based cell analysis.
The pixel-based approaches are not dependent on cell identification, i.e., cell segmentation, and are simply a measure of pixels that are positive for a marker over a given area. This approach was used when comparing IF and IHC stains, since the same cell segmentation algorithms cannot be applied to both techniques. Pixel-by-pixel data were extracted and analyzed using R package mIFTO (compiled and developed for AstroPath and available at https://github.com/AstropathJHU/mIFTO) (48). Positive pixels (signal) and negative pixels (noise) were assigned using thresholds determined using inForm’s Colocalization Module. Tumor cell expression was studied using a machine learning algorithm to classify pixels into tissue categories. This was required for accurate tumor quantification due to the variation in tumor cell size and the use of a dual marker (Sox10/S100) cocktail, precluding thres-holding on a single marker’s intensity.
To compare monoplex IF and chromogenic staining we used a pixel-based approach. For the Sox10/S100 stain, the machine learning algorithm was also used, as described above. For all other markers, machine learning was not used for this specific comparison. The number of positive pixels from chromogenic staining was considered baseline, and the percent deviation in positive pixels when using an IF stain was calculated.
Positive signal from monoplex and multiplex IF staining was compared using pixel-based and cell-based approaches. Potential changes in marker intensities between the multiplex and monoplex IF were assessed by comparing the usable dynamic range of each epitope, defined as the difference in mean cell fluorescence intensities of the 95th and 5th percentile per HPF.
Statistical analyses
For staining comparisons between corresponding fields acquired from sequential slides paired student t tests were performed and data were reported as mean ± SEM.
Image acquisition, phenotyping, and batch-to-batch normalization
Image acquisition
The entire slide was acquired by tiling HPFs with 20% overlap (Fig. 3A and fig. S6). The mid-point of the overlaps was used to determine the boundaries of modified HPFs (Fig. 3B). A flat-field correction for each of the 35 layers was derived from the average of 11,000 HPFs, smoothed by a Gaussian to reduce effects of outliers (Fig. 3B and fig. S7). Mathematical corrections were also applied for ‘pin cushion effects’ resulting from lens distortion for each HPF (Fig. 3B). Fields were then stitched together using a spring-based model that eliminates “jitter” from the microscope stage movement (Fig. 3C and fig. S8).
Tissue annotation
The tumor-stroma boundary was manually annotated using HALO (Indica Labs) image analysis software. Areas of necrosis, tissue folds and other artifacts were excluded from analysis.
Single-marker phenotyping and associated quality assurance/quality control (QA/QC)
The inForm software typically assigns phenotypes to individual cell lineages, e.g., CD8 versus CD163, simultaneously (i.e., ‘Multimarker’ phenotyping). ‘Single-marker’ phenotyping was also performed, whereby cells were assigned positive or negative status for each marker individually. Cell centers were then used to merge the six individual datasets into a single Cartesian coordinate system (for additional details, see https://github.com/AstropathJHU/MaSS).
The quality of the final phenotyping was verified by a board-certified pathologist (JMT) who visually inspected an average of 25,000 phenotyped cells per specimen using a custom viewer (fig. S10A). Specifically, the 20 highest density CD8 HPFs containing at least 60 tumor cells, 50% tissue coverage, and 400 cells total were selected for each specimen for visual QA/QC inspection of phenotyping algorithm performance. A second custom viewer facilitated inspection of up to 25 randomly selected positive and negative cells for each marker from the same HPFs (fig. S10, B to D). A minimum of 2000 cells displaying each marker was visually inspected using this second viewer for each specimen. The custom QA/QC code for both viewers can be found at https://github.com/AstropathJHU/MaSS.
Normalization of batch-to-batch variation
A tissue microarray (TMA) that included punches from 3 normal spleens and 3 tonsils was run with each multiplex staining batch. The staining intensities for PD-1 and PD-L1 in the control tissues were used for batch-to-batch normalization.
Computing hardware and software configurations
Images were acquired using a local desktop computer associated with the Vectra that was upgraded to contain two 2TB M.2 NVMe SSDs allocated as a single drive, for maximum storage and transfer efficiency. The multispectral image tiles were then transferred from the local computer to a cluster of 4 servers, dedicated to processing of the Vectra data. Two of the servers were configured for computational performance outfitted with nine 2TB nVME SSDs, 128 GB of RAM and 24 physical cores. The other two servers were configured for storage, containing six 6×6 TB HDDs configured as RAID5 arrays. This allowed a total net usable HDD capacity of 313.3TB. This study consumed 32.27 TB of this storage capacity at peak.
One computational server was specifically dedicated to image correction and segmentation, running multiple virtual machines, each with its own inForm instances. The interactive aspects of inForm were overridden using an automation tool, so they could be executed as batch processes. The other computational machine was dedicated to house the database. One of the storage machines contained the compressed backups of the raw data. Each image was compressed individually, to increase accessibility, using settings in the 7-Zip software for optimal speed and compression size for the image files. The final storage server housed the data during processing.
The intermediate data products are reproducible, and can be discarded throughout or after processing; leaving minimum storage requirements for this project around 15 TB without compression. While our configuration expedited image processing and analysis by 12- to 15-fold using a lot of parallelism, it is important to note that the general workflow described herein could be executed using a single computer outfitted with a single inForm license.
Density assessments of cell types by distance to the tumor-stromal border
The density of specific cell types expressing PD-1 or PD-L1 was determined relative to the distance from the tumor-stromal border. PD-1 intensity groups were defined as negative, low, medium, and high by dividing the positive signal for PD-1 into tertiles. To enable comparisons between cell types with varying levels of abundance, a probabilistic density was calculated by dividing the cell density in each distance bin by the total surface density of that cell category.
Density assessments for specific cell populations and association with response to anti-PD-1
The density of specific cell types, including assessments of PD-1 and PD-L1 expression levels (negative, low, mid, high) were determined for each specimen (fig. S12), and tested for an association with response to therapy. The densities of cells displaying the different PD-1/PD-L1 expression levels for each cell type were then compared between responders and nonresponders using a one-sided Wilcoxon rank-sum test. The rank-sum values were converted into AUC values.
To determine the impact of HPF sampling on the resultant AUC, an increasing proportion of the tumor microenvironment was assessed in an iterative manner. Field sampling was performed in one of two ways. (i) CD8+ cell densities were determined for each HPF and then fields were ranked and included by order of decreasing CD8+ cell densities in the hotspot analysis. (ii) Fields were ranked randomly and selected at increasing proportions (Fig. 5). To avoid bias, 100 randomized orderings were generated and an average AUC was reported at each proportion step. They were selected randomly for “representative” analysis. Reported P values are corrected for multiple comparisons using a Benjamini-Hochberg correction.
Each feature that showed an association with response by univariate analysis (corrected P value < 0.05) at 30% hot spot HPFs sampling and for the whole TME (100% sampling) was combined into a multivariate model (see data files S1 to S4 for densities for all 41 features at 30% hot spot sampling and 100% sampling). Specifically, a binary logistic regression model was applied to assess the combinatorial ROC curves and the corresponding AUCs were calculated to evaluate the prognostic accuracy of combination of the top 10 features in the discovery cohort for predicting objective response. These same 10 features were then tested in an independent validation cohort. A combined model was also developed using these features for predicting long-term survival by Kaplan Meier analysis. In this combinatorial model, patients whose samples contained high densities (top 20%) for any one of the features negatively associated with outcome were grouped together first, irrespective of other expressed factors. Next, the remaining patients were divided between those containing high densities (top 15%) for any one of the features positively associated with outcome.
mIF assay for PD-1 expression by lymphocyte subsets
A six-plex mIF assay for PD-1, CD8, CD4, CD20, FoxP3, and tumor (Sox10/S100) was developed and validated on an automated platform (Leica Bond Rx), according to the principles previously described. The staining order and conditions for staining are provided in table S11. This was used to assess the proportion of PD-1 expression contributed by individual lymphocyte subsets to the melanoma TME.
Supplementary Material
ACKNOWLEDGMENTS
The authors thank C. C. Hoyt, vice president, Translational and Scientific Affairs at Akoya Biosciences; S. J. Handy, MS at the Centre for Advanced Computing, Queen’s University; A. Duffield, MD, PhD from Johns Hopkins University SOM; and R. Edwards, MD at Bristol-Myers Squibb for helpful comments. We also thank K. Adams from Johns Hopkins University and S. Martinez-Morilla from Yale University for their administrative assistance.
Funding:
This work was supported by The Mark Foundation for Cancer Research (J.M.T., A.S.S., D.M.P., S.L.T., and E.J.L.); Melanoma Research Alliance (J.M.T.); Harry J. Lloyd Trust (J.M.T.); the Emerson Collective (J.M.T.); Moving for Melanoma of Delaware (J.M.T., S.L.T., and E.J.L.); the Barney Family Foundation (E.J.L.); The Laverna Hahn Charitable Trust (E.J.L.); Bristol-Myers Squibb (J.M.T., E.M.J., S.L.T., and D.M.P.); Navigate Biopharma (D.L.R. and H.K.); Sidney Kimmel Cancer Center Core Grant P30 CA006973 (J.M.T., L.D., L.C., and E.J.L.); National Cancer Institute R01 CA142779 (J.M.T., S.L.T., and D.M.P.); NIH T32 CA193145 (T.R.C. and J.E.S.); P50 CA062924 (R.A.A.); P50 CA121974 (D.L.R. and H.K.); U01 CA196390 (A.S.S. and A.M.D.); R50 CA243627 (L.D.); and The Bloomberg~Kimmel Institute for Cancer Immunotherapy.
Competing interests:
R.A.A. receives grant funding from FLX Bio and Five Prime Therapeutics and is a consultant for Bristol-Myers Squibb, Merck, Incyte, and AstraZeneca. D.M.P. and S.L.T. report other support from Aduro Biotech, Amgen, Bayer, Camden Partners, DNAtrix, Dracen, Dynavax, FLX Bio, Immunomic, Janssen, Merck, Rock Springs Capital, Potenza, Tizona, Trieza, and WindMil during the conduct of the study; grants from Astra Zeneca, Medimmune/Amplimmune, and Compugen; grants and other support from Bristol-Myers Squibb, ERvaxx, and Potenza; personal fees from AbbVie, Avidity Nanomedicines, ImaginAb, Immunocore, and Merck; and personal fees and nonfinancial support from Five Prime Therapeutics and Dragonfly Therapeutics. E.M.J. receives grant support from BMS, Aduro Biotech, and Amgen and serves on advisory boards of CSTONE, Adaptive Biotech, Genocea, Dragonfly, Candel Therapeutics, STIMIT Therapeutics, the Parker Institute, and the Lustgarten Foundation. J.M.T. reports grants and consulting from Bristol-Myers Squibb and consulting for Merck, Astra Zeneca, and Compugen outside the submitted work; J.M.T. and A.S.S. report equipment, reagents, and stock options from Akoya Biosciences and a patent pending related to image processing of mIF/IHC images. S.B. is currently employed by Akoya Biosciences and reports stock options. E.J.L. receives institutional research grant funding from Bristol-Myers Squibb, Merck, and Regeneron and is a consultant for Array BioPharma, Bristol-Myers Squibb, EMD Serono, Macrogenics, Merck, Regeneron, and Sanofi Genzyme. P.F.W. is currently employed by Verily. H.K. receives institutional research funding from Bristol-Myers Squibb, Merck, and Apexigen outside of the published work and consulting fees from Nektar, Iovance, Immunocore, Celldex, Array Biopharma, Merck, Elevate Bio, Instil Bio, Bristol-Myers Squibb, Clinigen, Shionogi, Chemocentryz, and Calithera. D.L.R. declares that in the past 2 years, he has served as a consultant to AstraZeneca, Amgen, BMS, Cell Signaling Technology, Cepheid, Daiichi Sankyo, Danaher, GSK, Konica/Minolta, Merck, NanoString, Novartis, PAIGE.AI, PerkinElmer/Akoya Biosciences, Ultivue, and Ventana Medical Systems. No other disclosures were reported.
Footnotes
SUPPLEMENTARY MATERIALS
science.sciencemag.org/content/372/6547/eaba2609/suppl/DC1
Data Files S1 to S4
Data and materials availability:
All data are available in the manuscript or the supplementary materials. The computer code has been archived with Zenodo (48, 49) and is maintained at https://github.com/AstroPathJHU.
REFERENCES AND NOTES
- 1. www.fda.gov/drugs/informationondrugs/approveddrugs/ucm279174.htm.
- 2.Sunshine J, Taube JM, PD-1/PD-L1 inhibitors. Curr. Opin. Pharmacol 23, 32–38 (2015). doi: 10.1016/j.coph.2015.05.011; [DOI] [PMC free article] [PubMed] [Google Scholar]
- 3.Taube JM et al. , Implications of the tumor immune microenvironment for staging and therapeutics. Mod. Pathol 31, 214–234 (2018). doi: 10.1038/modpathol.2017.156; [DOI] [PMC free article] [PubMed] [Google Scholar]
- 4.Le DT et al. , Mismatch repair deficiency predicts response of solid tumors to PD-1 blockade. Science 357, 409–413 (2017). doi: 10.1126/science.aan6733; [DOI] [PMC free article] [PubMed] [Google Scholar]
- 5.Rizvi NA et al. , Mutational landscape determines sensitivity to PD-1 blockade in non-small cell lung cancer. Science 348, 124–128 (2015). doi: 10.1126/science.aaa1348; [DOI] [PMC free article] [PubMed] [Google Scholar]
- 6.Lu S et al. , Comparison of biomarker modalities for predicting response to PD-1/PD-L1 checkpoint blockade: A systematic review and meta-analysis. JAMA Oncol. 5, 1195–1204 (2019). doi: 10.1001/jamaoncol.2019.1549; [DOI] [PMC free article] [PubMed] [Google Scholar]
- 7.Gorris MAJ et al. , Eight-color multiplex immunohistochemistry for simultaneous detection of multiple immune checkpoint molecules within the tumor microenvironment. J. Immunol 200, 347–354 (2018). doi: 10.4049/jimmunol.1701262; [DOI] [PubMed] [Google Scholar]
- 8.Feng Z et al. , Multiparametric immune profiling in HPV- oral squamous cell cancer. JCI Insight 2, e93652 (2017). doi: 10.1172/jci.insight.93652; [DOI] [PMC free article] [PubMed] [Google Scholar]
- 9.Gartrell RD et al. , Quantitative analysis of immune infiltrates in primary melanoma. Cancer Immunol. Res 6, 481–493 (2018). doi: 10.1158/2326-6066.CIR-17-0360; [DOI] [PMC free article] [PubMed] [Google Scholar]
- 10.Parra ER et al. , Effect of neoadjuvant chemotherapy on the immune microenvironment in non-small cell lung carcinomas as determined by multiplex immunofluorescence and image analysis approaches. J. Immunother. Cancer 6, 48 (2018). doi: 10.1186/s40425-018-0368-0; [DOI] [PMC free article] [PubMed] [Google Scholar]
- 11.Giraldo NA et al. , Multidimensional, quantitative assessment of PD-1/PD-L1 expression in patients with Merkel cell carcinoma and association with response to pembrolizumab. J. Immunother. Cancer 6, 99 (2018). doi: 10.1186/s40425-018-0404-0; [DOI] [PMC free article] [PubMed] [Google Scholar]
- 12.Salmon H, Remark R, Gnjatic S, Merad M, Host tissue determinants of tumour immunity. Nat. Rev. Cancer 19, 215–227 (2019). [DOI] [PMC free article] [PubMed] [Google Scholar]
- 13.Sunshine JC et al. , PD-L1 Expression in Melanoma: A Quantitative Immunohistochemical antibody comparison. Clin. Cancer Res 23, 4938–4944 (2017). doi: 10.1158/1078-0432.CCR-16-1821; [DOI] [PMC free article] [PubMed] [Google Scholar]
- 14.Parra ER et al. , Validation of multiplex immunofluorescence panels using multispectral microscopy for immune-profiling of formalin-fixed and paraffin-embedded human tumor tissues. Sci. Rep 7, 13380 (2017). doi: 10.1038/s41598-017-13942-8; [DOI] [PMC free article] [PubMed] [Google Scholar]
- 15.Chen DS, Mellman I, Elements of cancer immunity and the cancer-immune set point. Nature 541, 321–330 (2017). doi: 10.1038/nature21349; [DOI] [PubMed] [Google Scholar]
- 16.Fitzgibbons PL et al. , Principles of analytic validation of immunohistochemical assays: Guideline from the College of American Pathologists Pathology and Laboratory Quality Center. Arch. Pathol. Lab. Med 138, 1432–1443 (2014). doi: 10.5858/arpa.2013-0610-CP; [DOI] [PubMed] [Google Scholar]
- 17.Shi SR, Liu C, Taylor CR, Standardization of immunohistochemistry for formalin-fixed, paraffin-embedded tissue sections based on the antigen-retrieval technique: From experiments to hypothesis. J. Histochem. Cytochem 55, 105–109 (2007). doi: 10.1369/jhc.6P7080.2006; [DOI] [PubMed] [Google Scholar]
- 18.Taube JM et al. , The Society for Immunotherapy of Cancer statement on best practices for multiplex immunohistochemistry (IHC) and immunofluorescence (IF) staining and validation. J. Immunother. Cancer 8, e000155 (2020). doi: 10.1136/jitc-2019-000155; [DOI] [PMC free article] [PubMed] [Google Scholar]
- 19.Szalay AS et al. , Designing and mining multi-terabyte astronomy archives: The Sloan Digital Sky Survey. SIGMOD Rec. 29, 451–462 (2000). doi: 10.1145/335191.335439 [DOI] [Google Scholar]
- 20.Szalay A, Gray J, The world-wide telescope. Science 293, 2037–2040 (2001). doi: 10.1126/science.293.5537.2037; [DOI] [PubMed] [Google Scholar]
- 21.Szalay A, Gray J, 2020 computing: Science in an exponential world. Nature 440, 413–414 (2006). doi: 10.1038/440413a; [DOI] [PubMed] [Google Scholar]
- 22.Spielman D, Spectral and Algebraic Graph Theory (ed. Incomplete Draft, dated October 28, 2019, 2019); http://cs-www.cs.yale.edu/homes/spielman/sagt.
- 23.Lauss M et al. , Monitoring of technical variation in quantitative high-throughput datasets. Cancer Inform. 12, 193–201 (2013). doi: 10.4137/CIN.S12862; [DOI] [PMC free article] [PubMed] [Google Scholar]
- 24.Kurtulus S et al. , Checkpoint blockade immunotherapy induces dynamic changes in PD-1. Immunity 50, 181–194.e6 (2019). doi: 10.1016/j.immuni.2018.11.014; [DOI] [PMC free article] [PubMed] [Google Scholar]
- 25.Anichini A et al. , Tumor-reactive CD8+ early effector T cells identified at tumor site in primary and metastatic melanoma. Cancer Res. 70, 8378–8387 (2010). doi: 10.1158/0008-5472.CAN-10-2028; [DOI] [PubMed] [Google Scholar]
- 26.Tassi E et al. , Early effector T lymphocytes coexpress multiple inhibitory receptors in primary non-small cell lung cancer. Cancer Res. 77, 851–861 (2017). doi: 10.1158/0008-5472.CAN-16-1387; [DOI] [PubMed] [Google Scholar]
- 27.Le DT et al. , CD8+ Foxp3+ tumor infiltrating lymphocytes accumulate in the context of an effective anti-tumor response. Int. J. Cancer 129, 636–647 (2011). doi: 10.1002/ijc.25693; [DOI] [PMC free article] [PubMed] [Google Scholar]
- 28.Fridman WH, Pagès F, Sautès-Fridman C, Galon J, The immune contexture in human tumours: Impact on clinical outcome. Nat. Rev. Cancer 12, 298–306 (2012). doi: 10.1038/nrc3245; [DOI] [PubMed] [Google Scholar]
- 29.Blackburn SD, Shin H, Freeman GJ, Wherry EJ, Selective expansion of a subset of exhausted CD8 T cells by alphaPD-L1 blockade. Proc. Natl. Acad. Sci. U.S.A 105, 15016–15021 (2008). doi: 10.1073/pnas.0801497105; [DOI] [PMC free article] [PubMed] [Google Scholar]
- 30.Wherry EJ, Kurachi M, Molecular and cellular insights into T cell exhaustion. Nat. Rev. Immunol 15, 486–499 (2015). doi: 10.1038/nri3862; [DOI] [PMC free article] [PubMed] [Google Scholar]
- 31.Thommen DS et al. , A transcriptionally and functionally distinct PD-1+ CD8+ T cell pool with predictive potential in non-small-cell lung cancer treated with PD-1 blockade. Nat. Med 24, 994–1004 (2018). doi: 10.1038/s41591-018-0057-z; [DOI] [PMC free article] [PubMed] [Google Scholar]
- 32.Paley MA et al. , Progenitor and terminal subsets of CD8+ T cells cooperate to contain chronic viral infection. Science 338, 1220–1225 (2012). doi: 10.1126/science.1229620; [DOI] [PMC free article] [PubMed] [Google Scholar]
- 33.Andrews LP, Yano H, Vignali DAA, Inhibitory receptors and ligands beyond PD-1, PD-L1 and CTLA-4: Breakthroughs or backups. Nat. Immunol 20, 1425–1434 (2019). doi: 10.1038/s41590-019-0512-0; [DOI] [PubMed] [Google Scholar]
- 34.Demetriou P et al. , A dynamic CD2-rich compartment at the outer edge of the immunological synapse boosts and integrates signals. Nat. Immunol 21, 1232–1243 (2020). doi: 10.1038/s41590-020-0770-x; [DOI] [PMC free article] [PubMed] [Google Scholar]
- 35.Heeren AM et al. , Efficacy of PD-1 blockade in cervical cancer is related to a CD8+FoxP3+CD25+ T-cell subset with operational effector functions despite high immune checkpoint levels. J. Immunother. Cancer 7, 43 (2019). doi: 10.1186/s40425-019-0526-z; [DOI] [PMC free article] [PubMed] [Google Scholar]
- 36.Taube JM et al. , Colocalization of inflammatory response with B7–h1 expression in human melanocytic lesions supports an adaptive resistance mechanism of immune escape. Sci. Transl. Med 4, 127ra37 (2012). doi: 10.1126/scitranslmed.3003689; [DOI] [PMC free article] [PubMed] [Google Scholar]
- 37.Pardoll DM, The blockade of immune checkpoints in cancer immunotherapy. Nat. Rev. Cancer 12, 252–264 (2012). doi: 10.1038/nrc3239; [DOI] [PMC free article] [PubMed] [Google Scholar]
- 38.Tsujikawa T et al. , Quantitative multiplex immunohistochemistry reveals myeloid-inflamed tumor-immune complexity associated with poor prognosis. Cell Rep. 19, 203–217 (2017). doi: 10.1016/j.celrep.2017.03.037; [DOI] [PMC free article] [PubMed] [Google Scholar]
- 39.Wang J et al. , Siglec-15 as an immune suppressor and potential target for normalization cancer immunotherapy. Nat. Med 25, 656–666 (2019). doi: 10.1038/s41591-019-0374-x; [DOI] [PMC free article] [PubMed] [Google Scholar]
- 40.Topalian SL, Taube JM, Pardoll DM, Neoadjuvant checkpoint blockade for cancer immunotherapy. Science 367, eaax0182 (2020). doi: 10.1126/science.aax0182; [DOI] [PMC free article] [PubMed] [Google Scholar]
- 41.Remark R et al. , In-depth tissue profiling using multiplexed immunohistochemical consecutive staining on single slide. Sci. Immunol 1, aaf6925 (2016). doi: 10.1126/sciimmunol.aaf6925; [DOI] [PMC free article] [PubMed] [Google Scholar]
- 42.Keren L et al. , A structured tumor-immune microenvironment in triple negative breast cancer revealed by multiplexed ion beam imaging. Cell 174, 1373–1387.e19 (2018). doi: 10.1016/j.cell.2018.08.039; [DOI] [PMC free article] [PubMed] [Google Scholar]
- 43.Muntasell A et al. , Targeting NK-cell checkpoints for cancer immunotherapy. Curr. Opin. Immunol 45, 73–81 (2017). doi: 10.1016/j.coi.2017.01.003; [DOI] [PubMed] [Google Scholar]
- 44.Brown CC et al. , Transcriptional basis of mouse and human dendritic cell heterogeneity. Cell 179, 846–863.e24 (2019). doi: 10.1016/j.cell.2019.09.035; [DOI] [PMC free article] [PubMed] [Google Scholar]
- 45.Rodig SJ et al. , MHC proteins confer differential sensitivity to CTLA-4 and PD-1 blockade in untreated metastatic melanoma. Sci. Transl. Med 10, eaar3342 (2018). doi: 10.1126/scitranslmed.aar3342; [DOI] [PubMed] [Google Scholar]
- 46.Aung PP et al. , B7–H3 expression in Merkel cell carcinoma-associated endothelial cells correlates with locally aggressive primary tumor features and increased vascular density. Clin. Cancer Res 25, 3455–3467 (2019). doi: 10.1158/1078-0432.CCR-18-2355; [DOI] [PMC free article] [PubMed] [Google Scholar]
- 47.Schalper KA et al. , Neoadjuvant nivolumab modifies the tumor immune microenvironment in resectable glioblastoma. Nat. Med 25, 470–476 (2019). doi: 10.1038/s41591-018-0339-5; [DOI] [PubMed] [Google Scholar]
- 48.Green BF, Roberts C, Giraldo NA, AstroPathJHU/mIFTO: mIFTO v2.00.025 release. Zenodo (2021); doi: 10.5281/zenodo.4814053. [DOI] [Google Scholar]
- 49.Green BF et al. , AstroPathJHU/AstroPathPipeline: AstroPath Pipeline v0.1.0. Zenodo (2021); doi: 10.5281/zenodo.4814836. [DOI] [Google Scholar]
Associated Data
This section collects any data citations, data availability statements, or supplementary materials included in this article.
Supplementary Materials
Data Availability Statement
All data are available in the manuscript or the supplementary materials. The computer code has been archived with Zenodo (48, 49) and is maintained at https://github.com/AstroPathJHU.