

Abstract
Diphenylamine NSAIDs are taken frequently for chronic pain conditions, yet their use may potentiate hepatotoxicity risks through poorly characterized metabolic mechanisms. Our previous work revealed that seven marketed or withdrawn diphenylamine NSAIDs undergo bioactivation into quinone-species metabolites, whose reaction specificities depended on halogenation and the type of acidic group on the diphenylamine. Herein, we identified cytochromes P450 responsible for those bioactivations, determined reaction specificities, and estimated relative contributions of enzymes to overall hepatic bioactivations and detoxifications. A qualitative activity screen revealed CYP2C8, 2C9, 2C19, and 3A4 played roles in drug bioactivation. Subsequent steady-state studies with recombinant CYPs recapitulated the importance of halogenation and acidic group type on bioactivations but importantly, showed patterns unique to each CYP. CYP2C9, 2C19 and 3A4 bioactivated all NSAIDs with CYP2C9 dominating all possible bioactivation pathways and their specificities. For each CYP, specificities for overall oxidative metabolism were not impacted significantly by differences in NSAID structures but the values themselves differed among the enzymes such that CYP2C9 and 3A4 were more efficient than others. When considering hepatic CYP abundance, CYP2C9 almost exclusively accounted for diphenylamine NSAID bioactivations, whereas CYP3A4 provided a critical counterbalance favoring their overall detoxification. Preference for either outcome would depend on molecular structures favoring metabolism by the CYPs as well as the influence of clinical factors altering their expression and/or activity. While focused on NSAIDs, these findings have broader implications on bioactivation risks given the expansion of the diphenylamine scaffold to other drug classes such as targeted cancer therapeutics.
Keywords: diphenylamine NSAIDs, reactivity, liver, toxicity, bioactivation, quinone-species metabolites
GRAPHICAL ABSTRACT

1). INTRODUCTION
Nonsteroidal anti-inflammatory drugs (NSAIDs) are prescribed over 10 million times per year in the United States to treat chronic and acute pain conditions such as rheumatoid arthritis, osteoarthritis, dysmenorrhea, menorrhagia, and gout (Altman et al., 2015; Davis and Robson, 2016; Galati et al., 2002). Such high levels of consumption potentiate even rare (1 per 10,000 prescriptions) clinically apparent liver injury (Sriuttha et al., 2018a, 2018b). These hepatotoxicity risks are more prevalent and severe with diphenylamine NSAIDs (Davis and Robson, 2016; Galati et al., 2002; Goldkind and Laine, 2006; Hawboldt, 2008) and have warranted their tracking by the United States Food and Drug Administration (Li et al., 2020; Thakkar et al., 2018). Based on those findings, diphenylamine NSAIDs diclofenac, meclofenamate, mefenamate, and lumiracoxib have undergone black box labeling or were never approved for use in the United States (Chen et al., 2016; Kang et al., 2009; Pillans et al., 2012; Sriuttha et al., 2018a; Thakkar et al., 2018). Knowledge of the mechanisms underlying the drug-induced injuries would provide a basis for managing risks for dosed patients and facilitate the design of safe drugs that avoid those liabilities. While the mechanisms for liver injuries are likely multi-factorial, a common molecular-initiating event involves the conversion of drugs into reactive metabolites (Goldkind and Laine, 2006; Hawboldt, 2008; Sriuttha et al., 2018b) that can compromise cell function and adduct proteins to contribute to drug-induced liver injury (Davis and Robson, 2016; Li et al., 2009; Masubuchi et al., 1999). Diphenylamine NSAIDs undergo conjugative reactions to form reactive acyl glucuronides or sequential oxidative steps to form reactive quinone-species metabolites (Li et al., 2009; Masubuchi et al., 1999; Regan et al., 2010; Schleiff et al., 2021, 2020; Van Vleet et al., 2017). However, the toxicological relevance of those pathways remains controversial due to the absence of sufficient quantitative studies on relationships determining NSAID bioactivations and detoxifications.
Recently, we reported the broadest assessment yet for diphenylamine NSAID bioactivations by determining how structural features among them impacted bioactivation pathways and overall metabolic clearance using a novel quantitative kinetic approach (Fig. 1) (Schleiff et al., 2021, 2020). Strikingly, diphenylamine dihalogenation favored efficient formation of quinone-species metabolites through four distinct metabolic pathways, whereas monohalogenation or no halogenation resulted in decreased bioactivation pathway diversity and efficiency. The length of the carboxylic acid group yielded no clear patterns on bioactivation. Nevertheless, anthranilic acid diphenylamine NSAIDs exhibited four-fold elevated bioloads for reactive metabolites compared to their acetic acid counterparts due mainly to higher daily doses. The reliance on pooled liver microsomes in those studies provided critical insights on the potential risks for the average adult but not for specific patient populations. Corresponding NSAID bioactivations will depend on variations in contributions from individual cytochromes P450 (CYPs) impacted by clinical factors such as age, sex, genetic polymorphisms, concomitant drugs, and physiological conditions (Achour et al., 2014; Davidson, 2000; Shimada et al., 1994). This assessment requires the identification of CYPs responsible for bioactivations and their relative capacities to catalyze those reactions.
Fig. 1. Metabolic pathways for diphenylamine NSAIDs which undergo bioactivation to form quinone-species metabolites.
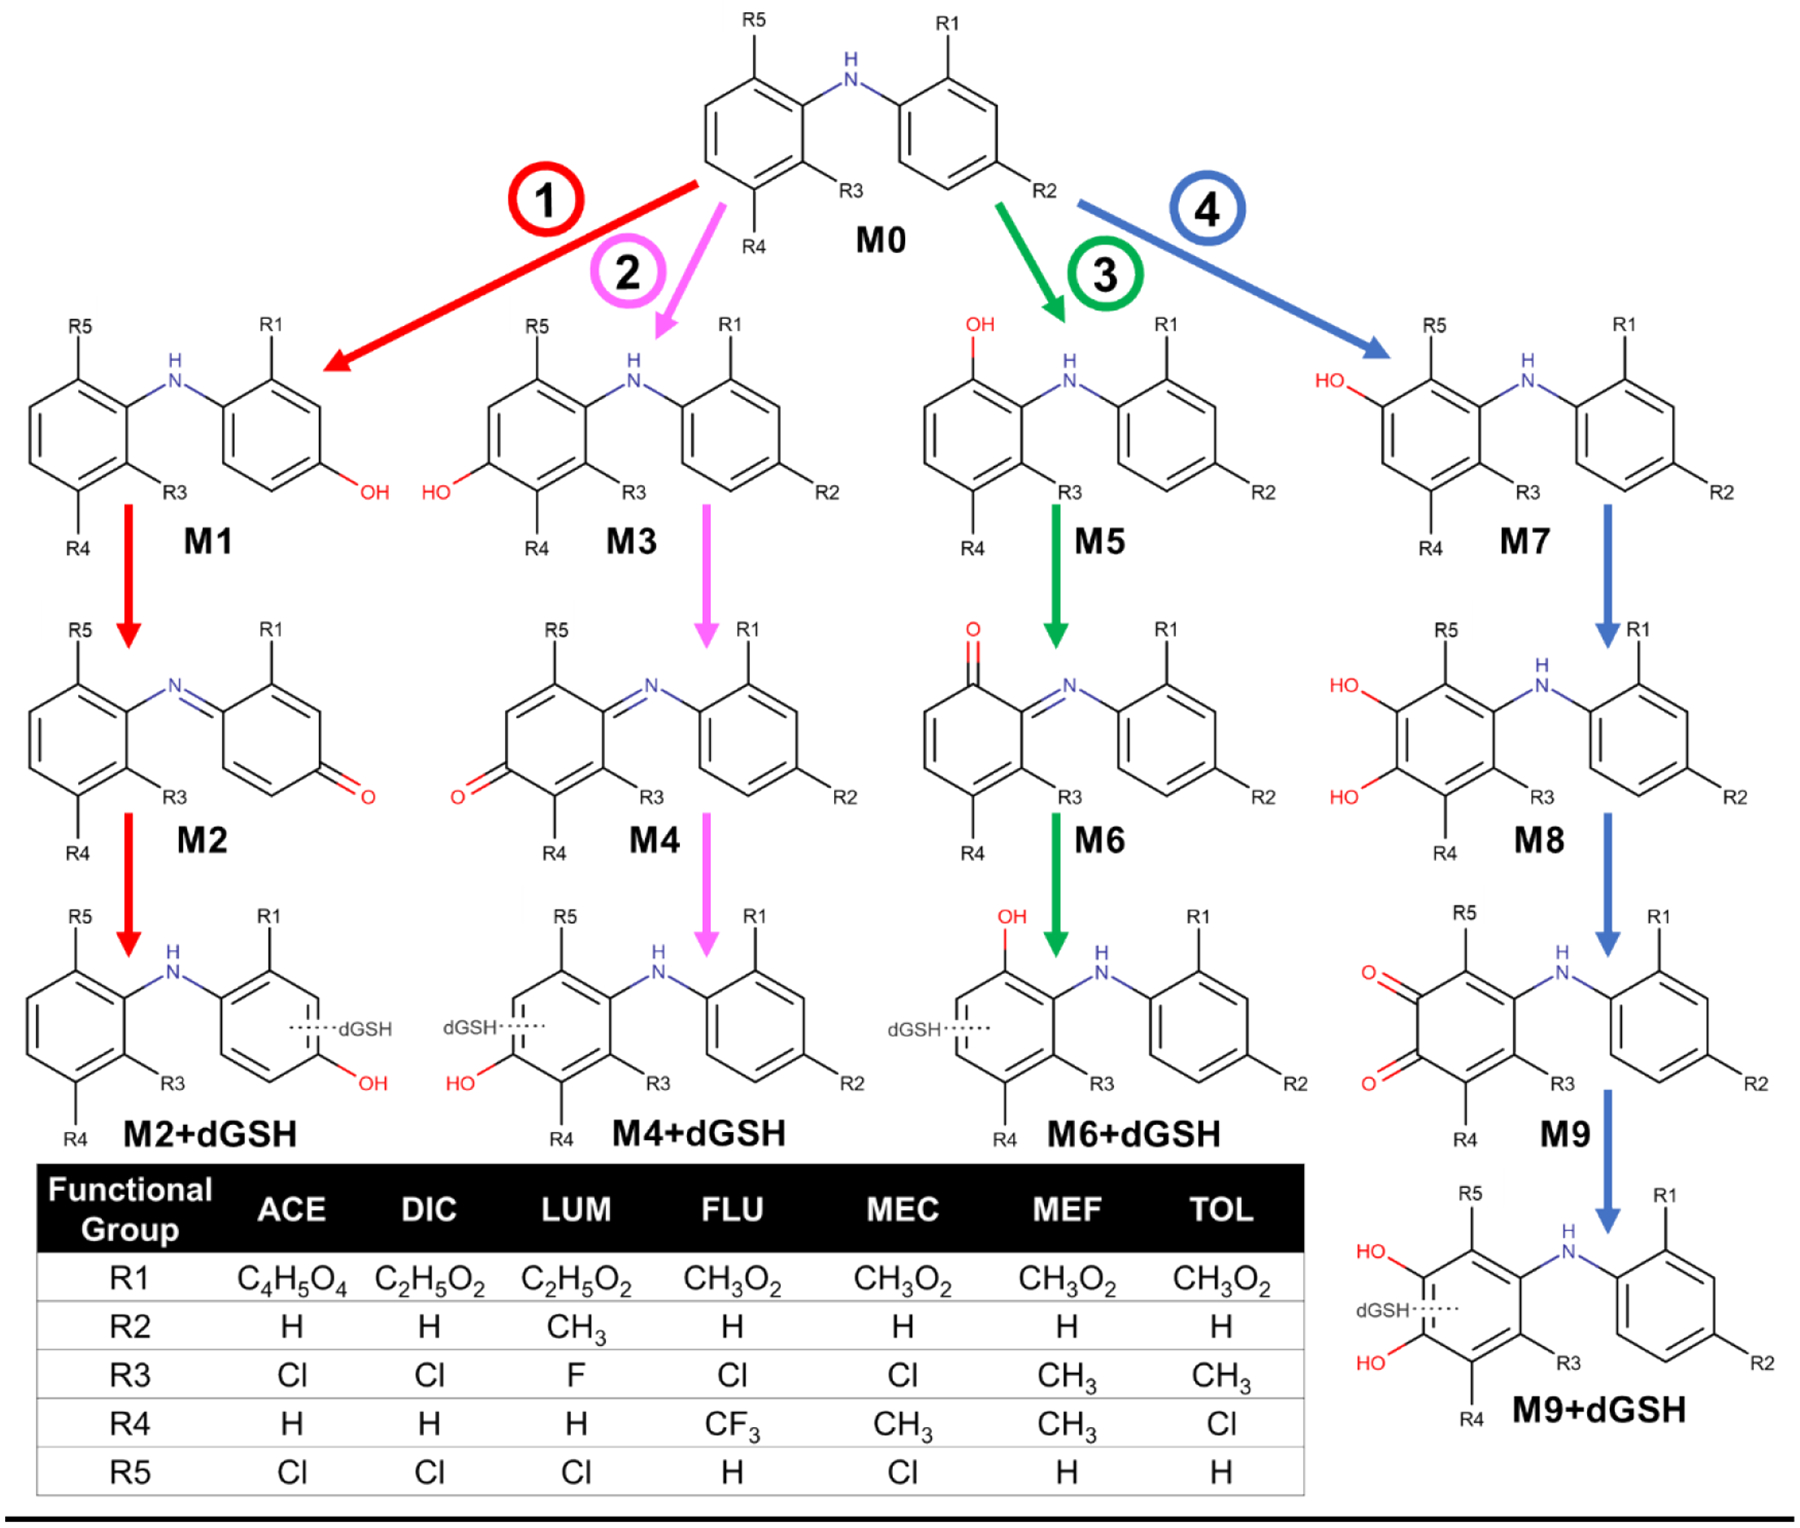
The diphenylamine structure is metabolically bioactivated through four distinct pathways resulting in several quinone-species metabolites. Both pathways 1 and 2 require monohydroxylation and proceed similarly, where monohydroxylation occurs to the acidic phenyl group for pathway 1 resulting in the formation of para-quinone-imine which adducts with dansyl glutathione (dGSH), while monohydroxylation occurs on the second phenyl ring for pathway 2. Dehalogenation is required for pathway 3 followed by subsequent hydroxylation to form an ortho-quinoneimine which is adducted with dGSH. Finally, ortho-dihydroxylation is required to result in an ortho-quinone which adducts with dGSH. Abbreviations are as follows: ACE, aceclofenac; DIC, diclofenac; LUM, lumiracoxib, FLU, flufenamate; MEC, meclofenamate; MEF, mefenamate, TOL; tolfenamate. Adapted from from Toxicology (Schleiff et al., 2021).
Although limited in scope, there have been efforts to determine which CYPs contribute to the bioactivation of diclofenac, lumiracoxib, and mefenamate into reactive quinone-species metabolites. Based on a variety of different approaches, the widely used NSAID diclofenac was shown to undergo bioactivation by CYP2C9, 3A4 or both in addition to other minor CYPs (Shen et al., 1999; Tang et al., 1999; Yan et al., 2005). While in the same family, lumiracoxib was apparently bioactivated by CYP2C9 with no role for CYP3A4. This shift in specificity may reflect differences imparted by halogenation and/or presence of a methyl group (Li et al., 2008). Mefenamate lacks halogens altogether and possesses an anthranilic acid group, yet the bioactivation of this NSAID involved a similar preferential role for CYP2C9 with lesser roles for CYP1A2 and CYP3A4 (Venkataraman et al., 2014). Reported CYP2C9 contributions are consistent with its specificity toward anionic substrates like the diphenylamine NSAIDs (Mancy et al., 1995; Mo et al., 2009). Minor differences to the diphenylamine structure may explain the selective specificities of other CYPs in diphenylamine bioactivation. Nevertheless, these reports suffer from two important shortcomings. First, experimental designs did not consider the impact of time and drug concentration on bioactivations such that the resulting apparent bioactivation rates were qualitative assessments. Differences in reaction conditions could yield differences in the relative importance of individual CYPs and may explain the conflicting results for diclofenac. Second, reported studies did not assess the contribution of bioactivation to overall metabolic clearance which is critical for assessing the risks posed by individual CYPs in toxicological outcomes. We avoid those pitfalls by measuring in vitro reaction kinetics for bioactivations and overall metabolism so that we can scale the importance of individual CYPs in bioactivation risks when extrapolating to in vivo clearance (Barnette et al., 2021, 2019).
To advance risk assessment for NSAID bioactivation, we identified CYPs responsible for bioactivation of seven diphenylamine NSAIDs into quinone-species metabolites and determined the corresponding kinetics for those reactions. First, we employed CYP-selective chemical inhibitors to qualitatively assess CYPs participating in diphenylamine NSAID bioactivation (Barnette et al., 2021, 2020, 2019; Davis et al., 2019). Next, we performed steady-state kinetics to quantitatively measure rates of quinone-species metabolite formation and thus generated values which revealed catalytic efficiencies and specificities for individual and summed reactions for each substrate. We then measured overall kinetics for the elimination of the drugs by the respective CYPs so that we could normalize bioactivation kinetics to overall drug metabolism and calculate its relative contribution. Lastly, we extrapolated the information on in vitro metabolism to in vivo clearance. This approach revealed the most likely, clinically relevant CYPs involved in the bioactivation of diphenylamine NSAIDs. Such information could help stratify patient hepatotoxicity risks based upon interindividual variability in metabolism due to genetics, lifestyle choices, and other factors (Achour et al., 2014; Davidson, 2000; Shimada et al., 1994).
2). MATERIALS AND METHODS
2.1). Materials
All chemical solvents were purchased from Thermo Fisher Scientific (Waltham, MA). Substrates diclofenac sodium, flufenamic acid (flufenamate), meclofenamic acid (meclofenamate), mefenamic acid (mefenamate), and tolfenamic acid (tolfenamate) were purchased from MilliporeSigma (Burlington, MA). Substrates aceclofenac and lumiracoxib were purchased from Abcam Inc. (Cambridge, MA). Trapping agent dansyl glutathione trifluoroacetic acid salt was purchased from Toronto Research Chemicals (Toronto, ON, Canada). Internal standard dansylamide and reducing agent Tris(2-carboxyethyl)phosphine hydrochloride (TCEP) were obtained from MilliporeSigma. Human liver microsomes pooled from 150 donors (HLM150) and recombinant Supersomes containing cytochromes CYP2C8, 2C9, 2C19, and 3A4 were obtained from Corning Gentest (Woburn, MA). Marvin 20.4 was used for drawing, displaying, and characterizing chemical structures, substructures, and reactions (ChemAxon, http://www.chemaxon.com).
2.2). Chemical inhibitor phenotyping to identify participating cytochromes P450
We carried out inhibitor phenotyping experiments to qualitatively identify CYP isozymes catalyzing diphenylamine NSAID bioactivation pathways leading to various dansyl glutathione adducts as presented in our previous studies (Schleiff et al., 2021, 2020). Moreover, experiments in this study involve details included in our previous works (Barnette et al., 2021, 2019; Davis et al., 2019; Schleiff et al., 2021). In brief, reactions were conducted with 0.50 mg/mL protein (HLM150), 200 μM diphenylamine substrate in 100 mM potassium phosphate buffer (pH 7.4) with 0.1% dimethylsulfoxide co-solvent, selective CYP inhibitors, and 1 mM dansyl glutathione. The following specific CYP inhibitors and concentrations were used: 16 μM alpha-naphthoflavone (ANF) for CYP1A2 (Spaggiari et al., 2016, 2014a, 2014b), 2 μM tranylcypromine (TCP) for CYP2A6, 3 μM ticlopidine (TIC) for CYP2B6 (Hartman et al., 2014; Khojasteh et al., 2011), 16 μM montelukast (MTK) for CYP2C8 (Tornio et al., 2006), 10 μM sulfaphenazole (SPA) for CYP2C9, 16 μM (+)-N-3-benzylnirvanol (BZV) for CYP2C19, 2 μM quinidine (QND) for CYP2D6, 30 μM 4-methylpyrazole (4MP) for CYP2E1, 1 μM ketoconazole (KCZ) for CYP3A4 (Hartman et al., 2014; Khojasteh et al., 2011; Nirogi et al., 2015), and 1 mM 1-aminobenzotriazole (ABT) for all major CYPs (de Montellano, 2018). Each inhibitor solution was prepared in acetonitrile which does not elicit inhibitory organic solvent effects on the major CYPs studied (Busby et al., 1999; Chauret et al., 1998; Easterbrook et al., 2000; Li et al., 2010). After 5 min pre-incubation with shaking at 350 rpm and 37 °C, reactions were initiated by addition of an NADPH regenerating system (0.4 U/μL glucose-6-phosphate dehydrogenase, 3.3 mM glucose 6-phosphate, 3.3 mM MgCl2, 1.3 mM NADP+) in 100 mM potassium phosphate buffer (pH 7.4). Reactions were quenched at 60 min with a 2-fold volume of ice-cold methanol containing 10 μM internal standard dansylamide and 5 mM reducing agent tris (2-carboxyethyl) phosphine hydrochloride and incubated on ice for 10 min to optimize precipitation of proteins (Schellinger and Carr, 2004). After 2800 x g centrifugation at 4 °C for 15 min using a Thermo Scientific Sorvall ST 40R Centrifuge (Thermo Fisher Scientific, Waltham, MA), supernatants were separated from the pelleted protein and transferred to a 96 well full-volume microplate and evaporated to dryness using an Organomation Microvap Nitrogen Evaporator System (Organomation Associates, Inc, Berlin, MA). Dried wells were resuspended in mobile phase (1:4 acetonitrile and water with 0.1% formic acid) for HPLC analysis with fluorescence and absorbance detection. Each set of reactions was performed in triplicate and replicated twice. Statistical analysis was performed by comparing reactions containing chemical inhibitors to negative controls only containing co-solvent using the student T-test analysis tool from GraphPad Prism 7.0 (GraphPad Software, Inc., San Diego, CA) as summarized in Table 1.
Table 1.
Chemical inhibitor phenotyping statistical analyses.
| NSAIDa | MetIDb | 1A2 | 2A6 | 2B6 | 2C8 | 2C9 | 2C19 | 2D6 | 2E1 | 3A4 | All |
|---|---|---|---|---|---|---|---|---|---|---|---|
| ACE | M2/M4 | NS | NS | NS | *** | *** | *** | NS | NS | *** | *** |
| M6 | NS | NS | NS | NS | *** | ** | NS | NS | NS | *** | |
| M9 | NS | NS | NS | *** | *** | *** | NS | NS | *** | *** | |
| Unk | NS | NS | NS | ** | *** | *** | NS | NS | NS | *** | |
| DIC | M2/M4 | NS | NS | NS | ** | *** | * | NS | NS | *** | *** |
| M6 | NS | NS | NS | NS | *** | *** | NS | NS | * | *** | |
| M9 | NS | NS | NS | NS | *** | NS | NS | NS | *** | *** | |
| Unk | NS | NS | NS | NS | *** | NS | NS | NS | NS | *** | |
| LUM | M2/M4 | NS | NS | NS | NS | *** | *** | NS | NS | *** | *** |
| M6a | NS | NS | NS | NS | *** | ** | NS | NS | ** | *** | |
| M6b | NS | NS | NS | NS | *** | ** | NS | NS | * | *** | |
| Unk | NS | NS | NS | NS | *** | NS | NS | NS | NS | *** | |
| FLU | M2/M4 | NS | NS | NS | *** | *** | ** | NS | NS | *** | *** |
| MEC | M2/M4 | NS | NS | NS | NS | *** | *** | NS | NS | NS | *** |
| M6 | NS | NS | NS | NS | *** | *** | NS | NS | *** | *** | |
| M9 | NS | NS | NS | NS | *** | *** | NS | NS | *** | *** | |
| Unk | NS | NS | NS | NS | *** | NS | NS | NS | NS | *** | |
| MEF | M2/M4a | NS | NS | NS | ** | *** | NS | NS | NS | *** | *** |
| M2/M4b | NS | NS | NS | *** | *** | *** | NS | NS | ** | *** | |
| TOL | M2/M4a | NS | NS | NS | * | *** | ** | NS | NS | *** | *** |
| M2/M4b | NS | NS | NS | ** | *** | *** | NS | NS | *** | *** |
NSAID abbreviations are as follows: ACE, aceclofenac; DIC, diclofenac; LUM, lumiracoxib; FLU, flufenamate; MEC, meclofenamate; MEF, mefenamate; TOL, tolfenamate. NSAIDs grouped in families with anthranilic acid members (top) and acetic acid members (bottom). Metabolite structures and pathways are referenced in Fig. 1 and characterized previously (Schleiff et al., 2021, 2020), and “Unk” were adducts identified by fluorescence but uncharacterizable by mass spectroscopic analysis. Chemical inhibitor phenotyping experiments were statistically analyzed using a one-way ANOVA with multiple comparisons using GraphPad Prism 7.0 to discern CYP isozymes which participate in diphenylamine NSAID bioactivation. Abbreviations and symbols are interpreted as follows: NS, no significant difference;
p > 0.05;
p > 0.01;
p > 0.001.
2.3). Steady-state kinetics for recombinant CYP2C8, 2C9, 2C19, and 3A4
Based on inhibitor phenotyping results, CYP2C8, 2C9, 2C19, and 3A4 were indicated to be contributors to the generation of quinone-species metabolites from diphenylamine-containing NSAIDs. The experimental design for the recombinant enzyme reactions was like that for HLM150 reactions. Reactions were optimized under steady-state conditions as determined by linear product formation, so that CYP Supersome concentrations were 50 nM and reaction time was 60 min (data not shown). Reactions were prepared with 50 nM CYP Supersomes, diphenylamine substrate ranging from 0.8 to 500 μM, and 1 mM dansyl glutathione in 100 mM potassium phosphate buffer (pH 7.4) with 0.1% dimethylsulfoxide. Reactions were preincubated, initiated with an NADPH regenerating system, quenched after 60 min, and further processed as previously described in Section 2.2. Reactions without the NADPH regenerating system served as negative controls. Each set of steady-state reactions were performed three times and in triplicate to account for inter- and intra-day variability, respectively. Initial rates were then calculated and plotted against substrate concentration following background correction. Resultant kinetic profiles were fit to the Michaelis-Menten and Hill equations and the extra sum-of-squares F test in GraphPad Prism 7.0 was used to determine the most statistically probable mechanism and yield best-fit kinetic constants.
2.4). Instrumental analysis of bioactivation reactions
Sample reactions were analyzed as previously described (Schleiff et al., 2021, 2020). Samples were separated by a 4.6 × 150 mm Waters XSelect HSS C18 3.5 μm column using a Shimadzu LC-20AB Prominence liquid chromatograph, then analyzed by fluorescence and absorbance using a Shimadzu RF-10 AXL fluorescence detector and a Shimadzu SPD-10A VP UV-Vis detector, respectively. Solvents A (0.1% formic acid in 90:10 deionized water:acetonitrile) and B (0.1% formic acid in acetonitrile) comprised the mobile phase. The gradient method began with 89% Solvent A which decreased to 67% over 2 min, then to 56% over 9 min, then again to 33% A over 5 min. Solvent A was then increased to 89% over 3 min and held until the end of the run. Total run time per sample was 25 min and the flow rate was 1 mL/min. The fluorescence detector excited samples at 340 nm and detected an emission energy of 525 nm which is optimal for dansyl group fluorescence (Amaya et al., 2018; Gan et al., 2009). Similarly, the absorbance detector was set to detect the optimal absorbance wavelength of for diphenylamine NSAIDs of 270 nm (Gouda et al., 2013). Internal standard dansyl amide was used to normalize analyte responses and responses were quantitated relative to the fluorescent response a standard dilution of dansyl glutathione for bioactivation and to the absorbance of a standard dilution of the parent substrate for depletion.
2.5). Estimating relative CYP contributions to bioactivations and detoxifications.
The scaling of the relative importance of individual CYPs in different metabolic outcomes relied on using the kinetic constants determined in this study and reported hepatic CYP abundances for the average Caucasian adult based on a meta-analysis of data from 50 studies (Achour et al., 2014). The average abundances in the study showed wide variations that reflected differences within the general population due to many factors. Thus, our calculations using the average hepatic CYP levels indicated a common baseline capacity for patients to metabolize NSAIDs down competing pathways. Moreover, they relied on conditions in which observed reaction rates were linearly dependent on NSAID concentration and thus additive. For the Michaelis-Menten mechanism, those conditions are met at low substrate levels in which the observed rate scales as a function of Vmax/Km, i.e. the specificity constant (ksp). Nevertheless, a small subset of kinetic profiles fit best to a positive cooperative model in which specificity shifts from low to high values as a function of increasing substrate concentration. In those cases, we used Vmax/Kh as the upper limit of reaction specificity and thus, maximal CYP contribution through that reaction. Overall, bioactivations involved multiple competing pathways, so that their specificities were summed together for a total bioactivation specificity value (ksp, Tables 2–5) for each CYP. We then subtracted bioactivation specificities from those for the overall metabolism of NSAIDs from depletion experiments to determine the opposing detoxification reaction specificities (ksp, Table 6). The metabolic clearance rate (CL) was calculated from the product of ksp and reported hepatic CYP abundances (Achour et al., 2014), i.e. CYP2C8 (22.4 pmol mg−1 protein, 68%, 0–85), CYP2C9 (61 pmol mg−1 protein, 54%, 0–277), CYP2C19 (11 pmol mg−1 protein, 82%, 0–67), and CYP3A4 (93 pmol mg−1 protein, 81%, 0–601). Finally, the percent contributions of respective CYPs contributing to reactions was then determined by dividing the corresponding CL value by the sum total of CL values for each NSAID and multiplying by 100.
Table 2.
CYP2C9 steady-state bioactivation kinetic parameters for quinone-species metabolites.a
| NSAID | MetID | Path | Model | Vmax | Km or Kh (μM) | h | ksp |
|---|---|---|---|---|---|---|---|
| ACE | M2/M4 | 1, 2 | Michaelis-Menten | 54.7 (51.7–57.8) | 17.8 (14.1–22.4) | 3.01 | |
| M6 | 3 | Michaelis-Menten | 43.5 (41.8–45.3) | 8.1 (6.5–9.9) | 5.37 | ||
| M9 | 4 | Michaelis-Menten | 68.5 (65.0–72.2) | 23.8 (19.4–28.9) | 2.88 | ||
| Unk | Michaelis-Menten | 10.2 (9.7–10.9) | 7.9 (5.8–10.7) | 1.29 | |||
| DIC | M2/M4 | 1, 2 | Michaelis-Menten | 65.4 (63.5–67.4) | 3.0 (2.5–3.6) | 21.8 | |
| M6 | 3 | Michaelis-Menten | 22.9 (22.1–23.7) | 6.4 (5.4–7.7) | 3.58 | ||
| M9 | 4 | Michaelis-Menten | 17.1 (16.4–17.7) | 9.3 (7.7–11.3) | 1.84 | ||
| Unk | Michaelis-Menten | 2.6 (2.3–2.9) | 23.1 (14.9–35.3) | 0.11 | |||
| LUM | M2/M4 | 1, 2 | Hill | 36.2 (35.2–37.2) | 15.4 (14.1–16.8) | 1.7 (1.4–2.0) | 2.35 |
| M6a | 3 | Michaelis-Menten | 13.1 (12.7–13.6) | 7.6 (6.2–9.3) | 1.72 | ||
| M6b | 3 | Hill | 23.1 (22.2–24.3) | 31.9 (28.1–36.6) | 1.5 (1.3–1.8) | 0.72 | |
| Unk | Michaelis-Menten | 23.5 (22.5–24.5) | 27.0 (22.4–32.3) | 0.87 | |||
| FLU | M2/M4 | 1, 2 | Michaelis-Menten | 10.1 (9.6–10.6) | 8.1 (6.4–10.4) | 1.20 | |
| MEC | M2/M4 | 1, 2 | Michaelis-Menten | 12.8 (12.1–13.5) | 16.7 (12.5–21.9) | 0.766 | |
| M6 | 3 | Michaelis-Menten | 9.4 (8.8–10.0) | 18.2 (12.9–25.0) | 0.516 | ||
| M9 | 4 | Michaelis-Menten | 5.2 (5.0–5.4) | 5.5 (4.3–7.1) | 0.945 | ||
| MEF | M2/M4a | 1, 2 | Michaelis-Menten | 25.6 (24.2–27.0) | 17.5 (13.4–22.7) | 1.46 | |
| M2/M4b | 1, 2 | Michaelis-Menten | 35.7 (34.0–37.4) | 12.9 (10.1–16.5) | 2.76 | ||
| TOL | M2/M4a | 1, 2 | Michaelis-Menten | 15.2 (14.6–15.9) | 6.5 (5.2–8.0) | 2.33 | |
| M2/M4b | 1, 2 | Michaelis-Menten | 16.1 (15.6–16.7) | 6.9 (5.8–8.8) | 2.33 |
NSAID abbreviations are as follows: ACE, aceclofenac; DIC, diclofenac; LUM, lumiracoxib; FLU, flufenamate; MEC, meclofenamate; MEF, mefenamate; TOL, tolfenamate. NSAIDs grouped in families with anthranilic acid members (top) and acetic acid members (bottom). Metabolite structures and pathways are referenced in Fig. 1 and characterized previously (Schleiff et al., 2021, 2020), and “Unk” were adducts identified by fluorescence but uncharacterizable by mass spectroscopic analysis. Shown are most statistically preferred mechanisms and associated kinetic constants (95% confidence intervals in parentheses) for kinetic profiles shown in Fig. 3. Vmax is in pmol/min/nmol protein and the specificity constant ksp in pmol/min/nmol protein/μM substrate. For the Michaelis-Menten model, ksp is Vmax/Km, and for the positive cooperativity model, Vmax/Kh. For the latter mechanism, ksp shifts from poor to high as a function of increasing substrate concentration. For total bioactivation ksp calculations (Table 7), we then used Vmax/Kh as the upper limit of reaction specificity and thus maximal contribution for the CYP.
Table 5.
CYP3A4 steady-state bioactivation kinetic parameters for quinone-species metabolites.a
| NSAID | MetID | Path | Model | Vmax | Km (μM) | ksp |
|---|---|---|---|---|---|---|
| ACE | M6 | 3 | Michaelis-Menten | 9.9 (9.3–10.6) | 90.5 (75.5–108.5) | 0.109 |
| DIC | M6 | 3 | Michaelis-Menten | 13.8 (13.2–14.5) | 69.0 (59.7–79.8) | 0.20 |
| LUM | M6a | 3 | Michaelis-Menten | 5.2 (5.1–5.4) | 35.5 (31.4–40.2) | 0.146 |
| FLU | M2/M4 | 1, 2 | Michaelis-Menten | 40.3 (37.6–43.3) | 38.8 (29.7–50.0) | 1.04 |
| MEC | M6 | 3 | Michaelis-Menten | 49.8 (46.8–53.2) | 76.8 (63.5–92.8) | 0.648 |
| MEF | M2/M4a | 1, 2 | Michaelis-Menten | 6.7 (6.4–7.1) | 91.3 (79.5–104.9) | 0.073 |
| M2/M4b | 1, 2 | Michaelis-Menten | 4.1 (3.9–4.2) | 37.9 (32.1–44.6) | 0.108 | |
| TOL | M2/M4a | 1, 2 | Michaelis-Menten | 4.3 (4.1–4.5) | 11.9 (8.6–16.2) | 0.361 |
| M2/M4b | 1, 2 | Michaelis-Menten | 20.0 (19.2–20.9) | 28.7 (24.2–34.0) | 0.699 |
NSAID abbreviations are as follows: ACE, aceclofenac; DIC, diclofenac; LUM, lumiracoxib; FLU, flufenamate; MEC, meclofenamate; MEF, mefenamate; TOL, tolfenamate. NSAIDs grouped in families with anthranilic acid members (top) and acetic acid members (bottom). Metabolite structures and pathways are referenced in Fig. 1 and characterized previously (Schleiff et al., 2021, 2020), and “Unk” denotes adducts identified by fluorescence, but uncharacterizable by mass spectroscopic analysis. Shown are most statistically preferred mechanisms and associated kinetic constants (95% confidence intervals in parentheses) for kinetic profiles in Fig. 6. Vmax is in pmol/min/nmol protein and the specificity constant ksp (Vmax/Km) in pmol/min/nmol protein/μM substrate.
Table 6.
CYP steady-state kinetic parameters for overall metabolism of NSAIDs.a
| NSAID | CYP | Vmax | Km (μM) | ksp |
|---|---|---|---|---|
| ACE | CYP2C8 | 1740 (1640–1850) | 110 (96–130) | 15.8 |
| CYP2C9 | 4970 (4660–5320) | 140 (120–160) | 35.5 | |
| CYP2C19 | 3050 (2760–3410) | 380 (320–460) | 8.0 | |
| CYP3A4 | 7720 (7000–8610) | 260 (210–320) | 29.7 | |
| DIC | CYP2C8 | 1240 (1170–1320) | 83.0 (70–99) | 15.0 |
| CYP2C9 | 12700 (11900–13500) | 340 (310–390) | 37.4 | |
| CYP2C19 | 1940 (1840–2040) | 70.5 (60–82) | 27.5 | |
| CYP3A4 | 5480 (5090–5930) | 130 (110–160) | 42.2 | |
| LUM | CYP2C9 | 5330 (4960–5760) | 240 (210–280) | 22.2 |
| CYP2C19 | 2610 (2450–2790) | 77.2 (64–93) | 33.8 | |
| CYP3A4 | 4440 (4060–4910) | 140 (110–170) | 31.7 | |
| FLU | CYP2C9 | 3550 (3350–3770) | 140 (130–170) | 25.4 |
| CYP2C19 | 2500 (2310–2730) | 150 (120–180) | 16.7 | |
| CYP3A4 | 6120 (5770–6520) | 150 (130–170) | 40.8 | |
| MEC | CYP2C9 | 4280 (3970–4640) | 110 (92–140) | 38.9 |
| CYP2C19 | 2400 (2210–2610) | 160 (130–190) | 15.0 | |
| CYP3A4 | 10700 (9550–12200) | 260 (210–340) | 41.2 | |
| MEF | CYP2C8 | 2390 (2230–2560) | 160 (140–190) | 15.0 |
| CYP2C9 | 3580 (3420–3740) | 75.0 (66–85) | 47.7 | |
| CYP2C19 | 3060 (2830–3320) | 220 (180–260) | 13.9 | |
| CYP3A4 | 3930 (3650–4250) | 89.7 (73–110) | 43.8 | |
| TOL | CYP2C9 | 2510 (2370–2650) | 68.0 (57–81) | 36.9 |
| CYP2C19 | 2070 (1950–2210) | 110 (94–130) | 18.8 | |
| CYP3A4 | 6340 (5840–6910) | 170 (140–210) | 37.3 |
NSAID abbreviations are as follows: ACE, aceclofenac; DIC, diclofenac; LUM, lumiracoxib; FLU, flufenamate; MEC, meclofenamate; MEF, mefenamate; TOL, tolfenamate. NSAIDs grouped in families with anthranilic acid members (top) and acetic acid members (bottom). All kinetic profiles in Fig. 7 best to Michaelis-Menten mechanism and shown are the associated kinetic constants (95% confidence intervals in parentheses). Vmax is in pmol/min/nmol protein and the specificity constant ksp (Vmax/Km) in pmol/min/nmol protein/μM substrate.
3). RESULTS
3.1). CYP2C8, 2C9, 2C19, and 3A4 bioactivated diphenylamine NSAIDs based on chemical inhibition studies.
Chemical inhibitor phenotyping studies provided a qualitative assessment of specific cytochromes P450 participating in the bioactivation of diphenylamine NSAIDs (Fig. 2, Table 1). For all seven drugs, CYP2C9 was identified as a major catalyst which participated in the formation of all 21 previously characterized quinone-species glutathione adducts (Fig. 1) (Schleiff et al., 2021, 2020). CYP3A4 shared the same broad specificity for all NSAIDs based on inhibitor results; however, there was marginal reduction in their bioactivation with only suspected multiply glutathionylated metabolites forming in comparable amounts to inhibitor-free controls. Inhibition of CYP2C19 was similarly broad across the drugs but was even less than that observed for CYP3A4 suggesting another minor contributor to bioactivations. The CYP2C8 inhibitor yielded a more selective effect toward bioactivation of aceclofenac, mefenamate, and tolfenamate. Generally, bioactivations of acetic acid diphenylamine NSAIDs flufenamate, meclofenamate, mefenamate, and tolfenamate were more significantly reduced following exposure to chemical inhibitors. The identification of these CYPs in bioactivation of diphenylamine NSAIDs justified their selection for subsequent quantitative steady-state kinetic assessments. Though the chemical inhibitors in this study are known to be selective for specific CYP isozymes at the concentrations used, they are not entirely specific to individual isozymes and may cause off-target inhibition. As such, this list of enzymes should not be considered comprehensive for the bioactivation of diphenylamine NSAIDs and instead denotes CYP isozymes which are most major to those bioactivations. In following, we established steady-state conditions for reactions with recombinant CYP2C8, 2C9, 2C19 and 3A4 ensuring linearity in response as a function of time and protein concentration (data not shown).
Fig. 2: Chemical inhibitor phenotyping to identify potential roles for CYPs in bioactivations.
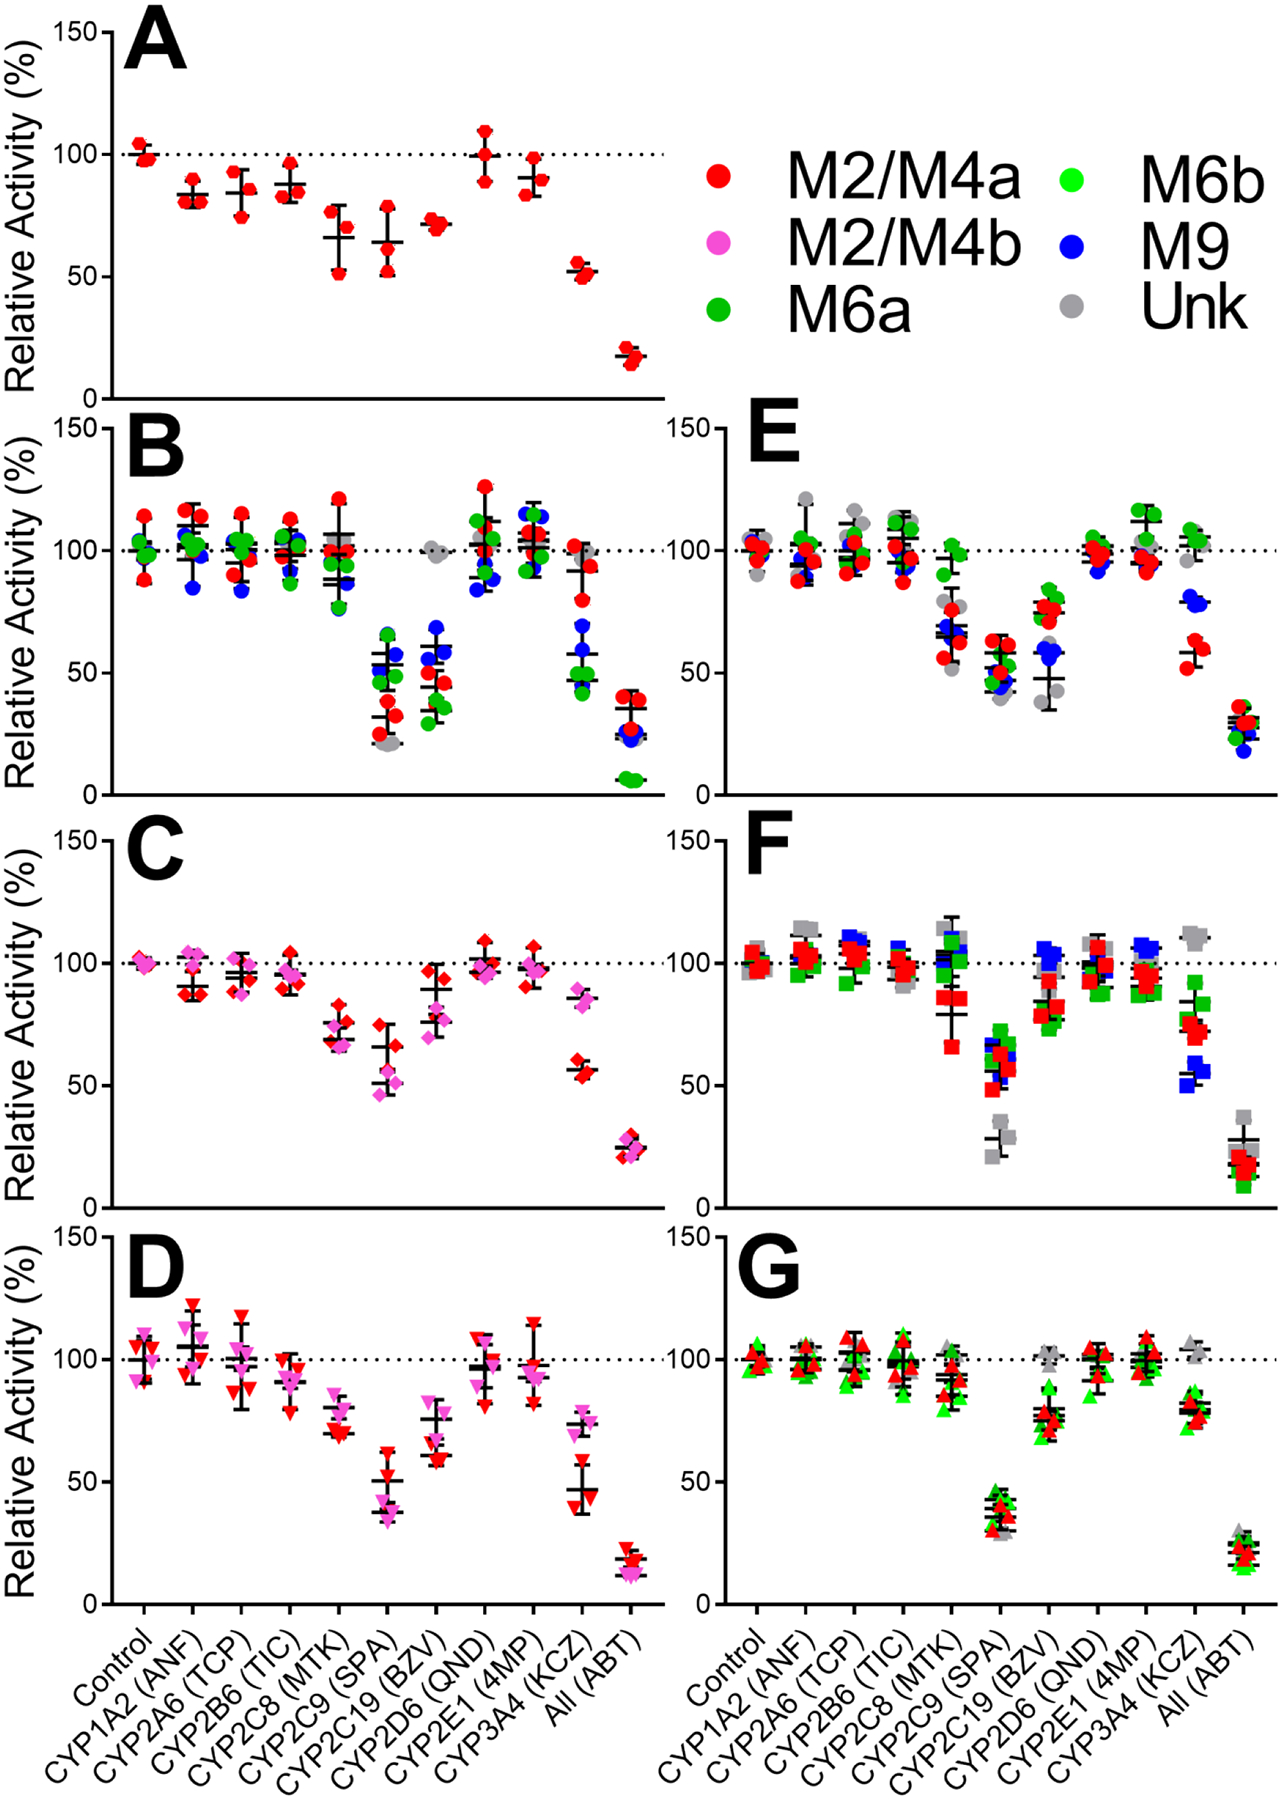
Results for anthranilic acid diphenylamine NSAIDs flufenamate [A], meclofenamate [B], mefenamate [C], and tolfenamate [D] are displayed on the left column. Results for acetic acid diphenylamine NSAIDs aceclofenac [E], diclofenac [F], and lumiracoxib [G] are displayed on the right column. Quinone-species metabolite types are designated by symbol colors where M2/M4a is red, M2/M4b is pink, M6a is green, M6b is light green, M9 is blue, and multiply glutathionylated metabolites are gray. Statistical analyses are displayed in Table 1.
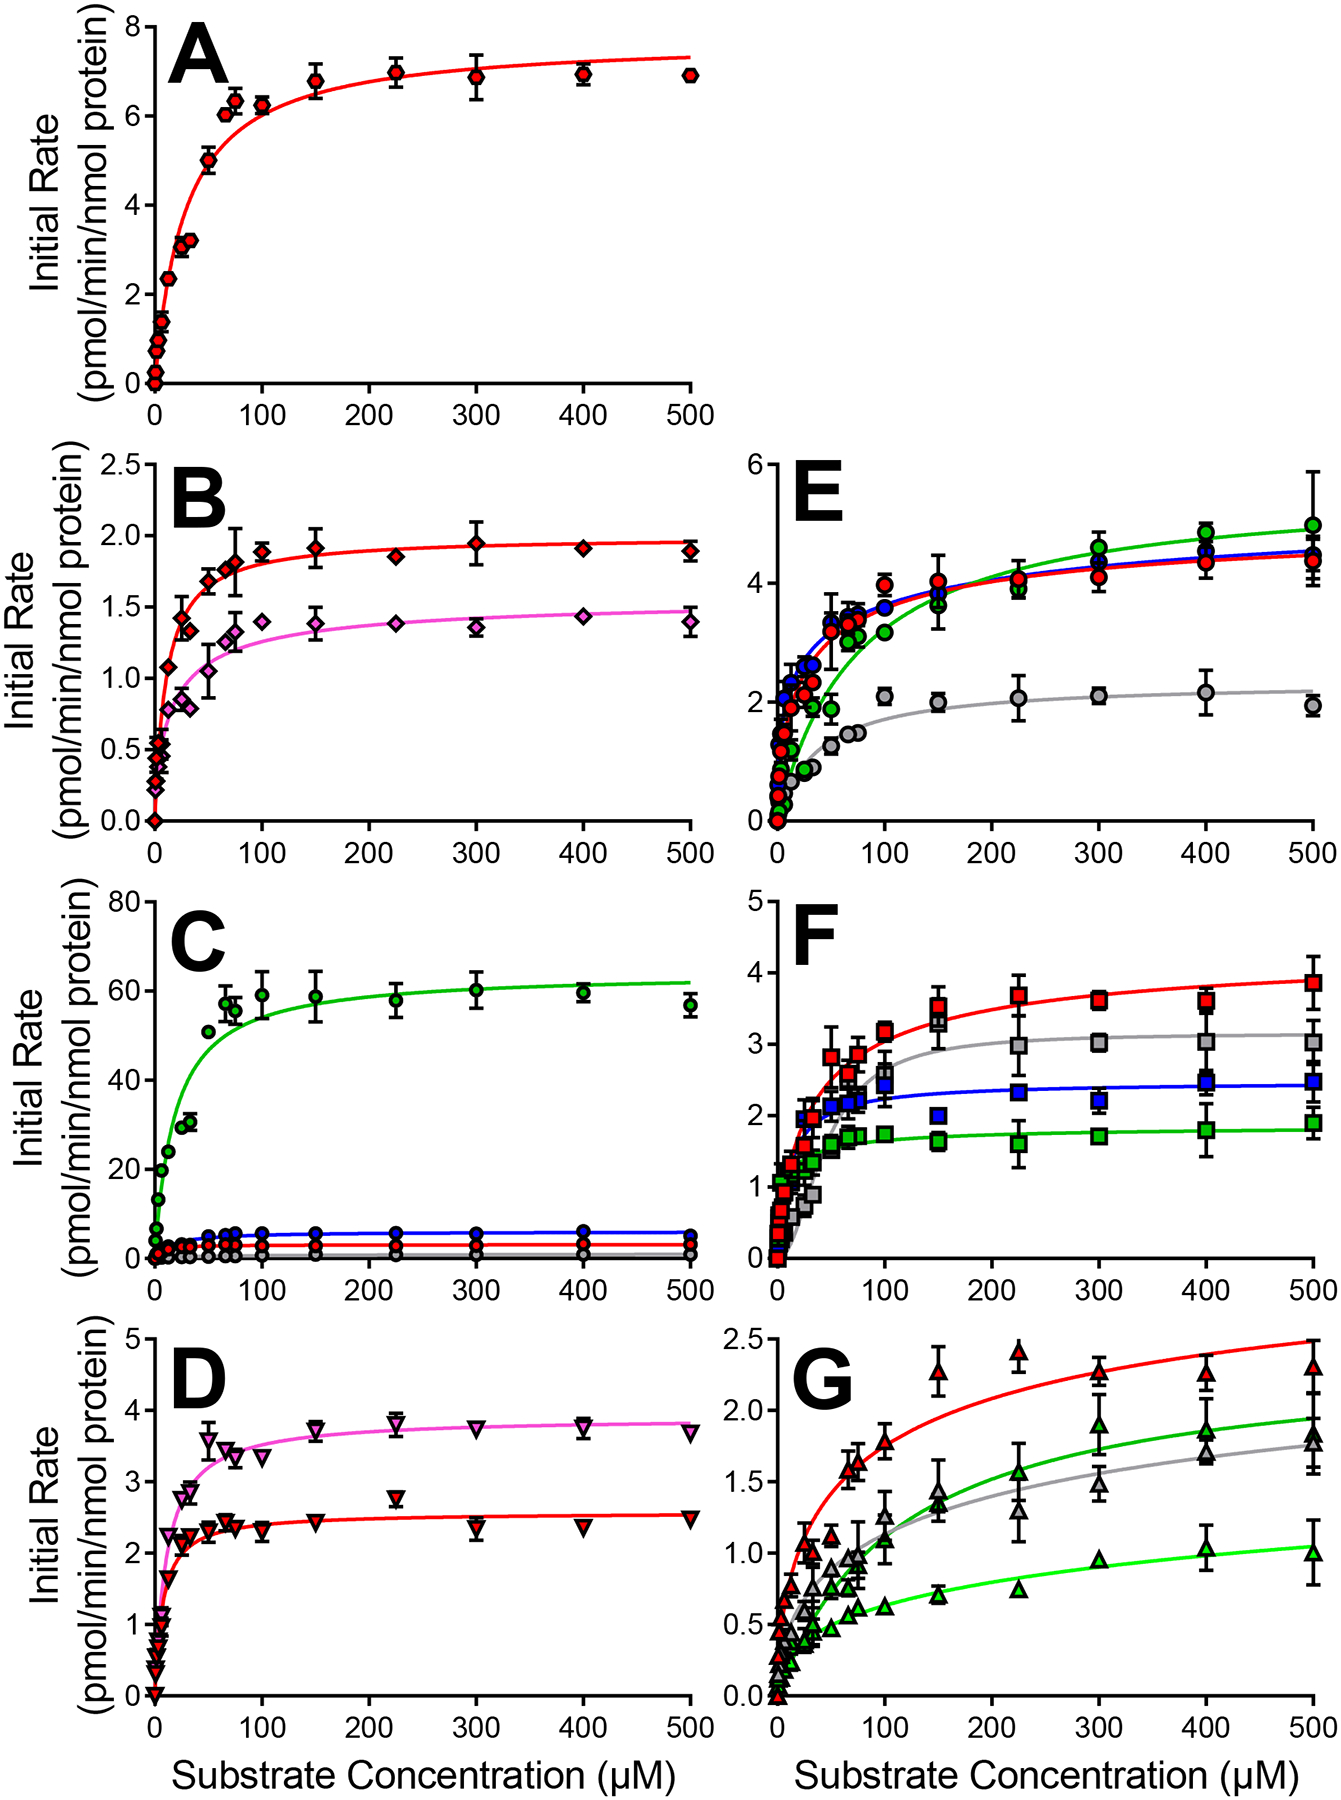
3.2). CYP2C9 showed broad selectivity and high specificity in diphenylamine NSAID bioactivations.
Among the seven NSAIDS, Supersomal CYP2C9 generated 20 of 21 previously observed quinone-species metabolites (Fig. 3, Table 2) reported from human liver microsomal reactions (Schleiff et al., 2021, 2020). The only undetected analyte was the multiply glutathionylated meclofenamate adduct. Most metabolites were formed via a Michaelis-Menten mechanism. Positive cooperativity was observed for M2/M4 and M6b formed during lumiracoxib metabolism, indicating the structure of that NSAID alters the turnover mechanism. Among the NSAIDs, M2/M4 and M6 formation was generally more efficient than that for M9 and multiply glutathionylated metabolites (Fig. 1). For the anthranilic acid diphenylamine NSAIDs, CYP2C9 dominated bioactivation into quinone-species metabolites with high summed specificity constants (ksp) ranging from approximately 6 to 27. Those values for aceclofenac, diclofenac, and lumiracoxib resulted from moderately high Vmax and low Km values. Comparatively, CYP2C9 also efficiently metabolized acetic acid diphenylamine NSAIDs; however, summed ksp values were much lower for those drugs ranging from approximately 1 to 5. In those cases, Vmax values were generally reduced while Km values were comparable or slightly higher than those for anthranilic acid diphenylamine NSAIDs. These general trends indicated that shortening of the acid group significantly reduced CYP2C9 specificity for diphenylamine NSAID bioactivations occurring via monohydroxylation of the phenyl ring (Pathways 1 and 2).
Fig. 3: CYP2C9 kinetic profiles for bioactivation of diphenylamine NSAIDs into quinone-species metabolites.
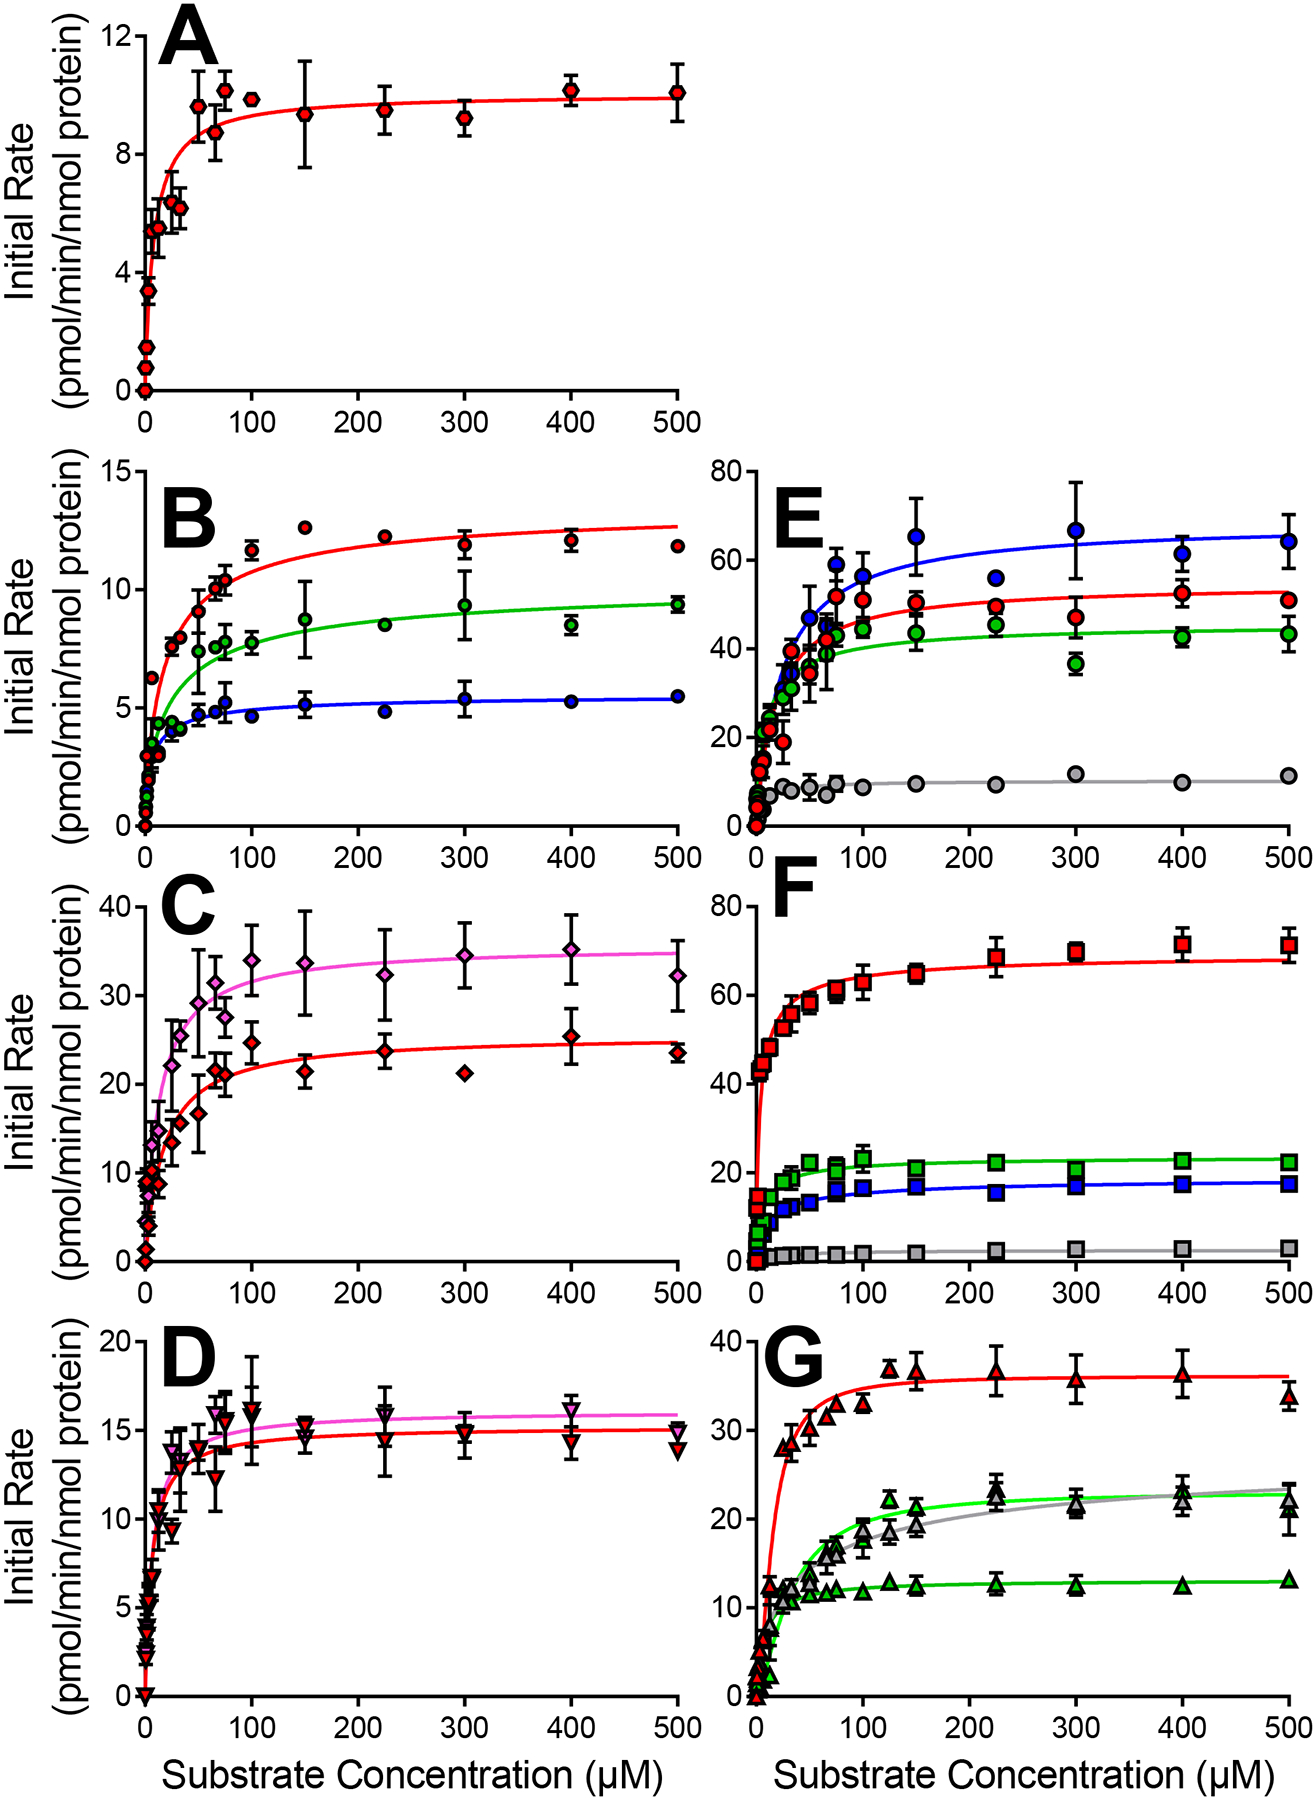
Results for anthranilic acid diphenylamine NSAIDs flufenamate [A], meclofenamate [B], mefenamate [C], and tolfenamate [D] are displayed on the left column. Results for acetic acid diphenylamine NSAIDs aceclofenac [E], diclofenac [F], and lumiracoxib [G] are displayed on the right column. Quinone-species metabolite types are designated by symbol colors where M2/M4a is red, M2/M4b is pink, M6a is green, M6b is light green, M9 is blue, and multiply glutathionylated metabolites are gray. Numerical data is displayed in Table 2 for CYP2C9.
3.3). CYP2C8, 2C19, and 3A4 were more selective and often had lower bioactivation specificity compared to 2C9.
CYP2C8 bioactivations were limited to certain diphenylamine NSAIDs and pathways involving highly inefficient reactions (Fig. 4, Table 3). Of the anthranilic acid diphenylamine NSAIDs, CYP2C8 metabolized only the structurally similar aceclofenac and diclofenac. Despite low Km values, aceclofenac efficiencies were low for pathways leading to M2/M4, M6, and M9 metabolites due to low Vmax values. Diclofenac metabolism led only to M6 with an incredibly low efficiency given low Vmax and considerably high Km values. The acetic acid diphenylamine NSAID mefenamate was converted into both M2/M4a and M2/M4b with low Vmax values and high Km values resulting in similarly low efficiencies.
Fig. 4. CYP2C8 kinetic profiles for bioactivation of diphenylamine NSAIDs into quinone-species metabolites.
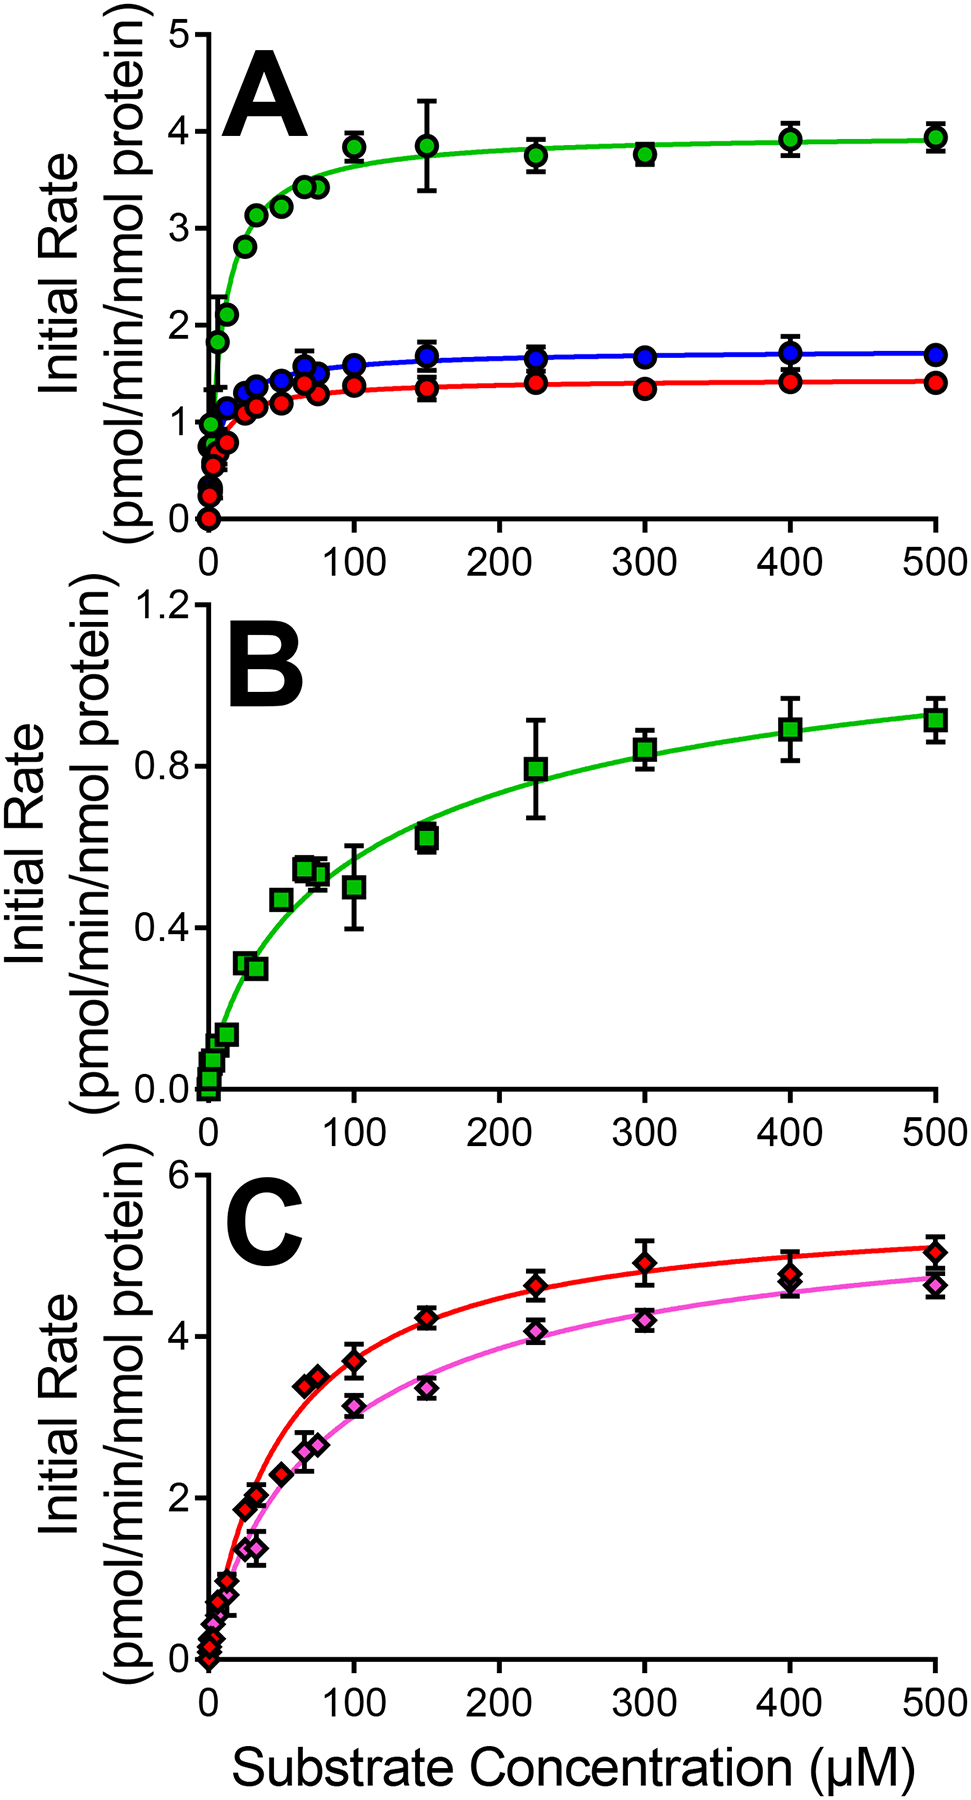
Results for acetic acid diphenylamine NSAIDs aceclofenac [A], diclofenac [B], and anthranilic acid diphenylamine NSAID mefenamate [C] are displayed. Quinone-species metabolite types are designated by symbol colors where M2/M4a is red, M2/M4b is pink, M6a is green, and M9 is blue. Numerical data is displayed in Table 3 for CYP2C8.
Table 3.
CYP2C8 steady-state bioactivation kinetic parameters for quinone-species metabolites.a
| NSAID | MetID | Path | Model | Vmax | Km | ksp |
|---|---|---|---|---|---|---|
| ACE | M2/M4 | 1, 2 | Michaelis-Menten | 1.4 (1.3–1.5) | 6.3 (5.5–7.3) | 0.22 |
| M6 | 3 | Michaelis-Menten | 4.0 (3.9–4.1) | 9.4 (7.8–11.3) | 0.43 | |
| M9 | 4 | Michaelis-Menten | 1.7 (1.6–1.8) | 6.7 (5.7–7.8) | 0.25 | |
| DIC | M2/M4 | 1, 2 | Michaelis-Menten | 1.0 (0.9–1.1) | 78.0 (64.6–94.0) | 0.013 |
| MEF | M2/M4a | 1, 2 | Michaelis-Menten | 5.6 (5.5–5.8) | 51.9 (47.4–56.8) | 0.108 |
| M2/M4b | 1, 2 | Michaelis-Menten | 5.4 (5.2–5.5) | 75.6 (69.1–82.8) | 0.071 |
NSAID abbreviations are as follows: ACE, aceclofenac; DIC, diclofenac; MEF, mefenamate. NSAIDs grouped in families with anthranilic acid members (top) and acetic acid members (bottom). Metabolite structures and pathways are referenced in Fig. 1 and characterized previously (Schleiff et al., 2021, 2020). Shown are most statistically preferred mechanisms and associated kinetic constants (95% confidence intervals in parentheses) for kinetic profiles in Fig. 4. Vmax is in pmol/min/nmol protein and the specificity constant ksp (Vmax/Km) in pmol/min/nmol protein/μM substrate.
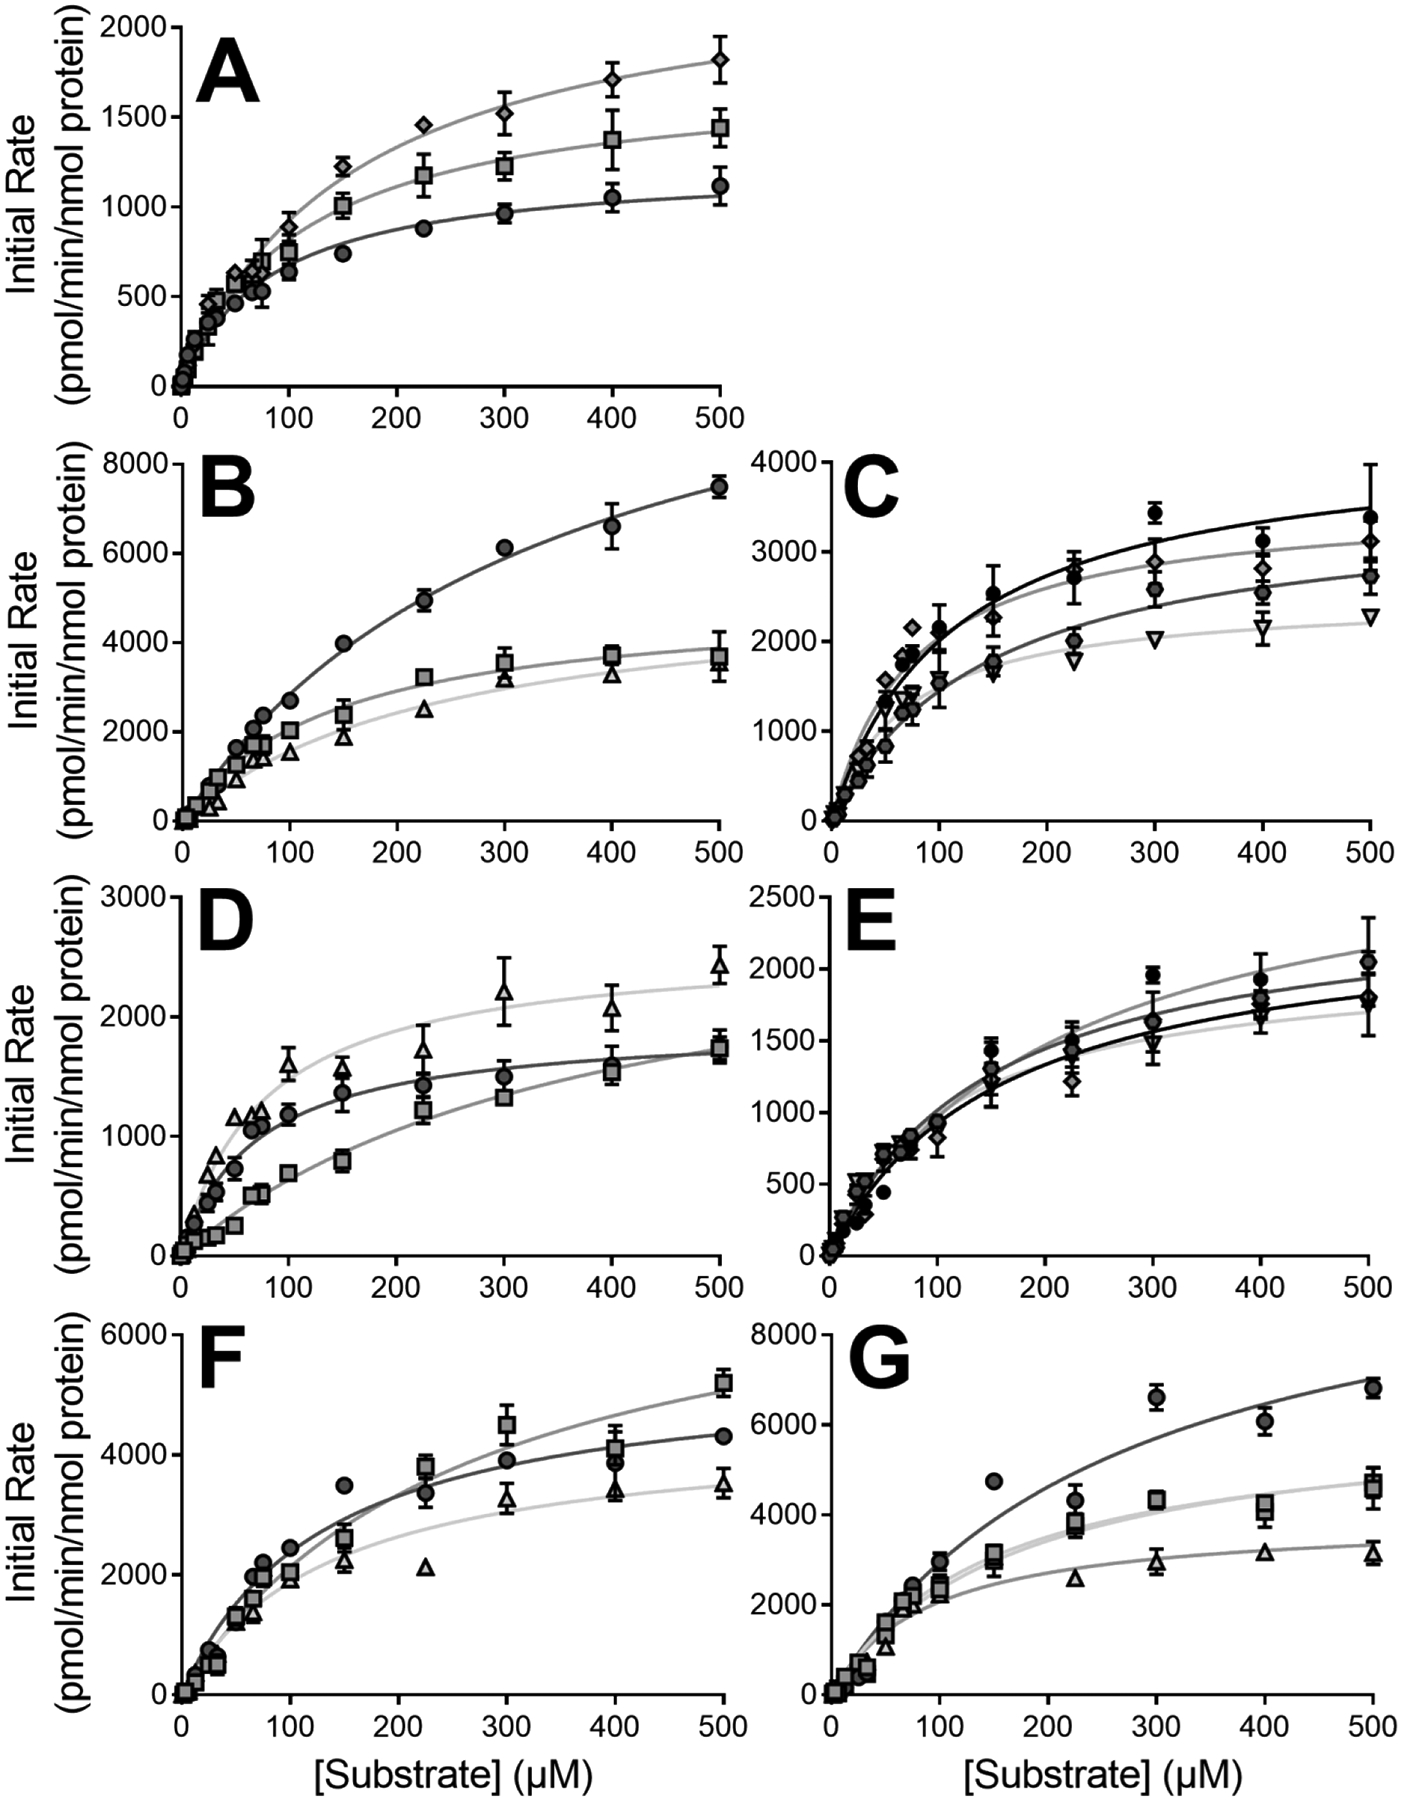
In most cases, CYP2C19 bioactivation of diphenylamine NSAIDs was relatively inefficient (Fig. 5, Table 4). The summed bioactivation specificities (ksp) for six of the NSAIDs was poor and dictated primarily by incredibly low Vmax values with middling Km values. Surprisingly, CYP2C19 was the most efficient metabolizer of meclofenamate among all CYPs. Summed ksp values for reactions were approximately four-fold greater for CYP2C19 than CYP2C9. This quality was primarily due to highly efficient formation of the meclofenamate M6 reflecting a high Vmax and moderately low Km. These kinetic constants indicated that the structural differences of this drug clearly led to a more productive conformation in the catalytic site of CYP2C19.
Fig. 5. CYP2C19 kinetic profiles for bioactivation of diphenylamine NSAIDs into quinone-species metabolites.
Results for anthranilic acid diphenylamine NSAIDs flufenamate [A], meclofenamate [B], mefenamate [C], and tolfenamate [D] are displayed on the left column. Results for acetic acid diphenylamine NSAIDs aceclofenac [E], diclofenac [F], and lumiracoxib [G] are displayed on the right column. Quinone-species metabolite types are designated by symbol colors where M2/M4a is red, M2/M4b is pink, M6a is green, M6b is light green, M9 is blue, and multiply glutathionylated metabolites are gray. Numerical data is displayed in Table 4 for CYP2C19.
Table 4.
CYP2C19 steady-state bioactivation kinetic parameters for quinone-species metabolites.a
| NSAID | MetID | Path | Model | Vmax | Km or Kh | h | ksp |
|---|---|---|---|---|---|---|---|
| ACE | M2/M4 | 1, 2 | Michaelis-Menten | 4.4 (4.2–4.7) | 18.8 (14.2–24.3) | 0.234 | |
| M6 | 3 | Michaelis-Menten | 5.6 (5.2–6.1) | 74.4 (59.0–93.5) | 0.752 | ||
| M9 | 4 | Michaelis-Menten | 4.1 (3.9–4.4) | 8.9 (6.3–12.6) | 0.46 | ||
| Unk | Michaelis-Menten | 2.3 (2.2–2.5) | 37.2 (28.7–47.7) | 0.0618 | |||
| DIC | M2/M4 | 1, 2 | Michaelis-Menten | 4.0 (3.8–4.2) | 27.9 (22.5–34.3) | 0.143 | |
| M6 | 3 | Michaelis-Menten | 1.7 (1.6–1.8) | 4.1 (2.8–6.0) | 0.415 | ||
| M9 | 4 | Michaelis-Menten | 2.5 (2.4–2.6) | 10.9 (8.4–14.0) | 0.229 | ||
| Unk | Hill | 3.2 (3.0–3.4) | 44.9 (39.4–50.9) | 2.0 (1.5–2.8) | 0.712 | ||
| LUM | M2/M4 | 1, 2 | Michaelis-Menten | 2.5 (2.4–2.7) | 36.8 (27.3–48.7) | 0.0679 | |
| M6a | 3 | Michaelis-Menten | 1.8 (1.7–2.0) | 47.6 (35.9–62.5) | 0.0378 | ||
| M6b | 3 | Michaelis-Menten | 2.4 (2.2–2.6) | 115 (91–144) | 0.0209 | ||
| Unk | Michaelis-Menten | 1.1 (0.9–1.2) | 53.0 (37.6–73.5) | 0.0208 | |||
| FLU | M2/M4 | 1, 2 | Michaelis-Menten | 7.7 (7.4–8.1) | 28.5 (24.2–33.6) | 0.270 | |
| MEC | M2/M4 | 1, 2 | Michaelis-Menten | 3.1 (3.0–3.2) | 5.8 (4.6–7.1) | 0.534 | |
| M6 | 3 | Michaelis-Menten | 64.2 (61.2–67.4) | 18.9 (14.9–23.4) | 3.40 | ||
| M9 | 4 | Michaelis-Menten | 6.1 (5.7–6.4) | 15.3 (11.3–20.2) | 0.399 | ||
| Unk | Michaelis-Menten | 1.0 (0.9–1.1) | 40.1 (30.3–52.2) | 0.0249 | |||
| MEF | M2/M4a | 1, 2 | Michaelis-Menten | 2.0 (1.9–2.1) | 10.8 (8.9–12.9) | 0.185 | |
| M2/M4b | 1, 2 | Michaelis-Menten | 1.5 (1.4–1.6) | 13.6 (10.5–17.4) | 0.110 | ||
| TOL | M2/M4a | 1, 2 | Michaelis-Menten | 2.6 (2.5–2.7) | 7.4 (6.3–8.6) | 0.351 | |
| M2/M4b | 1, 2 | Michaelis-Menten | 3.9 (3.8–4.0) | 11.0 (9.6–12.5) | 0.354 |
NSAID abbreviations are as follows: ACE, aceclofenac; DIC, diclofenac; LUM, lumiracoxib; FLU, flufenamate; MEC, meclofenamate; MEF, mefenamate; TOL, tolfenamate. NSAIDs grouped in families with anthranilic acid members (top) and acetic acid members (bottom). Metabolite structures and pathways are referenced in Fig. 1 and characterized previously (Schleiff et al., 2021, 2020), and “Unk” were adducts identified by fluorescence, but uncharacterizable by mass spectroscopic analysis. Shown are most statistically preferred mechanisms and associated kinetic constants (95% confidence intervals in parentheses) for kinetic profiles in Fig. 5. Vmax is in pmol/min/nmol protein and the specificity constant ksp in pmol/min/nmol protein/μM substrate. For the Michaelis-Menten model, ksp is Vmax/Km, and for the positive cooperativity model, Vmax/Kh. For the latter mechanism, ksp shifts from poor to high as a function of increasing substrate concentration. For total bioactivation ksp calculations (Table 7), we then used Vmax/Kh as the upper limit of reaction specificity and thus maximal contribution for the CYP.
CYP3A4 bioactivated all drugs through the Michalis-Menten kinetic mechanism (Fig. 6, Table 5). However, only dehalogenated (M6) metabolites were produced by CYP3A4 for anthranilic acid diphenylamine NSAIDs and for the acetic acid diphenylamine NSAID, meclofenamate. For the other three acetic acid diphenylamine NSAIDs, M2/M4 metabolites were produced in a pattern like that of CYP2C9. Further and in contrast to CYP2C9, no positive cooperativity was observed in 3A4 bioactivation of diphenylamine NSAIDs. Overall, ksp values for acetic acid diphenylamine NSAIDs ranged from 0.2 to 1.0 as determined by moderate Vmax values and high Km values. Anthranilic acid diphenylamine NSAIDs were bioactivated much less efficiently with ksp values ranging from 0.1 to 0.2 due to low Vmax values and even higher Km values. Taken together, CYP3A4 bioactivation specificities were approximately five-fold higher for acetic acid diphenylamine NSAIDs than those for anthranilic acid diphenylamine NSAIDs. Consequently, the additional methylene on the acid group on anthranilic acid diphenylamine NSAIDs suppressed CYP3A4 bioactivation. This trend was not observed for CYP2C9.
Fig. 6. CYP3A4 kinetic profiles for bioactivation of diphenylamine NSAIDs into quinone-species metabolites.
Results for anthranilic acid diphenylamine NSAIDs flufenamate [A], meclofenamate [B], mefenamate [C], and tolfenamate [D] are displayed on the left column. Results for acetic acid diphenylamine NSAIDs aceclofenac [E], diclofenac [F], and lumiracoxib [G] are displayed on the right column. Quinone-species metabolite types are designated by symbol colors where M2/M4a is red, M2/M4b is pink, M6a is green, and M9 is blue. Numerical data is displayed in Table 5 for CYP3A4.
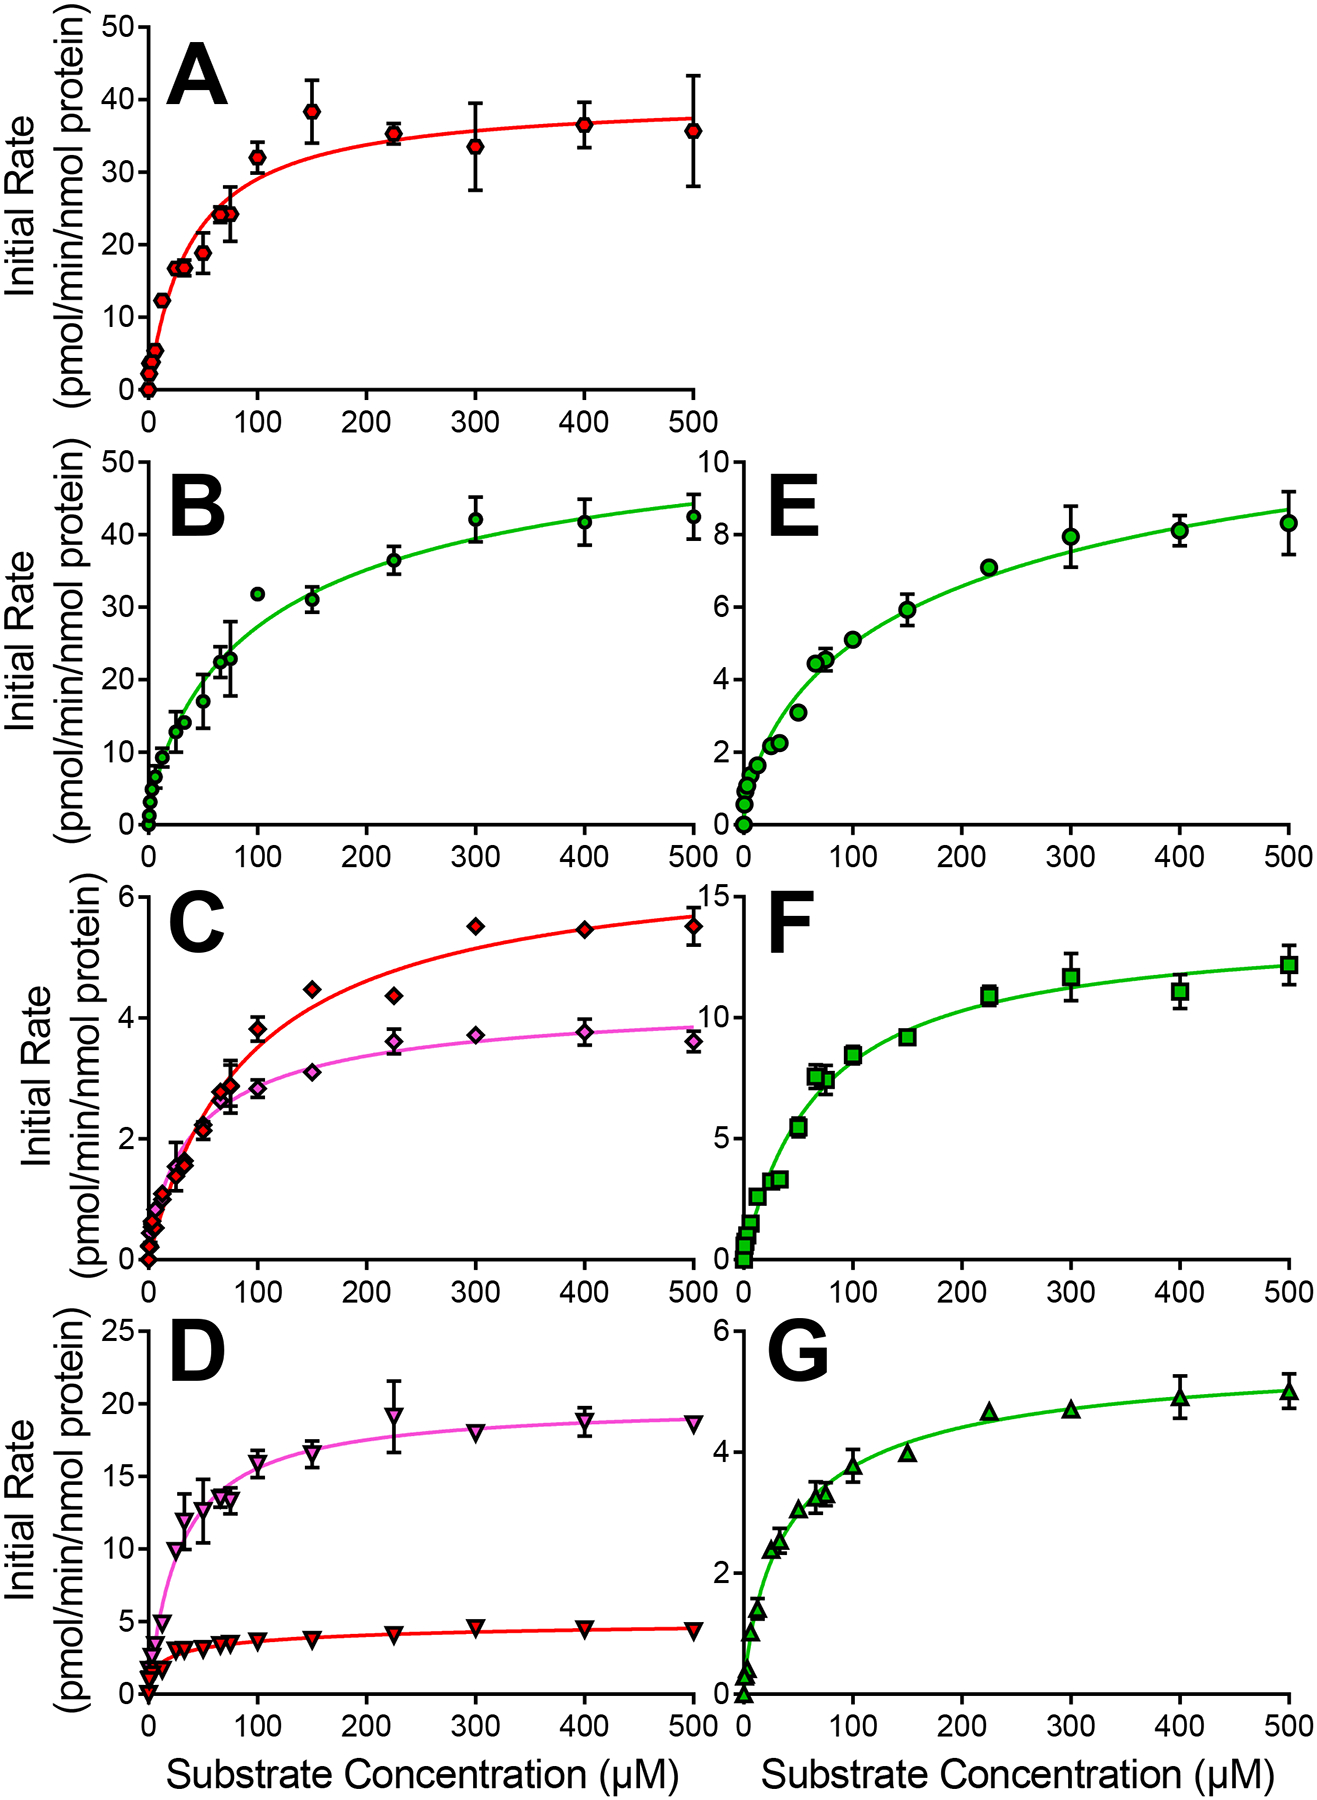
3.4). CYP2C9 and 3A4 primarily determine overall metabolism of diphenylamine NSAIDs.
As a complement to bioactivation studies, we measured overall NSAID metabolic clearance based on depletion kinetics for CYP2C8, 2C9, 2C19, and 3A4. All data fit best to the Michaelis-Menten mechanistic model (Table 6 and Fig. 7). Minor structural modifications between the compounds had little effect on overall depletion as previously observed for their metabolism by human liver microsomes (Schleiff et al., 2021, 2020). However, individual Vmax and Km values varied between anthranilic acid and acetic acid diphenylamine NSAIDs. Specifically, acetic acid diphenylamine NSAIDs had lower relative Vmax and Km values on average. CYP2C8 specificities for aceclofenac, diclofenac, and mefenamate depletion were similar to those observed for CYP2C19. Depletion efficiency by CYP2C19 was two- to three-fold lower than that of CYP2C9 and 3A4 for all substrates but lumiracoxib. In following, CYP2C9 and 3A4 depletion specificities for all diphenylamine NSAIDs apart from fluorinated compounds flufenamate and lumiracoxib were comparable and the highest among all CYPs.
Fig. 7. CYP kinetic profiles for oxidative steady-state NSAID depletion metabolism by CYP2C8, 2C9, 2C19, and 3A4.
Total parent drug oxidative metabolism rates by were measured for CYP2C9 toward acetic acid [A] and anthranilic acid diphenylamine NSAIDs [B], CYP2C8 toward aceclofenac, diclofenac, and mefenamate [C], CYP2C19 toward acetic acid [D] and anthranilic acid diphenylamine NSAIDs [E], and CYP3A4 toward acetic acid [F] and anthranilic acid diphenylamine NSAIDs [G]. Diphenylamine NSAIDs are designated by symbol shapes and colors, where dark gray circles are diclofenac, gray squares are aceclofenac, light gray upward triangles are lumiracoxib, black circles are meclofenamate, dark gray hexagons are flufenamate, gray diamonds are mefenamate, and light gray downward triangles are tolfenamate. Results from the fits of the data to the statistically preferred Michaelis-Menten model are displayed in Table 6.
3.5). In the liver, CYP2C9 dominates bioactivation pathways while CYP3A4 controls detoxification pathways.
Toxic risks from bioactivations will depend on individual CYP contributions to bioactivation and detoxification pathways. In the general population, CYP protein abundance and corresponding activity levels will vary greatly due to age, sex, CYP polymorphisms, concomitant medications, pathophysiological conditions, and other factors. As a baseline for toxic risks, we estimated CYP contributions in NSAID metabolism for the average Caucasian adult by calculating the percent contributions using the specificities of the respective reactions determined herein and reported hepatic CYP abundances (Achour et al., 2014) that modulate their metabolic capacities. As shown in Table 7, hepatic bioactivation of all diphenylamine NSAIDs was dominated by CYP2C9 with the exception of flufenamate in which CYP3A4 was slightly more responsible for those reactions. For meclofenamate, CYP2C19 demonstrated the highest bioactivation specificity yet contributed only to one fifth of the total drug bioactivation due to its low relative protein abundance in the liver. Other than those cases, all other CYP contributions to bioactivations were negligible. Surprisingly, the detoxification of the diphenylamine NSAIDs was dominated by CYP3A4 in all cases. This observation reflected the combination of low bioactivation efficiencies, high overall metabolic specificities, and high hepatic protein levels. When compared to CYP2C9, CYP3A4 provides a critical counterbalance to bioactivation risks by favoring clearance down detoxification pathways over bioactivation. Taken together, such values reveal the relative risks of individual CYPs by comparing individual isozyme activity in both bioactivation and detoxification processes.
Table 7.
Relative CYP contributions to overall bioactivation and detoxification of NSAIDs.a
| Detoxification | |||||||
|---|---|---|---|---|---|---|---|
| Percent | |||||||
| ACE | CYP2C8 | 0.90 | 0.0202 | 2.5 | 14.9 | 0.33 | 7.3 |
| CYP2C9 | 12.6 | 0.769 | 94.3 | 22.9 | 1.40 | 30.7 | |
| CYP2C19 | 1.51 | 0.0166 | 2.0 | 6.49 | 0.07 | 1.6 | |
| CYP3A4 | 0.109 | 0.0101 | 1.2 | 29.6 | 2.75 | 60.4 | |
| DIC | CYP2C8 | 0.013 | 0.00029 | 0 | 15.0 | 0.34 | 6.5 |
| CYP2C9 | 27.3 | 1.67 | 97.9 | 10.1 | 0.62 | 12.0 | |
| CYP2C19 | 1.50 | 0.0165 | 1.0 | 26.0 | 0.29 | 5.5 | |
| CYP3A4 | 0.20 | 0.0186 | 1.1 | 42.0 | 3.91 | 75.9 | |
| LUM | CYP2C9 | 5.66 | 0.345 | 95.8 | 16.5 | 1.01 | 23.4 |
| CYP2C19 | 0.147 | 0.00162 | 0.5 | 33.7 | 0.37 | 8.6 | |
| CYP3A4 | 0.146 | 0.0136 | 3.7 | 31.6 | 2.93 | 68.0 | |
| FLU | CYP2C9 | 1.20 | 0.0732 | 42.3 | 24.2 | 1.48 | 27.6 |
| CYP2C19 | 0.27 | 0.00297 | 1.7 | 16.4 | 0.18 | 3.4 | |
| CYP3A4 | 1.04 | 0.0967 | 55.9 | 39.8 | 3.70 | 69.0 | |
| MEC | CYP2C9 | 2.23 | 0.136 | 55.7 | 36.7 | 2.24 | 36.5 |
| CYP2C19 | 4.36 | 0.0480 | 19.6 | 10.6 | 0.12 | 1.9 | |
| CYP3A4 | 0.648 | 0.0603 | 24.7 | 40.6 | 3.77 | 61.6 | |
| MEF | CYP2C8 | 0.179 | 0.00401 | 1.4 | 14.8 | 0.33 | 4.6 |
| CYP2C9 | 4.22 | 0.257 | 91.4 | 43.5 | 2.65 | 36.9 | |
| CYP2C19 | 0.295 | 0.00325 | 1.2 | 13.6 | 0.15 | 2.1 | |
| CYP3A4 | 0.181 | 0.0168 | 6.0 | 43.6 | 4.06 | 56.4 | |
| TOL | CYP2C9 | 4.66 | 0.284 | 72.8 | 32.2 | 1.97 | 35.5 |
| CYP2C19 | 0.705 | 0.00776 | 2.0 | 18.1 | 0.20 | 3.6 | |
| CYP3A4 | 1.06 | 0.0986 | 25.2 | 36.2 | 3.37 | 60.9 | |
NSAID abbreviations are as follows: ACE, aceclofenac; DIC, diclofenac; LUM, lumiracoxib; FLU, flufenamate; MEC, meclofenamate; MEF, mefenamate; TOL, tolfenamate. NSAIDs grouped in families with anthranilic acid members (top) and acetic acid members (bottom). The bioactivation ksp,total is the summation of associated ksp values reported in Tables 2–5. The detoxification specificity constant (ksp,detox) was calculated as the difference between overall specificity of metabolism (Table 6) and bioactivation ksp,total. Units for specificity constants are pmol/min/nmol protein/μM substrate. The metabolic clearance rate (CL) is the product of ksp and reported CYP abundance in the liver (Achour et al., 2014) in units of pmol metabolite/min/mg microsomal protein. Percent contributions of respective CYPs to reactions was determined by dividing the corresponding CL value by the sum total of CL values for each NSAID.
4). DISCUSSION
4.1). CYP2C9 was the most effective at bioactivating all diphenylamine NSAIDs.
CYP2C9 demonstrated the broadest specificity and highest efficiency for bioactivations of the diphenylamine NSAIDs involving all possible pathways when determined by scaling of kinetic data with CYP hepatic abundances (Achour et al., 2014). That assessment would require clinical studies to account for those effects impacting the relative importance of CYP2C9 bioactivation of NSAIDs. Nonetheless, the generally low reaction Km values for the enzyme was consistent with its preference for anionic substrates (Mancy et al., 1995; Mo et al., 2009). In following, the loss of the carboxylic group upon esterification likely explained the higher Km values between aceclofenac and diclofenac, respectively. Interestingly, the length of the diphenylamine acidic group did not significantly impact the binding of the CYP2C9 substrates yet did impact substrate positioning for catalysis. The Vmax for reactions were much higher for acetic acid diphenylamine NSAIDs than their anthranilic acid counterparts. The short chain acid group presumably better orientates drugs for bioactivation reactions to occur without impacting overall turnover of the drugs. Halogens also play an important role in CYP2C9 specificity based on a review of the qualities of inhibitors and substrates (Beck et al., 2021). In this study, halogens were critical in promoting not just enzyme binding and metabolism but bioactivation reactions for NSAIDs. The favorable impact of halogens on substrate turnover contrasts with the common perception of halogens deactivating and blocking sites of metabolism (Adriani and Yarbrough, 1972; Cnubben et al., 1995; Hernandes et al., 2010). Their absence decreased bioactivation and overall metabolic clearance as shown for mefenamate metabolism. These effects manifested mainly in maximal turnover rates such that the halogens favored bioactivation pathways including their own removal through oxidative dehalogenation. In fact, CYP2C9 exhibited the highest Vmax values among CYP reactions indicating optimal positioning of substrate for ring hydroxylations and subsequent secondary oxidation to form the reactive quinone-species. Importantly, when combined with overall turnover, CYP2C9 bioactivation pathways were the major routes for metabolic clearance of the drugs and thus, CYP2C9 activity would be expected to positively correlate with risk for bioactivation and potentially drug-induced liver injuries arising from those outcomes.
The other CYP2C isozymes played mostly minor roles in bioactivation. CYP2C19 shared the broad specificity observed for CYP2C9 but was much less efficient at NSAID bioactivations without clear trends on the impact of halogens or length of the acidic group. Those findings are consistent with the lower affinity of CYP2C8 and 2C19 for anionic substrates than that observed for CYP2C9 (Reynald et al., 2012). Meclofenamate was the only exception in which reactions involved high affinity and rapid turnover rivaling that for CYP2C9 bioactivations. For that NSAID, the length of the acid group and/or addition of a methyl group played critical roles in mediating binding and catalysis when compared to diclofenac. By contrast, CYP2C8 only converted the bulky dichlorinated NSAIDs into reactive quinone-species metabolites possibly reflecting its preference for large anionic substrates (Schoch et al., 2008). In this case, halogen location and type facilitated substrate binding but failed to facilitate binding orientations favorable to their removal based on the biases toward alternate bioactivation pathways. The higher efficiency of reactions for aceclofenac over diclofenac also suggested preference for the neutralization of the negative charge proximal to sites of oxidation. For both isozymes, the combination of mostly low reaction efficiencies and hepatic expressions makes them not likely to be important in a clinical setting.
4.2). Relatively weak bioactivation made CYP3A4 more important in NSAID detoxification pathways.
CYP3A4 shared broad specificities toward the diphenylamine NSAIDs similar to that observed for CYP2C9 and 2C19, while displaying many distinctive, contrasting features. For bioactivations, CYP3A4 preferred ring hydroxylations over oxidative dehalogenations suggesting differences in accessibility of the sites of metabolism that differed from CYP2C9 and 2C19. In this case, halogens were more likely to induce electron-withdrawing effects to suppress sites of metabolism and/or sterically block access to them as commonly reported in the literature (Cavallo et al., 2016; Cnubben et al., 1995; Mendez et al., 2017; Wilcken et al., 2013). Moreover, the bioactivations and even overall metabolic clearance were more efficient for anthranilic acid diphenylamine NSAIDs than acetic acid ones. The distance of the negative charge from the site of oxidation then affected CYP3A4 specificity for NSAID metabolism. This observation likely reflects the lack of charge complementarity for anionic molecules in the CYP3A4 active site as reported for CYP2C9 (Mancy et al., 1995; Mo et al., 2009). The CYP2C9 and CYP3A4 overall metabolic efficiencies were comparable yet for CYP3A4, lower bioactivation efficiencies and higher hepatic content make CYP3A4 a critical determinant of diphenylamine NSAID detoxification pathways.
4.3). Concluding Remarks
Herein, we revealed critical and opposing roles for CYP2C9 and CYP3A4 in diphenylamine NSAID bioactivation and detoxification, respectively. Their contributions would drive the subsequent extent of daily burden of the corresponding reactive quinone-species metabolites and toxic risks from that exposure. Importantly, clinical outcomes would depend on factors like age, sex, genetic polymorphisms, concomitant drugs, and physiological conditions that favor either CYP2C9 bioactivations or CYP3A4 detoxifications (Guengerich, 1999; Lee et al., 2002). The relationships should yield identifiable patterns in clinical data to substantiate the importance of these bioactivations in toxicological outcomes. Such clinical studies would provide critical validation of the proposed roles of the CYPs in metabolic outcome for NSAIDs with an appropriate consideration for possible acyl glucuronidation pathways (Regan et al., 2010; Van Vleet et al., 2017). Along with CYP expression levels, the intrinsic risks for these drugs share dependence on their respective molecular structures as well. For diphenylamine NSAIDs, the length of the acidic group and halogenation impacted specificity and efficiency for bioactivations and overall metabolism in ways dependent on the specific CYP. Moreover, the acidic group also serves as a site of glucuronidation that may lead to formation of reactive acyl glucuronides as additional, but unconfirmed, toxic insults from exposure to these drugs (Bradshaw et al., 2020). Consideration of those structural features are necessary for accurately assessing toxic risks to improve patient safety for current drugs and drug leads under development. While this study focused on NSAIDs, the diphenylamine moiety serves as a scaffold for other classes of drugs such as targeted cancer therapies (Bhatt et al., 2019; Yu et al., 2020). Thus, these findings have broader impacts on identifying and mitigating bioactivation risks for drugs that were made possible by our novel quantitative kinetic approach.
Acknowledgments:
The authors would like to thank Tamara Keller of the Waters Corporation for her recommendations and support in developing the chromatographic methodology used in this manuscript. We also thank Dr. Jinping Gan of HiFiBiO Therapeutics and Dr. Klarissa Jackson of University of North Carolina – Chapel Hill for their assistance and support in the development and optimization of the fluorescent methodology used. Research reported in this publication was supported by the National Library of Medicine of the National Institutes of Health [Awards R01LM012222 and R01LM012482] and National Institute of General Medicine [Awards R01GM140635]. M. Schleiff was supported by the National Institute of General Medical Sciences [Award T32GM106999]. The content is solely the responsibility of the authors and does not necessarily represent the official views of the National Institutes of Health.
Footnotes
Publisher's Disclaimer: This is a PDF file of an unedited manuscript that has been accepted for publication. As a service to our customers we are providing this early version of the manuscript. The manuscript will undergo copyediting, typesetting, and review of the resulting proof before it is published in its final form. Please note that during the production process errors may be discovered which could affect the content, and all legal disclaimers that apply to the journal pertain.
CRediT Authorship Contribution Statement:
Mary Alexandra Schleiff: Conceptualization, Methodology, Validation, Formal Analysis, Data Curation, Writing – Original, Review, Editing, Visualization. Samantha Crosby: Investigation, Writing – Review, Editing. Madison Blue: Investigation, Writing – Review, Editing. Benjamin Mark Schleiff: Software. Gunnar Boysen: Resources, Writing – Review, Editing. Grover Paul Miller: Conceptualization, Formal Analysis, Data Curation, Writing – Original, Review, Editing, Visualization, Supervision, Project Administration, Funding Acquisition.
Declaration of Interest:
None
Conflict of Interest:
The authors declare that they have no conflicts of interest with the contents of this article.
REFERENCES
- Achour B, Barber J, Rostami-Hodjegan A, 2014. Expression of Hepatic Drug-Metabolizing Cytochrome P450 Enzymes and Their Intercorrelations: A Meta-Analysis. Drug Metab Dispos 42, 1349–1356. 10.1124/dmd.114.058834 [DOI] [PubMed] [Google Scholar]
- Adriani J, Yarbrough WM, 1972. Drugs containing halogen atoms: toxicity and lack of toxicity. J Med Assoc Ga 61, 347–351. [PubMed] [Google Scholar]
- Altman R, Bosch B, Brune K, Patrignani P, Young C, 2015. Advances in NSAID Development: Evolution of Diclofenac Products Using Pharmaceutical Technology. Drugs 75, 859–877. 10.1007/s40265-015-0392-z [DOI] [PMC free article] [PubMed] [Google Scholar]
- Amaya GM, Durandis R, Bourgeois DS, Perkins JA, Abouda AA, Wines KJ, Mohamud M, Starks SA, Daniels RN, Jackson KD, 2018. Cytochromes P450 1A2 and 3A4 Catalyze the Metabolic Activation of Sunitinib. Chem. Res. Toxicol 31, 570–584. 10.1021/acs.chemrestox.8b00005 [DOI] [PMC free article] [PubMed] [Google Scholar]
- Barnette DA, Davis MA, Flynn N, Pidugu AS, Joshua Swamidass S, Miller GP, 2019. Comprehensive Kinetic and Modeling Analyses Revealed CYP2C9 and 3A4 Determine Terbinafine Metabolic Clearance and Bioactivation. Biochemical Pharmacology 113661. 10.1016/j.bcp.2019.113661 [DOI] [PMC free article] [PubMed] [Google Scholar]
- Barnette DA, Schleiff MA, Datta A, Flynn N, Swamidass SJ, Miller GP, 2021. Meloxicam methyl group determines enzyme specificity for thiazole bioactivation compared to sudoxicam. Toxicology Letters 338, 10–20. 10.1016/j.toxlet.2020.11.015 [DOI] [PMC free article] [PubMed] [Google Scholar]
- Barnette DA, Schleiff MA, Osborn LR, Flynn N, Matlock M, Swamidass SJ, Miller GP, 2020. Dual mechanisms suppress meloxicam bioactivation relative to sudoxicam. Toxicology 440, 152478. 10.1016/j.tox.2020.152478 [DOI] [PMC free article] [PubMed] [Google Scholar]
- Beck TC, Beck KR, Morningstar J, Benjamin MM, Norris RA, 2021. Descriptors of Cytochrome Inhibitors and Useful Machine Learning Based Methods for the Design of Safer Drugs. Pharmaceuticals (Basel) 14, 472. 10.3390/ph14050472 [DOI] [PMC free article] [PubMed] [Google Scholar]
- Bhatt AB, Gupta M, Hoang VT, Chakrabarty S, Wright TD, Elliot S, Chopra IK, Monlish D, Anna K, Burow ME, Cavanaugh JE, Flaherty PT, 2019. Novel Diphenylamine Analogs Induce Mesenchymal to Epithelial Transition in Triple Negative Breast Cancer. Front Oncol 9, 672. 10.3389/fonc.2019.00672 [DOI] [PMC free article] [PubMed] [Google Scholar]
- Bradshaw PR, Athersuch TJ, Stachulski AV, Wilson ID, 2020. Acyl glucuronide reactivity in perspective. Drug Discov Today 25, 1639–1650. 10.1016/j.drudis.2020.07.009 [DOI] [PubMed] [Google Scholar]
- Busby WF, Ackermann JM, Crespi CL, 1999. Effect of Methanol, Ethanol, Dimethyl Sulfoxide, and Acetonitrile on In Vitro Activities of cDNA-Expressed Human Cytochromes P-450. Drug Metab Dispos 27, 246–249. [PubMed] [Google Scholar]
- Cavallo G, Metrangolo P, Milani R, Pilati T, Priimagi A, Resnati G, Terraneo G, 2016. The Halogen Bond. Chem. Rev 116, 2478–2601. 10.1021/acs.chemrev.5b00484 [DOI] [PMC free article] [PubMed] [Google Scholar]
- Chauret N, Gauthier A, Nicoll-Griffith DA, 1998. Effect of Common Organic Solvents on in Vitro Cytochrome P450-Mediated Metabolic Activities in Human Liver Microsomes. Drug Metab Dispos 26, 1–4. [PubMed] [Google Scholar]
- Chen M, Suzuki A, Thakkar S, Yu K, Hu C, Tong W, 2016. DILIrank: the largest reference drug list ranked by the risk for developing drug-induced liver injury in humans. Drug Discovery Today 21, 648–653. 10.1016/j.drudis.2016.02.015 [DOI] [PubMed] [Google Scholar]
- Cnubben NHP, Vervoort J, Boersma MG, Rietjens IMCM, 1995. The effect of varying halogen substituent patterns on the cytochrome P450 catalysed dehalogenation of 4-halogenated anilines to 4-aminophenol metabolites. Biochemical Pharmacology 49, 1235–1248. 10.1016/0006-2952(95)00043-Y [DOI] [PubMed] [Google Scholar]
- Davidson MH, 2000. Does differing metabolism by cytochrome P450 have clinical importance? Curr Atheroscler Rep 2, 14–19. 10.1007/s11883-000-0090-4 [DOI] [PubMed] [Google Scholar]
- Davis A, Robson J, 2016. The dangers of NSAIDs: look both ways. Br J Gen Pract 66, 172–173. 10.3399/bjgp16X684433 [DOI] [PMC free article] [PubMed] [Google Scholar]
- Davis MA, Barnette DA, Flynn NR, Pidugu AS, Swamidass SJ, Boysen G, Miller GP, 2019. CYP2C19 and 3A4 Dominate Metabolic Clearance and Bioactivation of Terbinafine Based on Computational and Experimental Approaches. Chem. Res. Toxicol 32, 1151–1164. 10.1021/acs.chemrestox.9b00006 [DOI] [PMC free article] [PubMed] [Google Scholar]
- de Montellano PRO, 2018. 1-Aminobenzotriazole: A Mechanism-Based Cytochrome P450 Inhibitor and Probe of Cytochrome P450 Biology. Med Chem (Los Angeles) 8. 10.4172/2161-0444.1000495 [DOI] [PMC free article] [PubMed] [Google Scholar]
- Easterbrook J, Lu C, Sakai Y, Li AP, 2000. EFFECTS OF ORGANIC SOLVENTS ON THE ACTIVITIES OF CYTOCHROME P450 ISOFORMS, UDP-DEPENDENT GLUCURONYL TRANSFERASE, AND PHENOL SULFOTRANSFERASE IN HUMAN HEPATOCYTES. Drug Metabolism and Disposition 4. [PubMed] [Google Scholar]
- Galati G, Tafazoli S, Sabzevari O, Chan TS, O’Brien PJ, 2002. Idiosyncratic NSAID drug induced oxidative stress. Chemico-Biological Interactions 142, 25–41. 10.1016/S0009-2797(02)00052-2 [DOI] [PubMed] [Google Scholar]
- Gan J, Ruan Q, He B, Zhu M, Shyu WC, Humphreys WG, 2009. In Vitro Screening of 50 Highly Prescribed Drugs for Thiol Adduct Formation: Comparison of Potential for Drug-Induced Toxicity and Extent of Adduct Formation. Chemical Research in Toxicology 22, 690–698. 10.1021/tx800368n [DOI] [PubMed] [Google Scholar]
- Goldkind L, Laine L, 2006. A systematic review of NSAIDs withdrawn from the market due to hepatotoxicity: lessons learned from the bromfenac experience. Pharmacoepidemiology and Drug Safety 15, 213–220. 10.1002/pds.1207 [DOI] [PubMed] [Google Scholar]
- Gouda AA, Kotb El-Sayed MI, Amin AS, El Sheikh R, 2013. Spectrophotometric and spectrofluorometric methods for the determination of non-steroidal anti-inflammatory drugs: A review. Arabian Journal of Chemistry 6, 145–163. 10.1016/j.arabjc.2010.12.006 [DOI] [Google Scholar]
- Guengerich FP, 1999. CYTOCHROME P-450 3A4: Regulation and Role in Drug Metabolism. Annual Review of Pharmacology and Toxicology 39, 1–17. 10.1146/annurev.pharmtox.39.1.1 [DOI] [PubMed] [Google Scholar]
- Hartman JH, Knott K, Miller GP, 2014. CYP2E1 hydroxylation of aniline involves negative cooperativity. Biochemical Pharmacology 87, 523–533. 10.1016/j.bcp.2013.12.003 [DOI] [PubMed] [Google Scholar]
- Hawboldt J, 2008. Adverse Events Associated with NSAIDs. US Pharmacist 33. [Google Scholar]
- Hernandes M, Cavalcanti SM, Moreira DR, de Azevedo W Junior, Leite AC, 2010. Halogen Atoms in the Modern Medicinal Chemistry: Hints for the Drug Design. Current Drug Targets 11, 303–314. 10.2174/138945010790711996 [DOI] [PubMed] [Google Scholar]
- Kang P, Dalvie D, Smith E, Renner M, 2009. Bioactivation of Lumiracoxib by Peroxidases and Human Liver Microsomes: Identification of Multiple Quinone Imine Intermediates and GSH Adducts. Chem. Res. Toxicol 22, 106–117. 10.1021/tx8002356 [DOI] [PubMed] [Google Scholar]
- Khojasteh SC, Prabhu S, Kenny JR, Halladay JS, Lu AYH, 2011. Chemical inhibitors of cytochrome P450 isoforms in human liver microsomes: a re-evaluation of P450 isoform selectivity. Eur J Drug Metab Pharmacokinet 36, 1–16. 10.1007/s13318-011-0024-2 [DOI] [PubMed] [Google Scholar]
- Lee CR, Goldstein JA, Pieper JA, 2002. Cytochrome P450 2C9 polymorphisms: a comprehensive review of the in-vitro and human data: Pharmacogenetics 12, 251–263. 10.1097/00008571-200204000-00010 [DOI] [PubMed] [Google Scholar]
- Li D, Han Y, Meng X, Sun X, Yu Q, Li Y, Wan L, Huo Y, Guo C, 2010. Effect of Regular Organic Solvents on Cytochrome P450-Mediated Metabolic Activities in Rat Liver Microsomes. Drug Metab Dispos 38, 1922–1925. 10.1124/dmd.110.033894 [DOI] [PubMed] [Google Scholar]
- Li T, Tong W, Roberts R, Liu Z, Thakkar S, 2020. DeepDILI: Deep Learning-Powered Drug-Induced Liver Injury Prediction Using Model-Level Representation. Chem. Res. Toxicol acs.chemrestox.0c00374. 10.1021/acs.chemrestox.0c00374 [DOI] [PubMed] [Google Scholar]
- Li Y, Qi X, Xue X, Wu X, Wu Y, Chen M, Xing G, Luan Y, Ren J, 2009. The relationship between diphenylamine structure and NSAIDs-induced hepatocytes injury. Toxicology Letters 186, 111–114. 10.1016/j.toxlet.2009.01.005 [DOI] [PubMed] [Google Scholar]
- Li Ying, Slatter JG, Zhang Z, Li Yan, Doss GA, Braun MP, Stearns RA, Dean DC, Baillie TA, Tang W, 2008. In vitro metabolic activation of lumiracoxib in rat and human liver preparations. Drug Metab Dispos 36, 469–473. 10.1124/dmd.107.019018 [DOI] [PubMed] [Google Scholar]
- Mancy A, Broto P, Dijols S, Dansette PM, Mansuy D, 1995. The substrate binding site of human liver cytochrome P450 2C9: an approach using designed tienilic acid derivatives and molecular modeling. Biochemistry 34, 10365–10375. 10.1021/bi00033a007 [DOI] [PubMed] [Google Scholar]
- Masubuchi Y, Yamada S, Horie T, 1999. Diphenylamine as an important structure of nonsteroidal anti-inflammatory drugs to uncouple mitochondrial oxidative phosphorylation. Biochemical Pharmacology 58, 861–865. 10.1016/S0006-2952(99)00163-X [DOI] [PubMed] [Google Scholar]
- Mendez L, Henriquez G, Sirimulla S, Narayan M, 2017. Looking Back, Looking Forward at Halogen Bonding in Drug Discovery. Molecules 22. 10.3390/molecules22091397 [DOI] [PMC free article] [PubMed] [Google Scholar]
- Mo S-L, Zhou Z-W, Yang L-P, Wei MQ, Zhou S-F, 2009. New insights into the structural features and functional relevance of human cytochrome P450 2C9. Part I. Curr Drug Metab 10, 1075–1126. 10.2174/138920009790820129 [DOI] [PubMed] [Google Scholar]
- Nirogi R, Palacharla RC, Uthukam V, Manoharan A, Srikakolapu SR, Kalaikadhiban I, Boggavarapu RK, Ponnamaneni RK, Ajjala DR, Bhyrapuneni G, 2015. Chemical inhibitors of CYP450 enzymes in liver microsomes: combining selectivity and unbound fractions to guide selection of appropriate concentration in phenotyping assays. Xenobiotica 45, 95–106. 10.3109/00498254.2014.945196 [DOI] [PubMed] [Google Scholar]
- Pillans PI, Ghiculescu RA, Lampe G, Wilson R, Wong R, Macdonald GA, 2012. Severe acute liver injury associated with lumiracoxib. Journal of Gastroenterology and Hepatology 27, 1102–1105. 10.1111/j.1440-1746.2011.07036.x [DOI] [PubMed] [Google Scholar]
- Regan SL, Maggs JL, Hammond TG, Lambert C, Williams DP, Park BK, 2010. Acyl glucuronides: the good, the bad and the ugly. Biopharm Drug Dispos 31, 367–395. 10.1002/bdd.720 [DOI] [PubMed] [Google Scholar]
- Reynald RL, Sansen S, Stout CD, Johnson EF, 2012. Structural characterization of human cytochrome P450 2C19: active site differences between P450s 2C8, 2C9, and 2C19. J Biol Chem 287, 44581–44591. 10.1074/jbc.M112.424895 [DOI] [PMC free article] [PubMed] [Google Scholar]
- Schellinger AP, Carr PW, 2004. Solubility of Buffers in Aqueous–Organic Eluents for Reversed-Phase Liquid Chromatography. LCGC North America 22, 3. [Google Scholar]
- Schleiff MA, Flynn NR, Payakachat S, Schleiff BM, Pinson AO, Province DW, Swamidass SJ, Boysen G, Miller GP, 2020. Significance of Multiple Bioactivation Pathways for Meclofenamate as Revealed through Modeling and Reaction Kinetics. Drug Metab Dispos. 10.1124/dmd.120.000254 [DOI] [PMC free article] [PubMed] [Google Scholar]
- Schleiff MA, Payakachat S, Schleiff BM, Swamidass SJ, Boysen G, Miller GP, 2021. Impacts of diphenylamine NSAID halogenation on bioactivation risks. Toxicology 152832. 10.1016/j.tox.2021.152832 [DOI] [PMC free article] [PubMed] [Google Scholar]
- Schoch GA, Yano JK, Sansen S, Dansette PM, Stout CD, Johnson EF, 2008. Determinants of cytochrome P450 2C8 substrate binding: structures of complexes with montelukast, troglitazone, felodipine, and 9-cis-retinoic acid. J Biol Chem 283, 17227–17237. 10.1074/jbc.M802180200 [DOI] [PMC free article] [PubMed] [Google Scholar]
- Shen S, Marchick MR, Davis MR, Doss GA, Pohl LR, 1999. Metabolic Activation of Diclofenac by Human Cytochrome P450 3A4: Role of 5-Hydroxydiclofenac. Chem. Res. Toxicol 12, 214–222. 10.1021/tx9802365 [DOI] [PubMed] [Google Scholar]
- Shimada T, Yamazaki H, Mimura M, Inui Y, Guengerich FP, 1994. Interindividual Variations in Human Liver Cytochrome P-450 Enzymes Involved in the Oxidation of Drugs, Carcinogens and Toxic Chemicals: Studies with Liver Microsomes of 30 Japanese and 30 Caucasians. J Pharmacol Exp Ther. 270, 414–423. [PubMed] [Google Scholar]
- Spaggiari D, Daali Y, Rudaz S, 2016. An extensive cocktail approach for rapid risk assessment of in vitro CYP450 direct reversible inhibition by xenobiotic exposure. Toxicology and Applied Pharmacology 302, 41–51. 10.1016/j.taap.2016.04.013 [DOI] [PubMed] [Google Scholar]
- Spaggiari D, Geiser L, Daali Y, Rudaz S, 2014a. Phenotyping of CYP450 in human liver microsomes using the cocktail approach. Analytical and Bioanalytical Chemistry; Heidelberg 406, 4875–4887. 10.1007/s00216-014-7915-4 [DOI] [PubMed] [Google Scholar]
- Spaggiari D, Geiser L, Daali Y, Rudaz S, 2014b. A cocktail approach for assessing the in vitro activity of human cytochrome P450s: An overview of current methodologies. Journal of Pharmaceutical and Biomedical Analysis, JPBA Reviews 2014 101, 221–237. 10.1016/j.jpba.2014.03.018 [DOI] [PubMed] [Google Scholar]
- Sriuttha P, Sirichanchuen B, Permsuwan U, 2018a. Hepatotoxicity of Nonsteroidal Anti-Inflammatory Drugs: A Systematic Review of Randomized Controlled Trials [WWW Document]. International Journal of Hepatology. 10.1155/2018/5253623 [DOI] [PMC free article] [PubMed] [Google Scholar]
- Sriuttha P, Sirichanchuen B, Permsuwan U, 2018b. Hepatotoxicity of Nonsteroidal Anti-Inflammatory Drugs: A Systematic Review of Randomized Controlled Trials. Int J Hepatol 2018. 10.1155/2018/5253623 [DOI] [PMC free article] [PubMed] [Google Scholar]
- Tang W, Stearns RA, Wang RW, Chiu S-HL, Baillie TA, 1999. Roles of Human Hepatic Cytochrome P450s 2C9 and 3A4 in the Metabolic Activation of Diclofenac †. Chem. Res. Toxicol 12, 192–199. 10.1021/tx9802217 [DOI] [PubMed] [Google Scholar]
- Thakkar S, Chen M, Fang H, Liu Z, Roberts R, Tong W, 2018. The Liver Toxicity Knowledge Base (LKTB) and drug-induced liver injury (DILI) classification for assessment of human liver injury. Expert Review of Gastroenterology & Hepatology 12, 31–38. 10.1080/17474124.2018.1383154 [DOI] [PubMed] [Google Scholar]
- Tornio A, Neuvonen PJ, Backman JT, 2006. The CYP2C8 inhibitor gemfibrozil does not increase the plasma concentrations of zopiclone. European Journal of Clinical Pharmacology; Heidelberg 62, 645–51. 10.1007/s00228-006-0155-6 [DOI] [PubMed] [Google Scholar]
- Van Vleet TR, Liu H, Lee A, Blomme EAG, 2017. Acyl glucuronide metabolites: Implications for drug safety assessment. Toxicol Lett 272, 1–7. 10.1016/j.toxlet.2017.03.003 [DOI] [PubMed] [Google Scholar]
- Venkataraman H, den Braver MW, Vermeulen NPE, Commandeur JNM, 2014. Cytochrome P450-mediated bioactivation of mefenamic acid to quinoneimine intermediates and inactivation by human glutathione S-transferases. Chem Res Toxicol 27, 2071–2081. 10.1021/tx500288b [DOI] [PubMed] [Google Scholar]
- Wilcken R, Zimmermann MO, Lange A, Joerger AC, Boeckler FM, 2013. Principles and Applications of Halogen Bonding in Medicinal Chemistry and Chemical Biology. Journal of Medicinal Chemistry 56, 1363–1388. 10.1021/jm3012068 [DOI] [PubMed] [Google Scholar]
- Yan Z, Li J, Huebert N, Caldwell GW, Du Y, Zhong H, 2005. Detection of a novel reactive metabolite of diclofenac: evidence for CYP2C9-mediated bioactivation via arene oxides. Drug Metab Dispos 33, 706–713. 10.1124/dmd.104.003095 [DOI] [PubMed] [Google Scholar]
- Yu J, Zhou P, Du W, Xu R, Yan G, Deng Y, Li X, Chen Y, 2020. Metabolically stable diphenylamine derivatives suppress androgen receptor and BET protein in prostate cancer. Biochemical Pharmacology 177, 113946. 10.1016/j.bcp.2020.113946 [DOI] [PubMed] [Google Scholar]