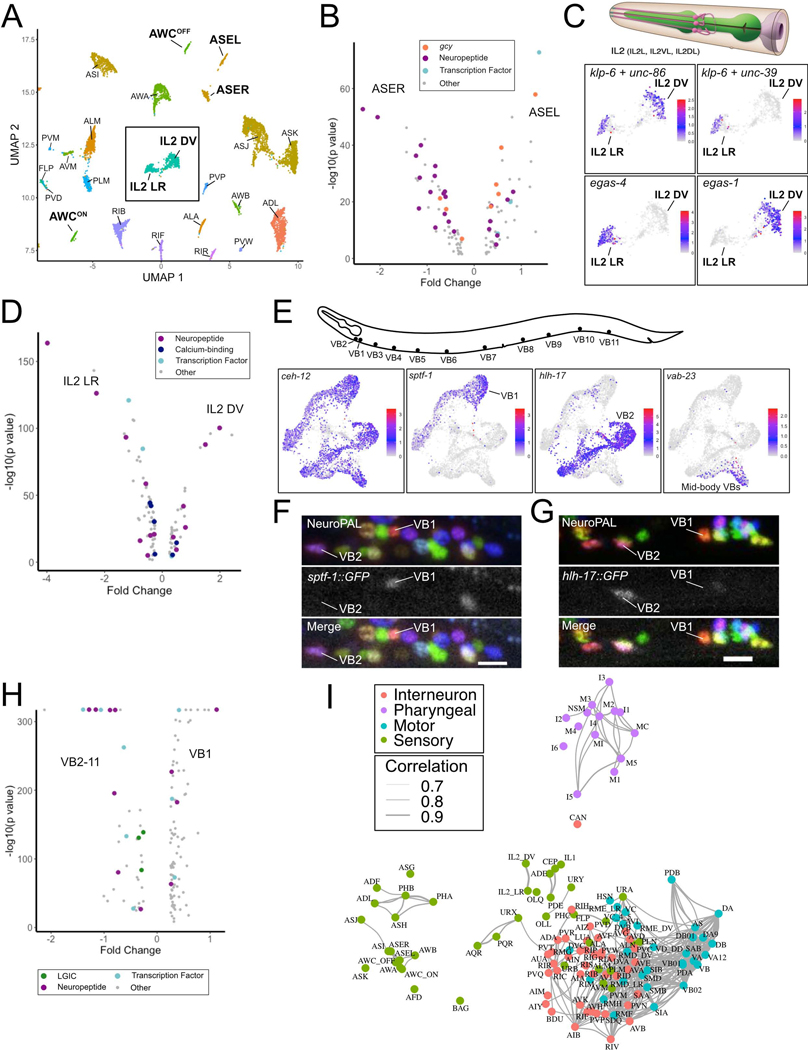
Figure 2. Identification of neuron sub-types.
A) UMAP of neurons with molecularly distinct subtypes (bold labels) from neuronal UMAP (Figure 1B). Inset denotes IL2 DV and IL2 LR clusters. B) Volcano plot of differentially expressed genes (FDR < 0.05) for ASER vs ASEL. Guanylyl cyclases (gcy), neuropeptides, and transcription factors are marked. C) (Top) 3 pairs of IL2 sensory neurons (IL2L/R, IL2VL/R, IL2DL/R) from WormAtlas. (Bottom) UMAP inset from A showing normalized expression of marker genes for all IL2 neurons (klp-6, unc-86), IL2 LR (unc-39, egas-4) and IL2 DV (egas-1). D) Volcano plot of differentially expressed genes (FDR < 0.05) between IL2 sub-types. E) (Top) VB motor neuron soma in the ventral nerve cord. (Bottom) sub-UMAPs of VB neurons highlighting VB marker (ceh-12) and genes (sptf-1, hlh-17, vab-23) expressed in specific VB sub-clusters. F) Confocal images in NeuroPAL show sptf-1::GFP expression in VB1 but not VB2 and G) selective expression of hlh-17::GFP in VB2 but not VB1. Scale bars = 10 μm. H) Volcano plot of differentially expressed genes (LGICs –ligand-gated ion channels) (FDR < 0.05) for VB1 vs all other VB neurons. I) C. elegans neuron types in a force-directed network by transcriptomic similarities. Colors denote distinct neuron modalities and widths of edges (Pearson correlation coefficients > 0.7) show strengths of transcriptome similarity between each pair of neuron types. See also Figure S4.

