Abstract
Background
Studies have demonstrated an inverse relationship between body mass index (BMI) and the risk of developing lung cancer. We conducted a retrospective cohort study evaluating baseline quantitative computed tomography (CT) measurements of body composition, specifically muscle and fat area in a large CT lung screening cohort (CTLS). We hypothesized that quantitative measurements of baseline body composition may aid in risk stratification for lung cancer.
Methods
Patients who underwent baseline CTLS between January 1st, 2012 and September 30th, 2014 and who had an in-network primary care physician were included. All patients met NCCN Guidelines eligibility criteria for CTLS. Quantitative measurements of pectoralis muscle area (PMA) and subcutaneous fat area (SFA) were performed on a single axial slice of the CT above the aortic arch with the Chest Imaging Platform Workstation software. Cox multivariable proportional hazards model for cancer was adjusted for variables with a univariate p < 0.2. Data were dichotomized by sex and then combined to account for baseline differences between sexes.
Results
One thousand six hundred and ninety six patients were included in this study. A total of 79 (4.7%) patients developed lung cancer. There was an association between the 25th percentile of PMA and the development of lung cancer [HR 1.71 (1.07, 2.75), p < 0.025] after adjusting for age, BMI, qualitative emphysema, qualitative coronary artery calcification, and baseline Lung-RADS® score.
Conclusions
Quantitative assessment of PMA on baseline CTLS was associated with the development of lung cancer. Quantitative PMA has the potential to be incorporated as a variable in future lung cancer risk models.
Keywords: Lung cancer screening, Lung cancer, Quantitive pectoralis muscle area
Introduction
Body mass index (BMI), calculated using a patient’s current weight and height and measured in kg/m2, is inversely related to the risk for developing lung cancer [1–10]. A meta-analysis of prospective cohort studies investigating this relationship found that every 5 kg/m2 increase in BMI corresponded with a 3.3% decrease in the risk of lung cancer [11]. However, despite the general consensus that BMI is protective, the utility of BMI in models for patient’s risk for lung cancer is limited given the vast differences in body composition with regard to muscle area and fat area, particularly between males and females [12]. To better understand the relationship between BMI and lung cancer risk, we utilized computed tomographic (CT) imaging to quantitatively assess a patient’s body composition profile [13].
Utilizing quantitative CT imaging to measure pectoralis muscle area (PMA) and subcutaneous fat area (SFA), we sought to evaluate the relationship between body composition and risk of lung cancer development using a large CT lung screening (CTLS) cohort.
Materials and Methods
Subjects
This is a retrospective, single-center study# DR13-1521, approved by the hospital institutional review board. We performed quantitative CT analysis of PMA and SFA on all patients who underwent baseline CTLS at our institution from January 1st, 2012 to September 30th, 2014 and who also had an “in-network” primary care physician. To qualify for screening, patients had to meet the National Comprehensive Cancer Network (NCCN) guidelines® lung cancer Screening high-risk criteria for lung cancer [14]. This includes group (1) patients aged 55–74 years with ≥ 30 pack year smoking history and smoking cessation < 15 years or group (2) age ≥ 50 years and ≥ 20 pack year smoking history and 1 additional risk factor (other than 2nd hand smoke). All patients were asymptomatic and had a physician order for CTLS, were free of lung cancer for ≥ 5 years, and had no known metastatic disease.
Clinical Variables
Clinical variables were collected as part of the usual clinical care and stored in a centralized CTLS data repository. Additional clinical variables not already contained in the centralized CTLS data repository were collected by review of the electronic medical record. Participants’ medical records were reviewed through September 30th, 2017 for patient demographics, past medical history, and cancer. Emphysema and coronary artery calcification (CAC) were determined semi-qualitatively by staff radiologists at Lahey and recorded as present or absent. Lung CT Screening Reporting and Data System (Lung-RADS®) [15] scoring data and all clinical variables were collected and stored utilizing a custom-designed database (FileMaker ProVersion 11, Filemaker Inc., Santa Clara, California). Lung-RADS® scores were further categorized into negative (Lung-RADS® 1 and 2) and positive (Lung-RADS® 3 and 4); Lung-RADS® 0 scans were deemed unsatisfactory for lung cancer surveillance.
Quantitative Measurements
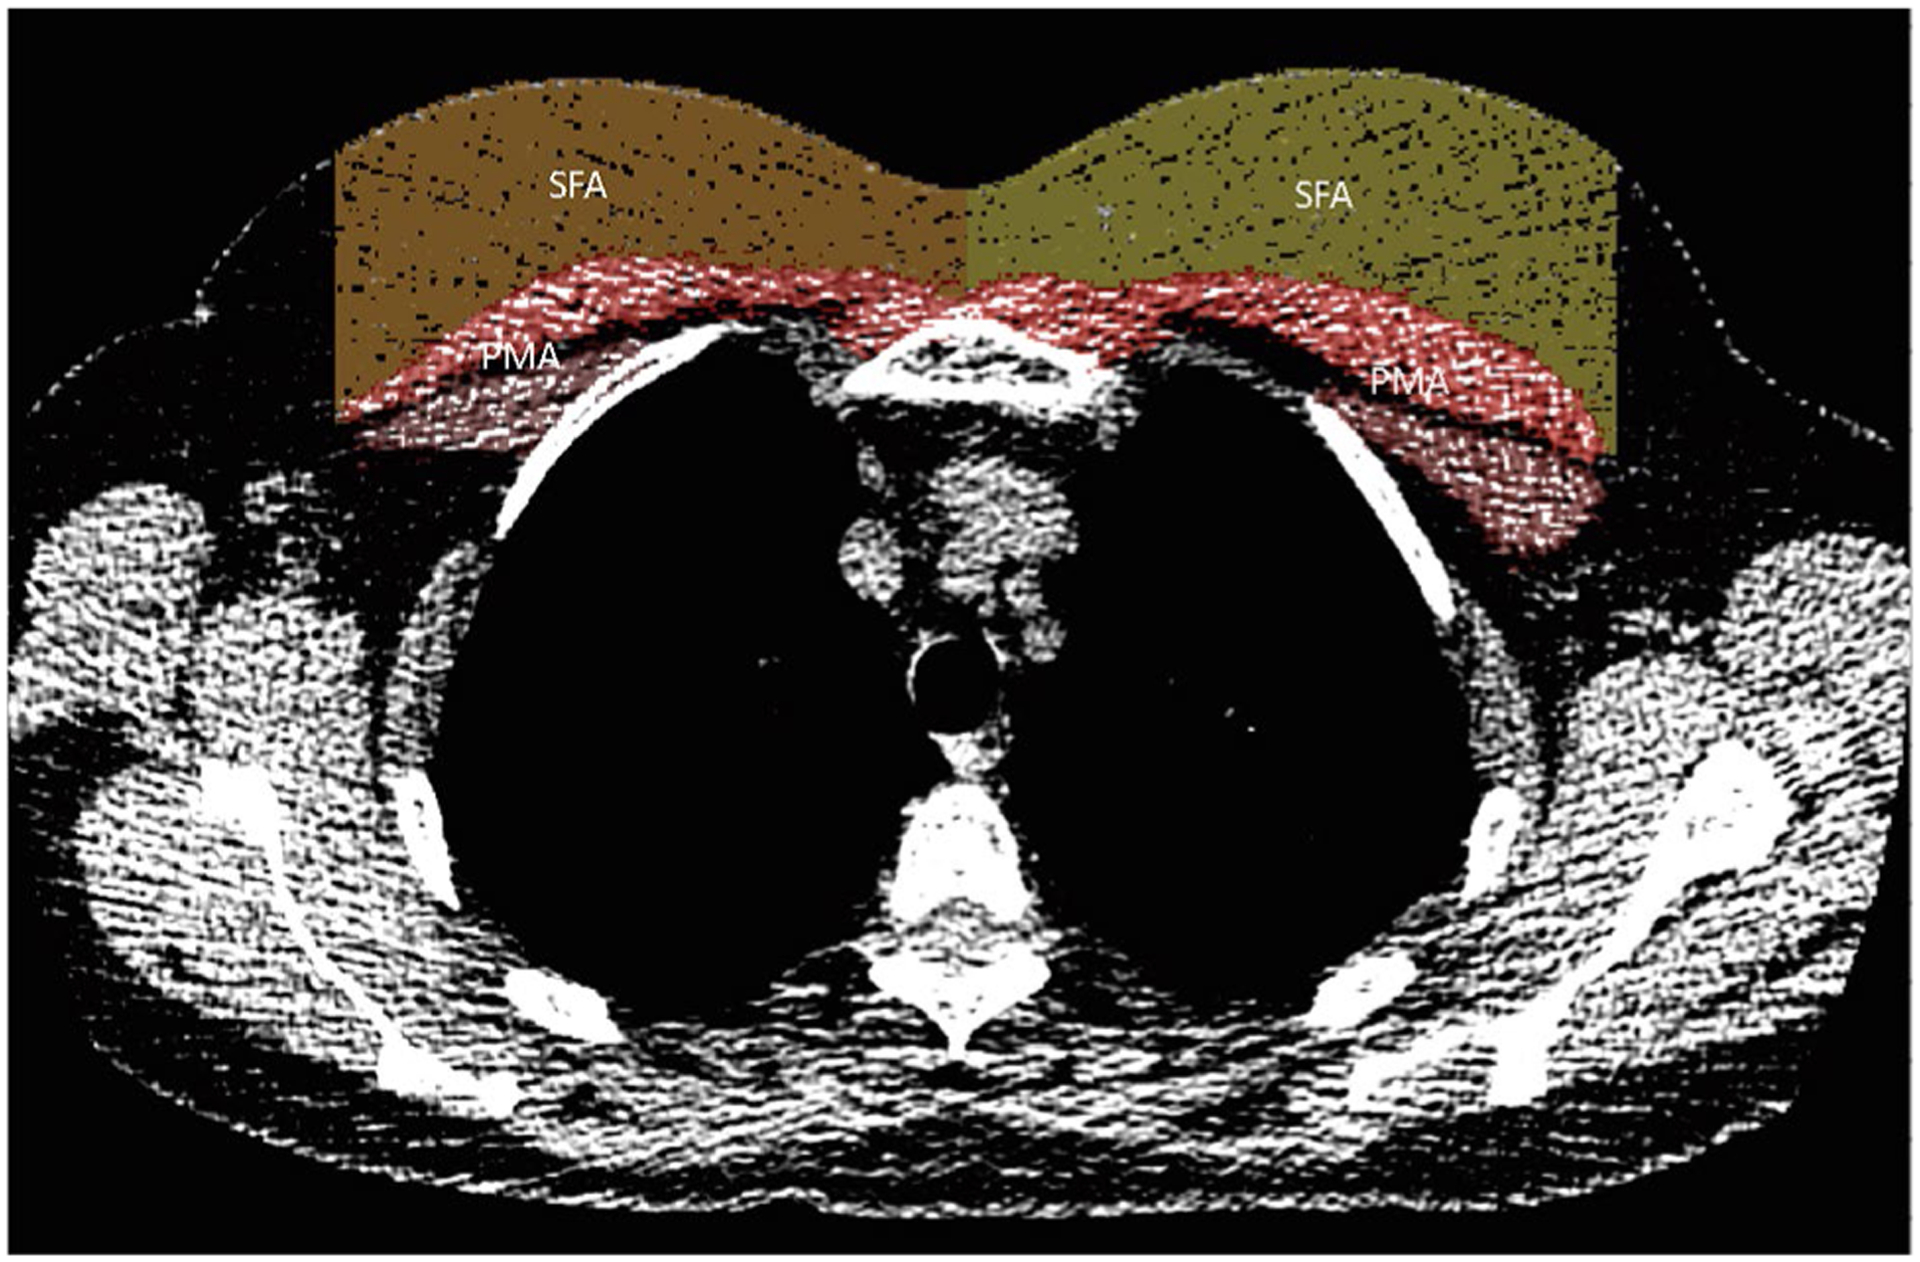
Scans were de-identified, and quantitative analysis of PMA and SFA was performed by one technician who was blinded to outcomes obtained from a single axial slice at the aortic arch trifurcation using the Chest Imaging Platform workstation (www.chestimagingplatform.org) [16]. Pectoralis major and pectoralis minor muscle areas were segmented bilaterally, resulting in an aggregate area (mm2) measurement. Subcutaneous fat was measured anterior to the pectoralis muscles on the same image with margins extending as far as the pectoralis minor as shown in Fig. 1.
Fig. 1.

CT with labeled PMA (pectoralis muscle area) and SFA (sub-cutaneous fat area)
CT Scans
All CTLS examinations were performed on ≥ 64-row multi-detector CT scanners (LightSpeed VCT and Discovery VCT [GE Medical Systems, Milwaukee, Wisconsin]; Somatom Definition [Siemens AG, Erlangen, Germany]; iCT [Philips Medical Systems, Andover, Massachusetts]) at 100 kV and 30–100 mA depending on the scanner and the availability of iterative reconstruction software. Patient positioning with arms overhead was part of the routine scanning protocol. Axial images were obtained at 1.25–1.5 mm thickness with 50% overlap and reconstructed with both soft tissue and lung kernels. Axial maximum-intensity projections (16 × 2.5 mm) and coronal and sagittal multiplanar reformatted images were reconstructed and used for interpretation. The average CT dose index was 1.25 ± 0.2 mGy (range 1.05–1.56 mGy), and the average dose length product was 48.1 ± 9 mGy cm (range 33–61 mGy cm).
Statistical Analysis
The t-test was used to evaluate differences in PMA and SFA between males and females. Univariate analysis was performed using Cox proportional hazards regression to identify clinical and demographic variables associated with the outcomes of time to lung cancer. Variables with a univariate p value < 0.2 were entered into a multivariable Cox proportional hazards model for cancer. Kaplan–Meier plots were generated to visualize the associations between quantitative PMA and cancer. The log-rank test was used to evaluate for a significant association. Significance levels were set a p value < 0.05. All statistical analyses were performed using STATA14.2 software.
Results
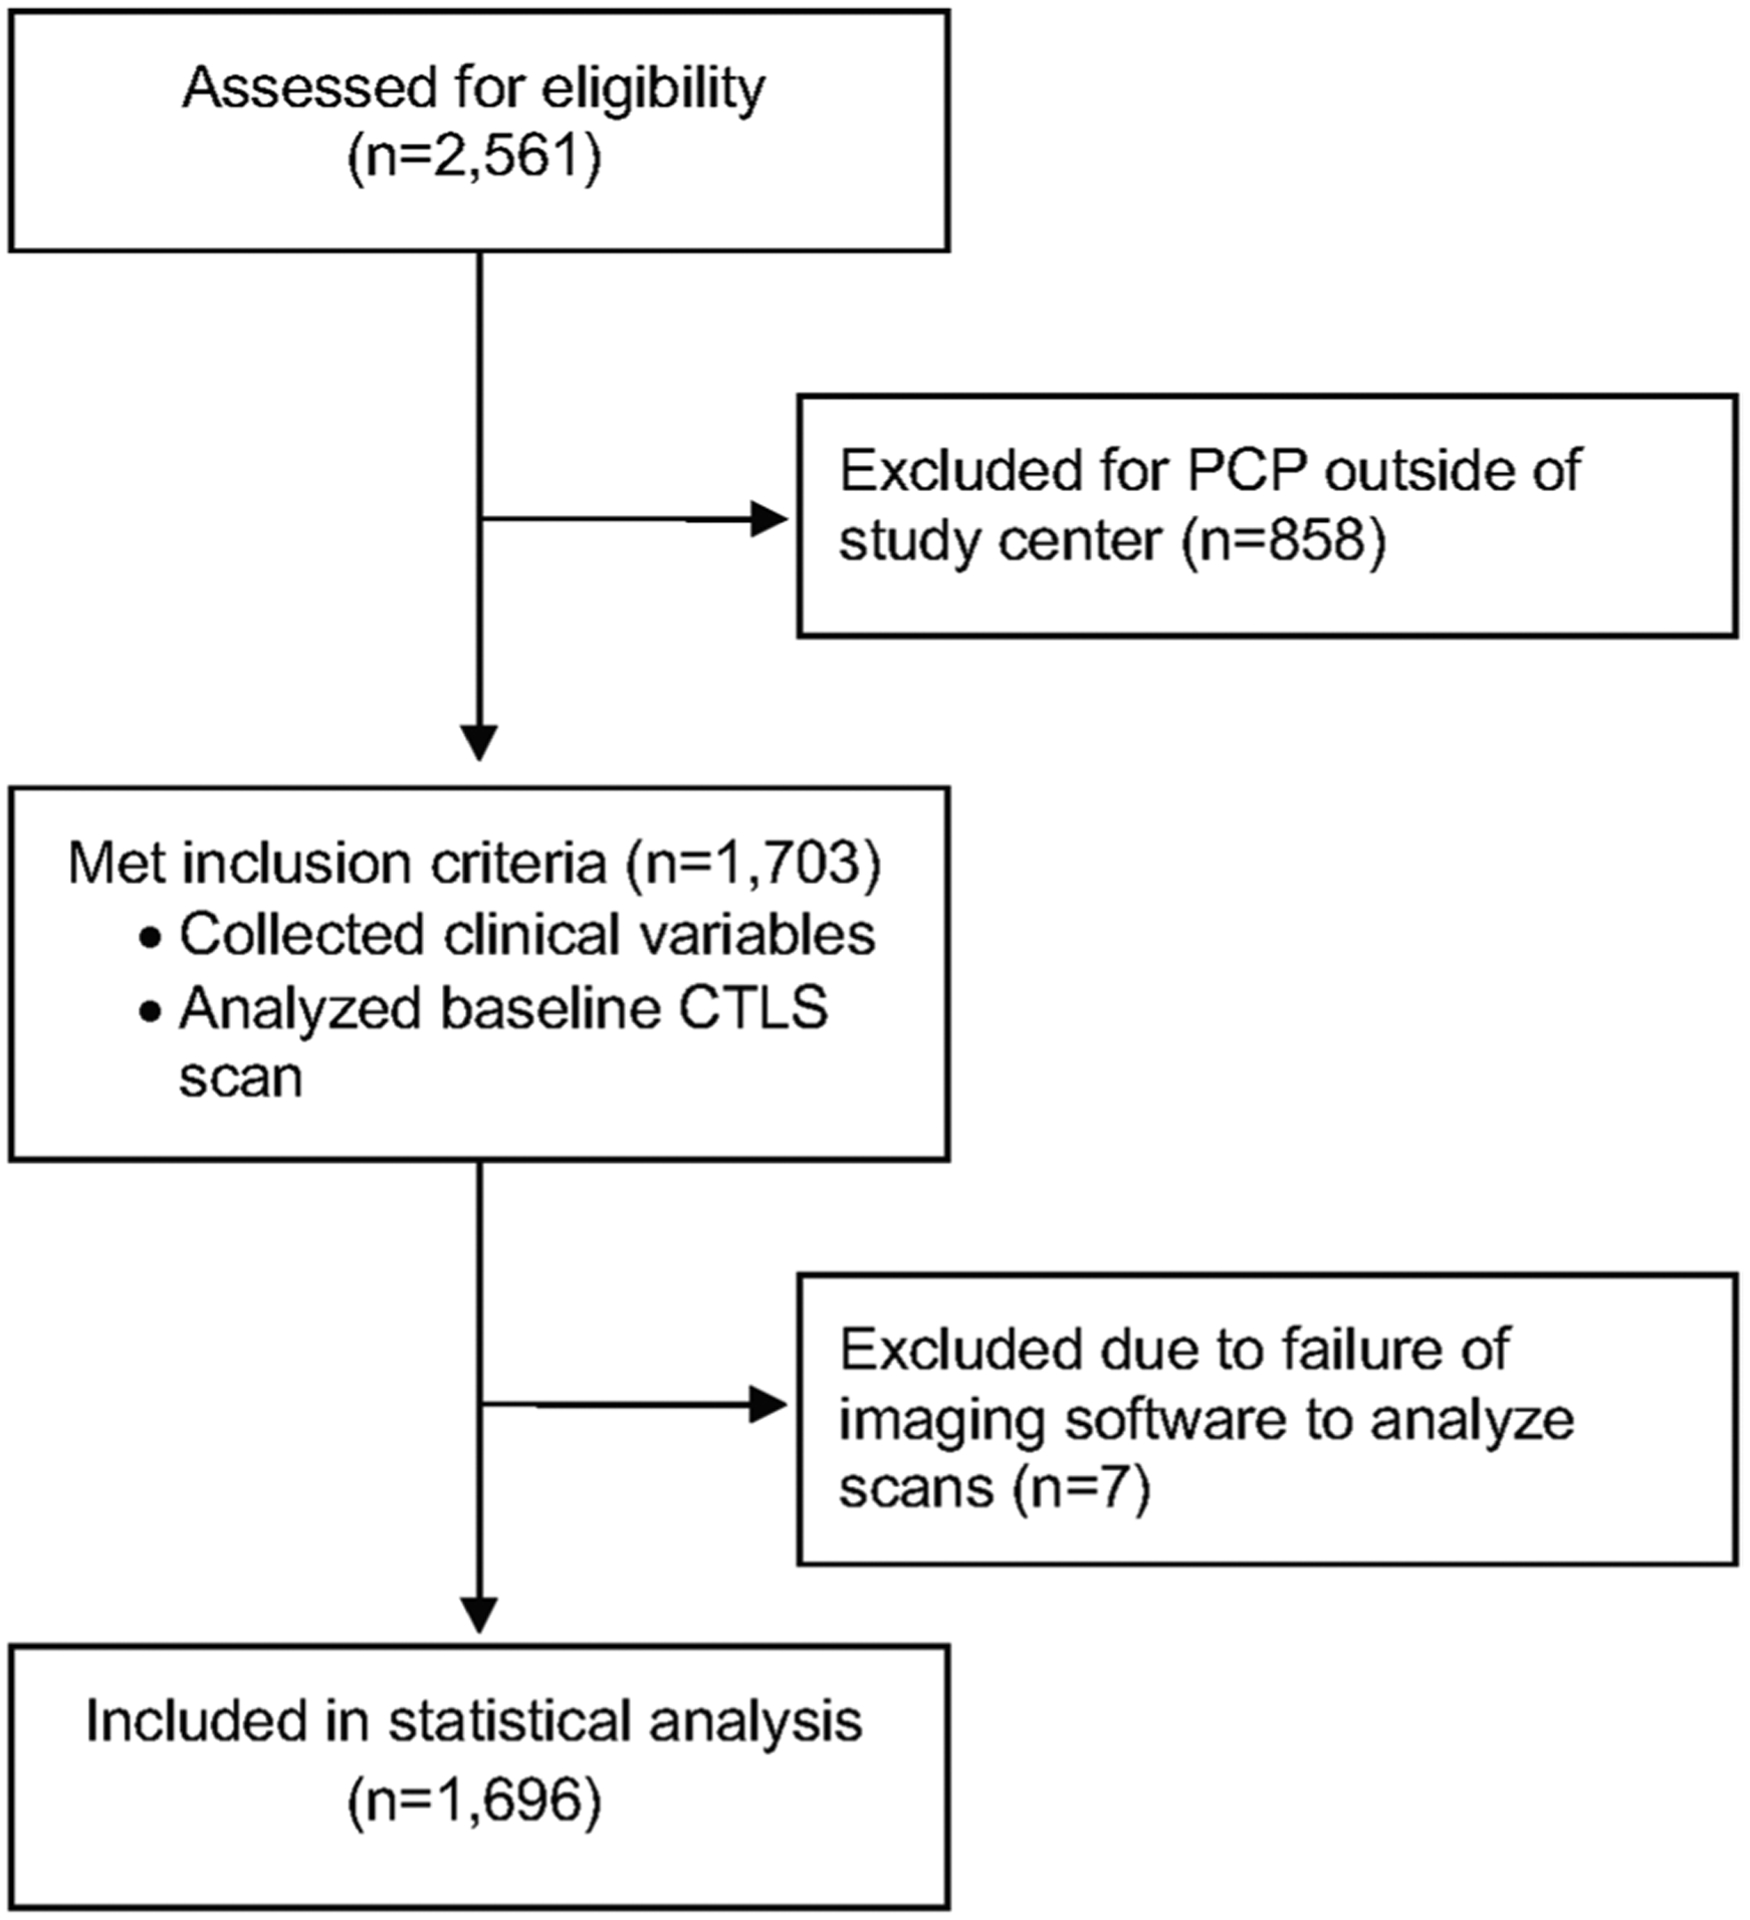
A total of 2561 patients were screened between January 1st, 2012 and September 30th, 2014. We excluded 858 (33.5%) patients because their primary care physician was out of our network. Of the 1703 patients who met the inclusion criteria and underwent CTLS, a total of seven patients were excluded secondary to failure of the Chest Imaging Platform program to analyze the images (Fig. 2).
Fig. 2.

Consort diagram
Of the remaining 1696 participants, the mean age was 62.6 ± 6.2 years, 952 (56.1%) were male, 1665 (98.2%) were white, and 775 (54.3%) of the study participants were former smokers with an average of 11.1 ± 9.3 years quit. Based on the NCCN® guidelines, 1259 (74.2%) participants were categorized as NCCN Group 1 and the remaining 437 (25.8%) individuals were classified as NCCN Group 2. A total of 79 (4.7%) patients developed lung cancer over the study period. Positive exams (Lung-RADS® 3 and 4) occurred in 192 (11.7%) patients (Table 1).
Table 1.
Demographics of CTLS cohort
| N = 1696 | |
|---|---|
| Age | 62.6 ± 6.2 |
| Sex | |
| Male | 952 (56.1%) |
| Female | 744 (43.9%) |
| Race | |
| White | 1665 (98.2%) |
| Other | 31 (1.8%) |
| BMI | 29.2 ± 5.9 |
| Smoking | |
| Current | 921 (54.3%) |
| Former | 775 (45.7%) |
| Pack years | 48.4 ± 22.9 |
| Years quit | 11.1 ± 9.3 |
| Years follow-up | 4.01 ± 1.13 |
| Emphysema | |
| Yes | 982 (57.9%) |
| No | 714 (42.1%) |
| Coronary artery calcifications | |
| Yes | 1322 (77.9%) |
| No | 374 (22.1%) |
| Baseline Lung-RADS® | |
| 0 | 1 (0.06%) |
| 1 | 385 (22.7%) |
| 2 | 1118 (65.9%) |
| 3 | 130 (7.7%) |
| 4 | 62 (3.7%) |
| NCCN screening group | |
| 1 | 1259 (74.2%) |
| 2 | 437 (25.8%) |
178 (10.5%) patients had less than 3 years of follow-up over the course of the study period. Of these 178 patients, 48 died (27.0%), 35 moved (19.7%), 2 were foreign visitors (1.1%), and 93 (52.3%) were lost to follow-up before three years for unknown reasons.
Body Composition and Sex
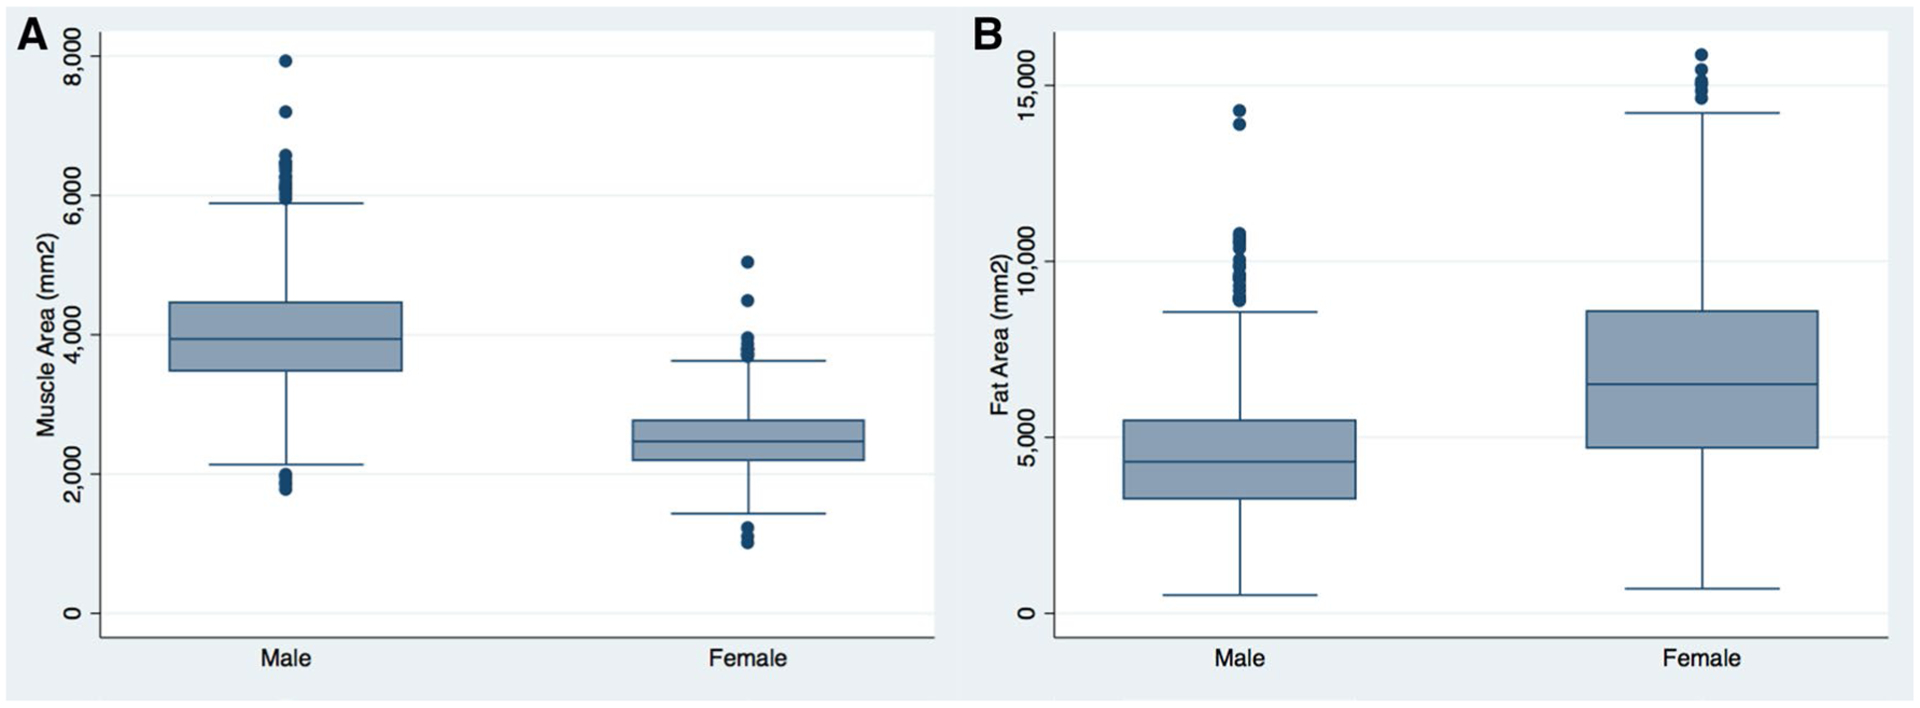
On average, male participants presented with significantly greater PMA than females at 4971.8 mm2 compared to 2989.3 mm2 (p < 0.001), while female SFA was significantly greater than that of male subjects, averaging 3667.7 versus 2470.0 mm2 (p < 0.001); Fig. 3. PMA was dichotomized above/below the median separately for each sex and combined to account for baseline differences between sexes.
Fig. 3.

Sex differences in body composition, a pectoralis muscle area, and b subcutaneous fat area
Body Composition and Cancer Outcome
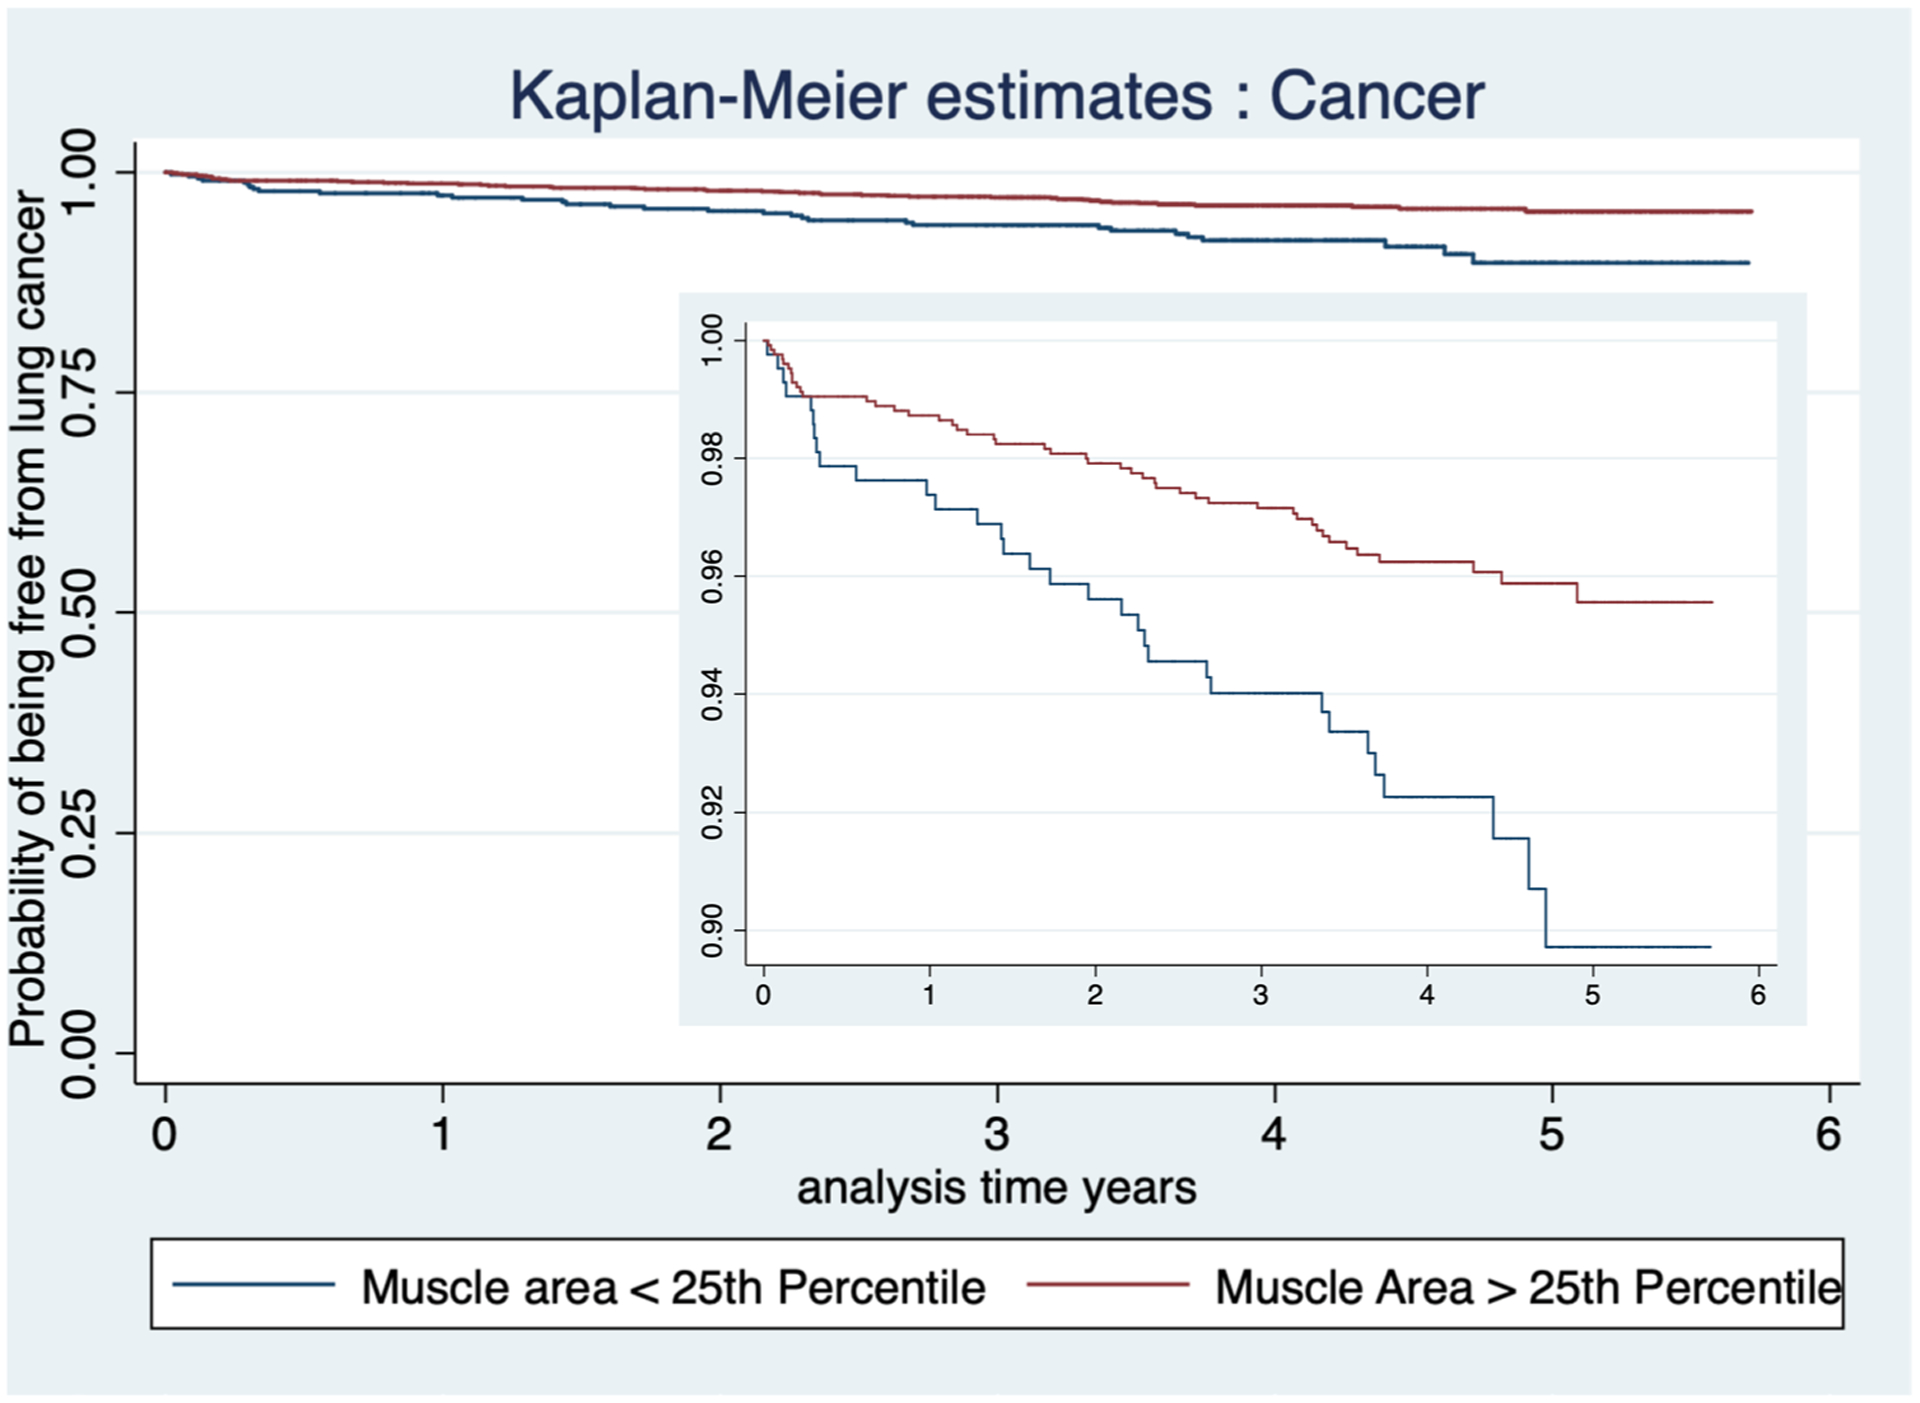
An elevated BMI was found to be associated with reduced hazard of developing lung cancer (HR 0.94; 95% CI 0.90–0.98, p = 0.004), as shown in Table 2. BMI remained significant after adjusting for age, Lung-RADS® score, qualitative coronary calcium, and qualitative emphysema, (HR 0.95; 95% CI 0.91–0.99, p = 0.018). After accounting for differences by sex, body composition was divided into three variables (SFA/PMA, SFA, and PMA). Univariate Cox regression model results are reported in Table 2. A multivariable Cox regression model was used to evaluate the relationship between these variables and the development of lung cancer. PMA was the only body composition variable that showed statistical significance, as shown in Table 2. Patients that fell below the 50th percentile of PMA demonstrated a statistically significant increased risk of lung cancer after adjusting for age, BMI, qualitative emphysema, and CAC (HR 1.64, 95% CI 1.01–2.66, p = 0.044). After adjusting for age, BMI, qualitative emphysema, CAC, and positive exam (Lung-RADS® score 3 and 4), the relationship between PMA and cancer outcome remained significant only in patients who fell below the 25th percentile of PMA (HR 1.71, 95% CI 1.07–2.75, p = 0.025) compared to patients in the higher quartiles combined (reference group), as shown in Table 2. Figure 4 shows the Kaplan–Meier survival plot for PMA below the 25th percentile (p = 0.002).
Table 2.
Cox univariate and multivariate analysis and cancer
| Univariate | HR (95% CI) | p value |
|---|---|---|
| Age | 1.04 (0.99, 1.07) | 0.055 |
| Sex (female) | 0.86 (0.55, 1.34) | 0.500 |
| White | 1.04 (0.98, 1.09) | 0.704 |
| BMI | 0.94 (0.90, 0.98) | 0.004 |
| Current smoker | 0.98 (0.63, 1.52) | 0.915 |
| Pack years | 1.00 (0.99, 1.01) | 0.319 |
| Years quit | 0.99 (0.96, 1.03) | 0.852 |
| NCCN group 2 | 1.13 (0.69, 1.85) | 0.617 |
| Positive exam (Lung-RADS® score 3 and 4) | 11.87 (7.61, 18.51) | 0.000 |
| Coronary artery calcifications (yes) | 1.59 (0.86, 2.94) | 0.139 |
| Emphysema (yes) | 2.17 (1.30, 3.60) | 0.003 |
| Body composition: univariate analysis | ||
| Ratio fat: muscle (above 50th percentile) | 1.24 (0.80, 1.94) | 0.335 |
| Subcutaneous fat area (above 50th percentile) | 2.06 (1.29, 3.29) | 0.003 |
| Pectoralis muscle area (below 50th percentile) | 2.03 (1.28, 3.24) | 0.003 |
| Body composition: multivariable analysis | ||
| Pectoralis muscle area (below 50th percentile)a | 1.64 (1.01, 2.66) | 0.044 |
| Subcutaneous fat area (above 50th percentile)a | 1.53 (0.85, 2.75) | 0.180 |
| Pectoralis muscle area (below 25th percentile)a | 1.71 (1.07, 2.75) | 0.025 |
Each individual row represents multivariable models adjusted for age, BMI, coronary artery calcification, and emphysema
Fig. 4.

Kaplan–Meier survival plot for PMA
Discussion
Our results confirm the previously reported relationship between BMI and the reduced risk of developing lung cancer [1–11, 13]. We found that patients who fell below the 50th percentile for PMA were at an increased risk for the development of lung cancer and SFA and SFA/PMA ratio failed to show significance. Our results suggest that the long-established relationship between a lower BMI and lung cancer risk is related to a decline in muscle mass.
When the data was adjusted for positive exam result (Lung-RADS® 3 and 4) in addition to age, BMI, smoking status, pack year exposure, existing emphysema, and CAC, the association between PMA and lung cancer risk remained significant only in patients below the 25th percentile of PMA. This finding supports the conclusion that lower PMA is associated with an increased risk of lung cancer, such that the highest-risk patients (those with positive exam results) who developed lung cancer had a lower PMA.
Cachexia, or muscle wasting, may be responsible for the lower PMA in the patients who go on or have already developed lung cancer. This is supported by the work of Digumarthy et al. who demonstrated that lower PMA at the time of diagnosis of non-small cell lung cancer was associated with poorer overall survival, which they attributed specifically to cancer-related cachexia [17].
Cachexia is a multifactorial syndrome characterized by an ongoing loss of skeletal muscle mass, with or without loss of fat mass, that leads to progressive functional impairment [18]. Cachexia is a well-established adverse effect of cancer and has been associated with lower physical functioning, reduced tolerance to anticancer treatment, and poorer overall survival [19–22]. These relationships are also found when looking specifically at lung cancer and support the importance of early detection of muscle wasting within the context of malignant disease [17, 18, 23, 24]. Muscle cachexia has been detected using CT imaging in patients with cancer independent of BMI [25]. This strengthens the concept that cachexia can present within the context of obesity and may be able to be identified using imaging technology, rather than physical appearance and measurements, to accurately assess a patient’s muscle composition.
Our data suggest that there is the potential to incorporate quantitative assessments of muscle area in future lung cancer risk models. Our study was conducted within a single institution with a homogenous white CTLS cohort which may limit its generalizability. Additionally, a single image was used to measure muscle and fat area which is not as accurate as volumetric measurements. Volumetric measurements could not be performed due to limitations of software, computational capacity, and time. Although arm position over the head is part of our standard scanning protocol, variability in positioning of subject’s arms could also introduce some variance in our measurements.
Our results suggest that the observed inverse association between BMI and lung cancer is related to muscle loss in patients who go on to develop lung cancer.
Further study is needed to determine if quantitative CT muscle area measurements both at baseline and through longitudinal assessments over time can be incorporated into future lung cancer risk models to more accurately stratify patients’ risk of developing lung cancer.
Acknowledgements
The authors would like to thank Adam Medina, John Lemmerman, Dr. Avi Patel, MD, Dr. Michael Cundiff, MD, and Brittney Wilson, PA for their assistance with the data collection for this manuscript.
Funding
Lee Gazourian, MD was supported by a grant from the Robert E. Wise Institute at Lahey Hospital and Medical Center, as well as an institutional 2018 Physician Research Stipend and Clinical and Translational Science Institute (CTSI) support. The project described was supported by the National Center for Advancing Translational Sciences, National Institutes of Health, Award Number UL1TR002544. The content is solely the responsibility of the authors and does not necessarily represent the official views of the NIH. Raul San José Estépar and development of the Chest Imaging Platform was supported by NHLBI award R01HL116931. Giulia S. Rizzo was supported by the 2016 Tufts University School of Medicine Summer Research Fellowship. Cristina F. Stefanescu was supported by the 2016 Tufts University School of Medicine Summer Research Fellowship. Ava M. Sanayei was supported by the 2017 Harold Williams Summer Research Fellowship. William P. Long was supported by the 2017 The Aid for Cancer Research Fellowship. William B. Thedinger was supported by the 2017 Tufts University Post Bac Research Fellowship and 2018 and 2019 Rescue Lung, Rescue Life Summer Fellowship.
Footnotes
Conflict of interest The authors have no conflicts of interest to declare.
References
- 1.Nuttall FQ (2015) Body mass index: obesity, BMI, and health. Nutr Today 50(3):117–128. 10.1097/NT.0000000000000092 [DOI] [PMC free article] [PubMed] [Google Scholar]
- 2.Bethea TN, Rosenberg L, Charlot M, O’Connor GT, Adams-Campbell LL, Palmer JR (2013) Obesity in relation to lung cancer incidence in African American women. Cancer Causes Control 24(9):1695–1703. 10.1007/s10552-013-0245-6 [DOI] [PMC free article] [PubMed] [Google Scholar]
- 3.El-Zein M, Parent M-E, Nicolau B, Koushik A, Siemiatycki J, Rousseau M-C (2013) Body mass index, lifetime smoking intensity and lung cancer risk. Int J Cancer 133(7):1721–1731. 10.1002/ijc.28185 [DOI] [PubMed] [Google Scholar]
- 4.Faeh D, Kaufmann M, Haile SR, Bopp M (2018) BMI–mortality association: shape independent of smoking status but different for chronic lung disease and lung cancer. Int J Chron Obstruct Pulmon Dis 13:1851–1855. 10.2147/COPD.S157629 [DOI] [PMC free article] [PubMed] [Google Scholar]
- 5.Gao J, Lin X, He Y et al. (2019) The comparison of different obesity indexes and the risk of lung cancer: a meta-analysis of prospective cohort studies. Nutr Cancer 71(6):908–921. 10.1080/01635581.2019.1595037 [DOI] [PubMed] [Google Scholar]
- 6.Kabat GC, Kim M, Hunt JR, Chlebowski RT, Rohan TE (2008) Body mass index and waist circumference in relation to lung cancer risk in the women’s health initiative. Am J Epidemiol 168(2):158–169. 10.1093/aje/kwn109 [DOI] [PMC free article] [PubMed] [Google Scholar]
- 7.Knekt P, Heliövaara M, Rissanen A et al. (1991) Leanness and lung-cancer risk. Int J Cancer 49(2):208–213. 10.1002/ijc.2910490211 [DOI] [PubMed] [Google Scholar]
- 8.Sanikini H, Yuan J-M, Butler LM et al. (2018) Body mass index and lung cancer risk: a pooled analysis based on nested case-control studies from four cohort studies. BMC Cancer 18(1):220. 10.1186/s12885-018-4124-0 [DOI] [PMC free article] [PubMed] [Google Scholar]
- 9.Smith L, Brinton LA, Spitz MR et al. (2012) Body mass index and risk of lung cancer among never, former, and current smokers. JNCI J Natl Cancer Inst 104(10):778–789. 10.1093/jnci/djs179 [DOI] [PMC free article] [PubMed] [Google Scholar]
- 10.Yang Y, Dong J, Sun K et al. (2013) Obesity and incidence of lung cancer: a meta-analysis. Int J Cancer 132(5):1162–1169. 10.1002/ijc.27719 [DOI] [PubMed] [Google Scholar]
- 11.Duan P, Hu C, Quan C et al. (2015) Body mass index and risk of lung cancer: systematic review and dose-response meta-analysis. Sci Rep. 10.1038/srep16938 [DOI] [PMC free article] [PubMed] [Google Scholar]
- 12.Lee I-M, Manson JE (1998) Body weight and mortality: what is the shape of the curve? Epidemiology 9(3):227–228 [DOI] [PubMed] [Google Scholar]
- 13.Nattenmüller J, Wochner R, Muley T et al. (2017) Prognostic impact of CT-quantified muscle and fat distribution before and after first-line-chemotherapy in lung cancer patients. PLoS ONE. 10.1371/journal.pone.0169136 [DOI] [PMC free article] [PubMed] [Google Scholar]
- 14.Wood DE, Eapen GA, Ettinger DS et al. (2012) Lung cancer screening. J Natl Compr Canc Netw 10(2):240–265. 10.6004/jnccn.2012.0022 [DOI] [PMC free article] [PubMed] [Google Scholar]
- 15.Lung-RADS® Version 1.1. 2019. https://www.acr.org/-/media/ACR/Files/RADS/Lung-RADS/LungRADSAssessmentCategoriesv1-1.pdf?la=en. Accessed 2 July 2019.
- 16.San Jose Estepar R, Ross JC, Harmouche R, Onieva J, Diaz AA, Washko GR (2015) C66 lung imaging II: new probes and emerging technologies: chest imaging platform: an open-source library and workstation for quantitative chest imaging. Am J Respir Crit Care Med 191:1–2 [Google Scholar]
- 17.Digumarthy SR, De Man R, Canellas R, Otrakji A, Wang G, Kalra MK (2018) Multifactorial analysis of mortality in screening detected lung cancer. J Oncol 2018:1–7. 10.1155/2018/1296246 [DOI] [PMC free article] [PubMed] [Google Scholar]
- 18.Fearon K, Strasser F, Anker SD et al. (2011) Definition and classification of cancer cachexia: an international consensus. Lancet Oncol 12(5):489–495. 10.1016/S1470-2045(10)70218-7 [DOI] [PubMed] [Google Scholar]
- 19.Baracos VE, Reiman T, Mourtzakis M, Gioulbasanis I, Antoun S (1137S) Body composition in patients with non-small cell lung cancer: a contemporary view of cancer cachexia with the use of computed tomography image analysis. Am J Clin Nutr 91(4):1133S–1137S. 10.3945/ajcn.2010.28608C [DOI] [PubMed] [Google Scholar]
- 20.Dewys WD, Begg C, Lavin PT et al. (1980) Prognostic effect of weight loss prior tochemotherapy in cancer patients. Am J Med 69(4):491–497. 10.1016/S0149-2918(05)80001-3 [DOI] [PubMed] [Google Scholar]
- 21.Lawson DH, Richmond A, Nixon DW, Rudman D (1982) Metabolic approaches to cancer cachexia. Annu Rev Nutr 2(1):277–301. 10.1146/annurev.nu.02.070182.001425 [DOI] [PubMed] [Google Scholar]
- 22.De Graaff AA, D’Hooghe TM, Dunselman GAJ et al. (2013) The significant effect of endometriosis on physical, mental and social wellbeing: results from an international cross-sectional survey. Hum Reprod 28(10):2677–2685. 10.1093/humrep/det284 [DOI] [PubMed] [Google Scholar]
- 23.Kimura M, Naito T, Kenmotsu H et al. (2015) Prognostic impact of cancer cachexia in patients with advanced non-small cell lung cancer. Support Care Cancer 23(6):1699–1708. 10.1007/s00520-014-2534-3 [DOI] [PubMed] [Google Scholar]
- 24.Ross PJ, Ashley S, Norton A et al. (2004) Do patients with weight loss have a worse outcome when undergoing chemotherapy for lung cancers? Br J Cancer 90(10):1905–1911. 10.1038/sj.bjc.6601781 [DOI] [PMC free article] [PubMed] [Google Scholar]
- 25.Martin L, Birdsell L, MacDonald N et al. (2013) Cancer cachexia in the age of obesity: skeletal muscle depletion is a powerful prognostic factor, independent of body mass index. J Clin Oncol 31(12):1539–1547 [DOI] [PubMed] [Google Scholar]


