Abstract
Background
Hepatocellular carcinoma (HCC) is the main histological subtype of liver cancer, which has the characteristics of poor prognosis and high fatality rate. Single-cell sequencing can provide quantitative and unbiased characterization of cell heterogeneity by analyzing the molecular profile of the whole genome of thousands of single cells. Thus, the purpose of this study was to identify novel prognostic markers for HCC based on single-cell sequencing data.
Methods
Single-cell sequencing of 21 HCC samples and 256 normal liver tissue samples in the GSE124395 dataset was collected from the Gene Expression Omnibus (GEO) database. The quality-controlled cells were grouped by unsupervised cluster analysis and identified the marker genes of each cell cluster. Hereafter, these cell clusters were annotated by singleR and CellMarker according to the expression patterns of the marker genes. Pseudotime analysis was performed to construct the trajectory of cell evolution and to define hub genes in the evolution process. Gene Ontology (GO) and Kyoto Encyclopedia of Genes and Genomes (KEGG) enrichment analyses were used to explore the potential regulatory mechanism of hub genes in HCC. Next, the differential expression of hub genes and the correlation of the expression of these genes with patients’ survival and diagnosis were investigated in The Cancer Genome Atlas (TCGA) database.
Results
A total of 9 clusters corresponding to 9 cell types, including NKT cells, hepatocytes, endothelial cells, Kupffer cells, EPCAM+ cells, cancer cells, plasma cells (B cells), immature B cells, and myofibroblasts were identified. We screened 63 key genes related to cell differentiation through trajectory analysis, which were enriched in the process of coagulation. Ultimately, we identified 10 survival-related hub genes in the TCGA database, namely ALDOB, APOC3, APOH, CYP2E1, CYP3A4, GC, HRG, LINC01554, PDK4, and TXN.
Conclusion
In conclusion, ALDOB, APOC3, APOH, CYP2E1, CYP3A4, GC, HRG, LINC01554, PDK4, and TXN may serve as hub genes in the diagnosis and prognosis for HCC.
Keywords: hepatocellular carcinoma, HCC, single-cell sequencing, hub genes, prognostic, diagnostic
Introduction
HCC, the main histological subtype of liver cancer and a common malignancy, is the second most common cause of cancer-related deaths worldwide, whose incidence and mortality are increasing worldwide.1,2 As the early symptoms of HCC are not obvious, most patients are diagnosed at an advanced stage and therefore their prognosis is poor, and death usually ensues within a few months.1 In recent years, the treatment modalities for HCC have been changing rapidly. Among them, targeted therapies, which can specifically kill tumor cells and protect as much normal tissue as possible, have made great progress, which undoubtedly brings new hope for the treatment of patients with advanced HCC. Although targeted drugs have good molecular selectivity, the selection of molecules has been a difficult task in tumor-targeted therapy. Therefore, an urgent need exists to identify the key genetic targets for HCC to research and develop new therapeutic agents.
At present, the analysis of tumor cells and the microenvironment around tumor cells is mostly based on the general analysis of large tumor samples, which will lead to some key information that may be masked. Single-cell sequencing technology is a new technology for high-throughput sequencing analysis of genome,3 transcriptome and epigenome at the single-cell level. Compared with the traditional sequencing method, single-cell sequencing can observe the unique characteristics of a single cell, and further insight into the biological characteristics of the tumor.4 Single-cell sequencing can find various gene variations, tumor heterogeneity and drug resistance5 that lead to the occurrence and evolution of malignant tumors, which is of great significance for the early diagnosis and individualized treatment of hepatocellular carcinoma.
In this study, we use the data set (GSE124395) downloaded from the GEO database. Firstly, we sort out the data, including filtering out low-quality cells, data standardization, cell clustering and determining the name of each cluster. Then we analyzed the differences between normal samples and tumor samples, compared the chromosome expression patterns of genes, observed the interaction between different liver cells,6 and analyzed the key nodes of liver cells transforming into liver cancer cells by pseudo time series.7 We also analyzed the differences and survival of these node genes through TCGA database8 and analyzed the differences and survival of these node genes through GO annotation and KEGG database were used for pathway enrichment analysis to further summarize the function of DEGs.9 The PPI network was constructed. Finally, The AUC of ROC10 was used to evaluate the diagnostic usefulness of 10 survival-related hub genes.
Materials and Methods
Data Collection
The GSE124395 dataset, including the single-cell RNA-sequencing data of 21 HCC samples and 256 normal liver tissue samples, was download from the publicly available GEOdatabase (https://www.ncbi.nlm.nih.gov/geo/query/acc.cgi/GSE124395). Moreover, we collected the transcriptome data and corresponding survival information of patients with HCC and normal tissues from the TCGA database. We excluded samples with unavailable clinical information for further analysis. Furthermore, we also obtained the GSE54236 dataset (https://www.ncbi.nlm.nih.gov/geo/query/acc.cgi?acc=GSE54236) from the GEO database, which included genome-wide microarray expression profiles of 81 HCC tumor samples and 80 paracancerous tissue samples. The rank sum test was applied to compare the expression differences of the final identified 10 hub genes between the two groups, and P < 0.05 was significant.
Processing of the Data
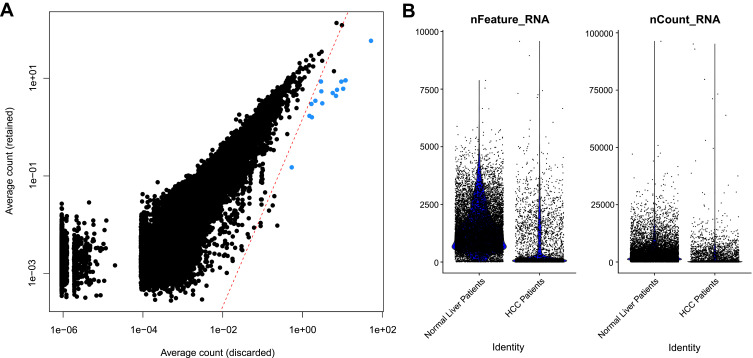
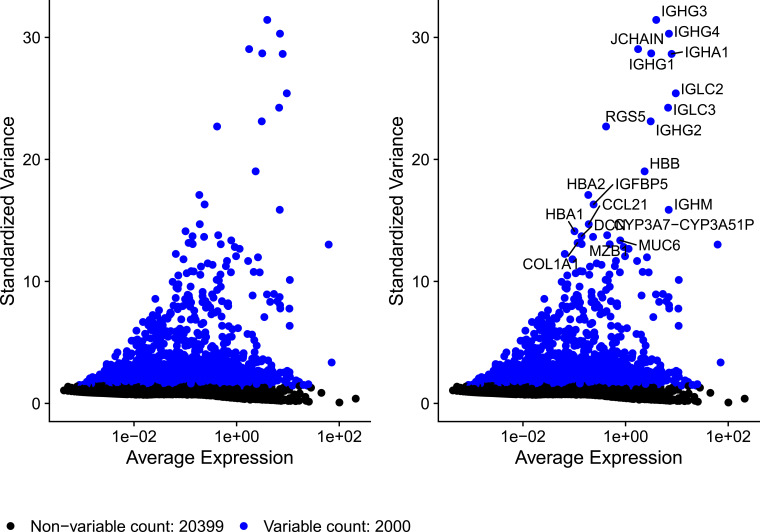
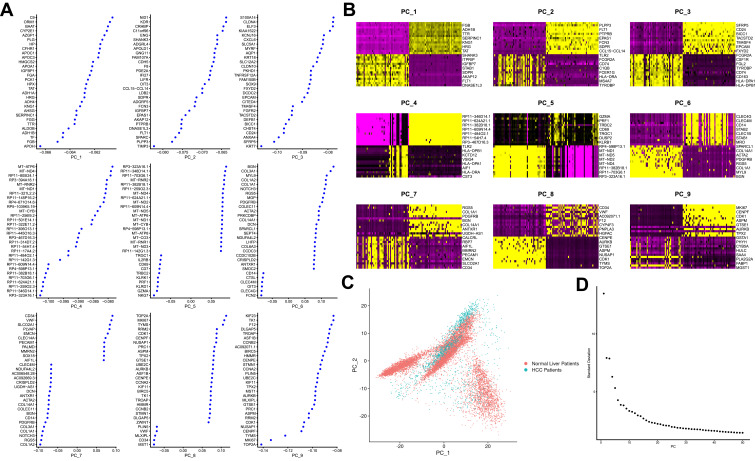
In this study, the “Seurat” package was used for data processing. According to the quality control standards (min.cells = 10, min.features = 1, 1000 < library size < median + 3 median absolute deviation (MAD), and median - 3 MAD < number of genes < median + 3 MAD), 5076 low-quality cells were filtered out from the 16,654 cells in the normal liver tissue (cell number = 12,622) and HCC samples (cell number = 4032). Ultimately, a total of 11,578 cells were selected for subsequent analysis (Figure 1A and B). To reduce the amount of calculation, we extracted the first 2000 genes with a large coefficient of variation between cells using “vst” (Figure 2 and Supplementary Table 1). Next, we identified available dimensions and screened correlated genes by principal component analysis (PCA). The top 9 significantly correlated genes were displayed in Figure 3A and B. We also found that there were no clear separations between HCC and normal cells and the first 30 principal components (PCs) were selected for cluster analysis (Figure 3C and D).
Figure 1.
11578 cells were selected for subsequent analysis. (A) The average count of discarded and retained cells. (B) Distribution of library size, gene counts.
Figure 2.
Visualize high variable genes.
Figure 3.
The top 9 significantly correlated genes. (A) The related genes of each PCA in the top 9 PCAs. (B) PCA related gene heat map (Top9 dimensions). (C) Two-dimensional map of PCA cell distribution. (D) Examine and visualize PCA results with Elbow Plot.
Data Clustering, Marker Gene, and Cell-Type Identification
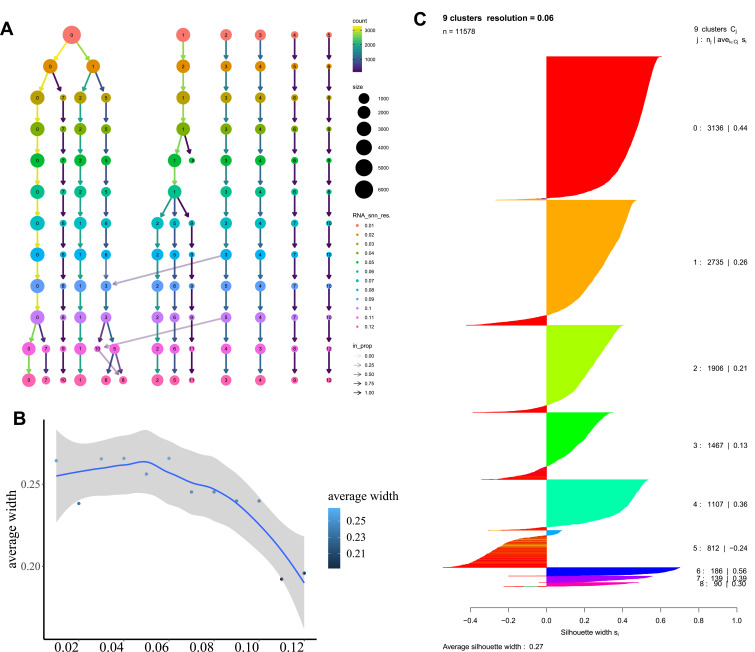
The “FindNeighbors” and “FindClusters” functions in the “seurat” package were used to execute unsupervised cluster analysis for 11,578 cells. When resolution = 0.06 and silhouette coefficient = 0.29, we had determined the best clustering effect (K = 9) (Figure 4A–C). To determine marker genes of these 9 clusters, the Seurat FindAllMarkers function (parameter: min.pct = 0.2, only.pos = TRUE) was used to contrasted cells from one cluster to all other cells. After that, different cell clusters were annotated by the “singleR” package and “CellMarker” database in light of the composition patterns of the marker genes.
Figure 4.
Data clustering, marker gene, and cell-type identification. (A) Sankey diagram at different resolutions. (B) Scatter diagram of contour map at different resolutions. (C) Contour diagram at 0.06 resolution.
Copy Number Inference from Sequencing Data
The “inferCNV” of R package was used to analyze large-scale chromosome copy number alterations based on the single-cell sequencing data, such as the increase or loss of entire chromosomes or large fragments of chromosomes. In the study, we compared the hepatocytes cells chromosomal gene expression pattern with the cancer cell or remaining 8 cell clusters.
Cell-Cell Communication Analysis
To analyze cell-cell communication, we used the celltalker method to deduce the ligand-receptor interaction among different cell clusters. The range of potential ligands and receptors was narrowed to two sample groups by differential gene expression analysis. Filtering ligand-receptor pairs by setting cells.reqd=10 and freq.pos.reqd=0.5. To further determine the most relevant interactions between each cell type, we considered only the ligand-receptor complexes expressed in more than 5% of cells.
Pseudotime Analysis
To research the differentiation trajectory of hepatocytes, “Monocle” was used to perform pseudo-chronological analysis on liver cancer cells and normal cells data. We identified the differentially expressed genes (DEGs) between HCC and normal samples, arranged the cells in pseudo-time along the trajectory, drew heatmaps according to the genes of each branch of the trajectory, and divided them into 3 clusters according to gene expression patterns.
Functional Enrichment Analysis
DEGs between normal and HCC samples were selected using the “limma” package of R with the screening requirement of P ≤ 0.05 and |Log2 fold change (FC)| ≥ 1. The “ClusterProfiler” package in R software was utilized to analyze GO terms and KEGG pathways. P-value < 0.05 was considered significant.
Statistical Analysis
The protein-protein interaction (PPI) network of 63 hub genes was established by STRING online database and was visualized by Cytoscape. The Kaplan-Meier curve was used for the survival analysis of 36 differentially expressed hub genes, and the difference between survival curves of the two groups was tested by a Log rank test. AUC of ROC was used to assess the diagnostic utility of the 10 survival-related hub genes. Wilcox test was applied for comparisons in two groups. In all analyses, P < 0.05 was considered statistically significant.
Results
Identification of 9 Cell Clusters in the GSE124395 Dataset
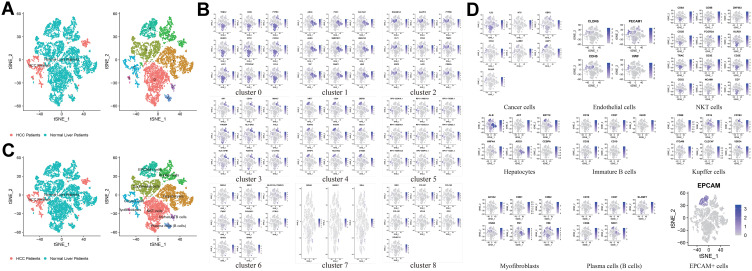
A total of 9 distinct cell clusters were identified among 11,578 cells through unsupervised cluster analysis11 and visualized by the t-SNE algorithm. It was surprising that the cells in cluster 5 were all derived from the HCC patients (Figure 5A). Subsequently, we identified the marker genes of 9 cell clusters through differential expression analysis, respectively (Figure 5B). Given the above, we speculated that the marker genes in cluster 5 (RP3-323A16.1, RP11-346D14.1, RP11-703G6.1, RP11-382B18.1, RP11-624A21.1, RP11-259O2.3, RP11-609N14.4, RP4-598P13.1, and RP11-142G1.3) may serve as biomarkers for HCC patients (Supplementary Table 2). Afterward, the existing marker genes for each cell type in the CellMarker database were taken as a reference, these cell clusters were annotated by the SingleR algorithm. Cluster 0 was annotated as NKT cells and contained 3136 cells; clusters 1 was annotated as Hepatocytes and contained 2735 cells; cluster 2 was annotated as Endothelial cells and contained 1906 cells; cluster 3 was annotated as Kupffer cells and contained 1467 cells; cluster 4 was annotated as EPCAM+ cells and contained 1107 cells; cluster 5 was annotated as Cancer cells and contained 812 cells; cluster 6 was annotated as Plasma cells (B cells) and contained 186 cells; cluster 7 was annotated as Immature B cells and contained 139 cells; cluster 8 was annotated as Myofibroblasts and contained 90 cells (Figure 5C and D).
Figure 5.
Identification of 9 cell clusters in the GSE124395 dataset. (A) Cluster map of TSNE cells (normal and patient samples), the cells in cluster 5 were all derived from the HCC patients. (B) TSNE distribution of cluster0 to cluster8 marker genes. (C) Clustering map of cells after naming (differentiating normal and patients). (D) The figure above shows the distribution of marker genes of each subgroup in each cluster in the CellMarker database.
Identification of Chromosome Gene Expression Patterns
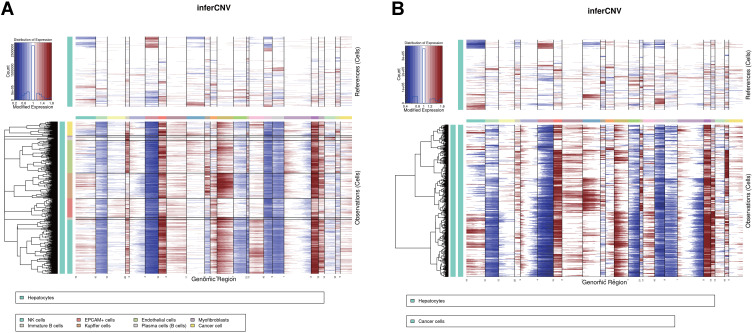
We performed the copy number variation (CNV) analysis for each cell cluster according to the expression patterns across intervals of the genome to identify the malignant cells. The Hepatocytes were determined as a reference and the remaining 8 cell clusters (NK cells, EPCAM+ cells, Endothelial cells, Myofibroblasts, Immature B cells, Kupffer cells, Plasma cells, and Cancer cell) as the observation group. The inferCNVs in the observation group showed extensive chromosomal losses in 10, 4, 16, and 9. Extensive chromosomal gains were observed in 22, 15, 6, X, and 13 (Figure 6A). Moreover, the Hepatocytes were used as a reference, the Cancer cells were used as the observation group. As shown in Figure 6B, we observed extensive chromosomal losses in 10, 4, 7, 16, and 9, while extensive chromosomal gains in 15, 6, X, 13, and 18.
Figure 6.
Identification of chromosome gene expression patterns. (A) All cluster infercnv. (B) Hepatocytes or cancercells infercnv.
Crosstalk Among Different Cell Clusters
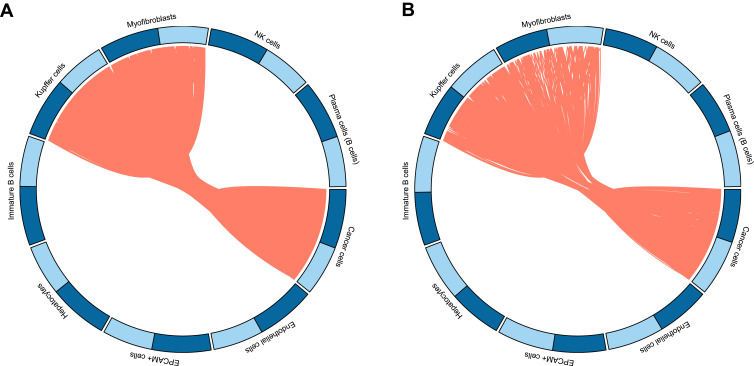
To assess the crosstalk of each cell cluster, we performed a celltalker algorithm. In total, 798 ligand-receptor pairs were selected by differential expression analysis, of which 678 ligand-receptor pairs were specifically expressed in HCC samples, and 106 ligand-receptor pairs were expressed in both HCC and normal samples. The direction and number of ligand-receptor interactions were displayed in Figure 7A and B.
Figure 7.
Crosstalk among different cell clusters. (A) Specificity was found in 678 receptor-ligand pairs in samples from HCC Patients. (B) There were 106 pairs of receptor-ligand pairs present in both HCC and normal samples.
Identification of Cell Differentiation-Associated Hub Genes
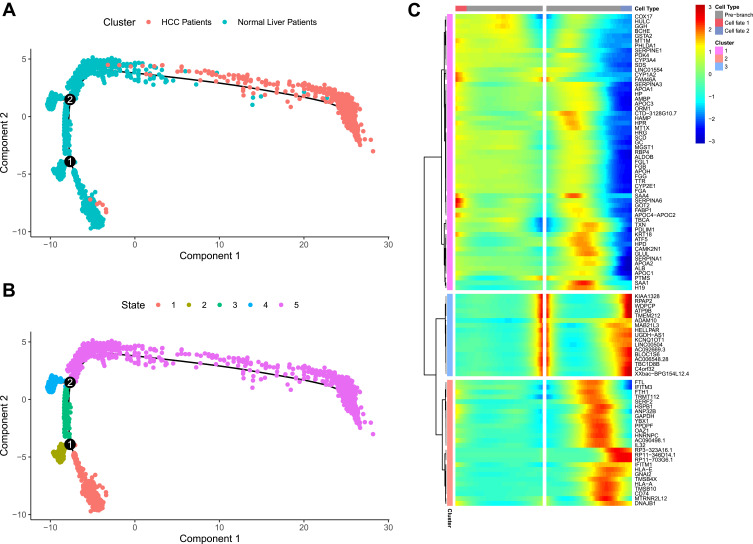
To simulate the process of normal liver tissue cells transformed into HCC tumor cells, we performed trajectory analysis on the single-cell sequencing data. After determining the DEG between liver tissue cells and HCC tumor cells, which were classified by the “Monocle2” package. The tree-like structure of the entire lineage differentiation trajectory was shown in Figure 8A. All cells were projected onto two roots and five branches, termed branches 1, 2, 3, 4, and 5 (Figure 8B). The results demonstrated that the HCC cells were mainly located in the branch 5 and a few were located in branch 1. We suggested that root 2 might be an important regulator of cancer transformation in hepatocytes, which meant that cluster 5 was represented a cluster of HCC cells, briefly, the cells in this cluster could be normal cells transforming HCC cells or hepatocytes that had undergone cancerous transformation. Subsequently, genes were divided into 3 clusters according to the expression pattern of the branched heatmap. Branched expression analysis modeling (BEAM) was used to find root-2 related “branching-dependent” genes that might determine the fate of cells differentiating from progenitor cell populations. Interestingly, we found that the gene expression of cluster 1 in cell fate2 was significantly reduced compared with cell fate1 and pre-branch, while the gene expression trend of cluster 3 was opposite (Figure 8C). Consequently, we extracted the genes (a total of 74 genes) in cluster 1 and cluster 3 that named hub genes for subsequent analysis.
Figure 8.
Identification of cell differentiation-associated hub genes. (A) The tree-like structure of the entire lineage differentiation trajectory. (B) All cells were projected onto two roots and five branches, termed branches 1, 2, 3, 4, and 5. (C) Heat map of differentiation-related genes at root 2.
Functional Enrichment Analysis of Hub Genes
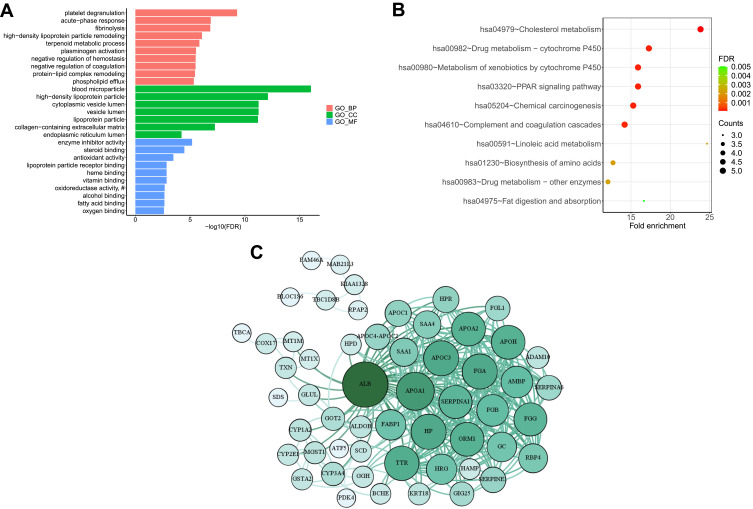
We performed GO and KEGG enrichment analyses to further elucidate the potential regulatory mechanism of hub genes in HCC. The top 10 components of BP, CC, and MF were shown in Figure 9A and Supplementary Table 3. The GO analysis results revealed that the hub genes were significantly enriched in platelet degranulation, acute-phase response, fibrinolysis in terms of BP. Regarding CC, the hub genes were enriched in blood microparticle, high-density lipoprotein particle, etc. Under MF, the hub genes were enriched in enzyme inhibitor activity, steroid binding, etc. The results of KEGG analysis revealed that the hub genes were enriched in the cholesterol metabolism, PPAR signaling pathway, and Drug metabolism-cytochrome P450 (Figure 9B and Supplementary Table 4). Furthermore, a PPI network plot displayed the interaction of the hub genes (Figure 9C).
Figure 9.
Functional enrichment analysis of hub genes. (A) Control marker_genes GO annotation visualization (Top10). (B) Control marker genes KEGG annotation visualization (Top10). (C) PPI network, the color of the dot and line represents the degree of connection of the node.
Verification of the Hub Genes in the TCGA Database
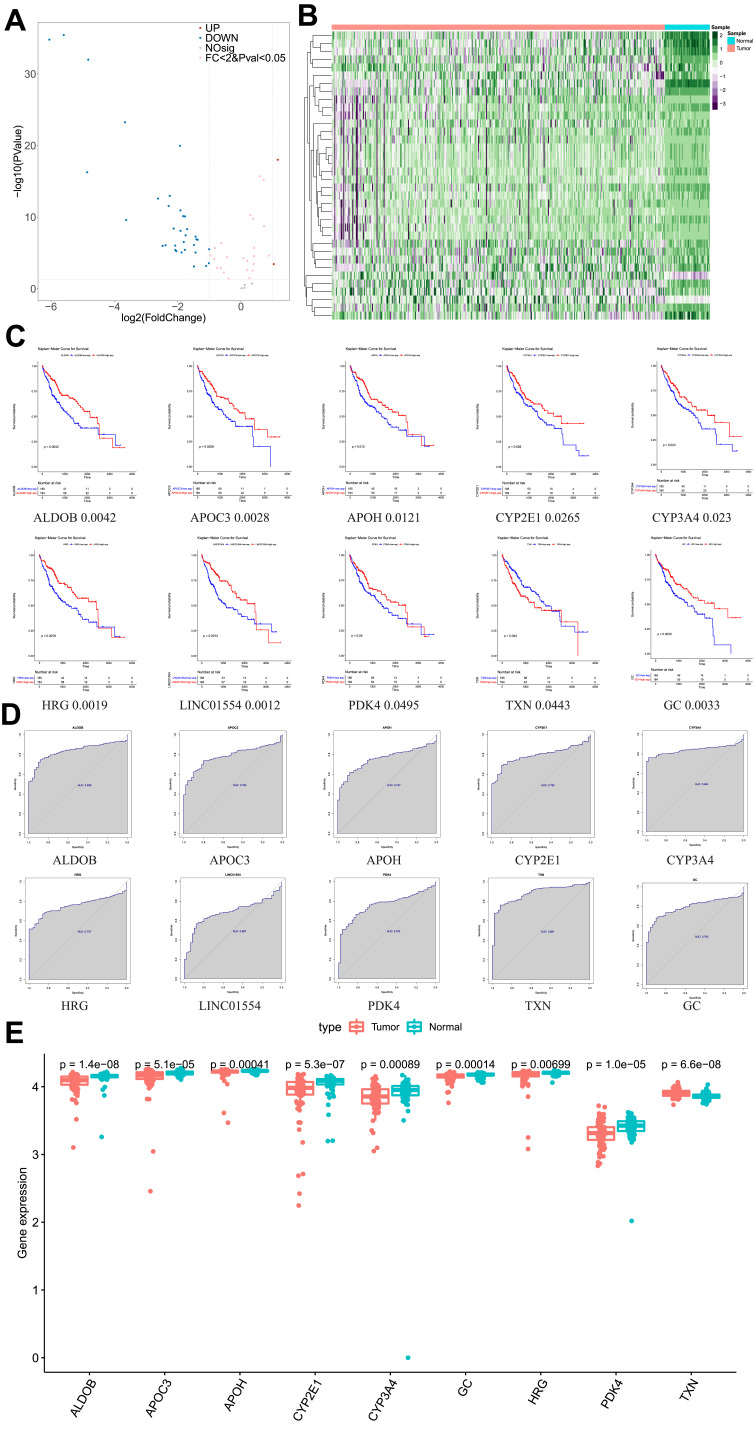
In light of the importance of hub genes in the process of cell differentiation, we evaluated their expression level based on the TCGA database. As shown in Figure 10A and B and Supplementary Table 5, a total of 36 hub genes were identified as differentially expressed between normal and HCC samples in the TCGA database, which consisted of 2 upregulated and 34 downregulated genes. Subsequently, we investigated the prognostic value of 36 hub genes in HCC using Kaplan-Meier analysis. The results demonstrated that 10 of the 36 hub genes were closely related to the survival of HCC patients (P < 0.05, Figure 10C and Supplementary Table 6). The diagnostic performance of the 10 hub genes was determined by ROC curve analysis. The AUCs of the 10 hub genes were listed in Figure 10D. Further, we validated the expression levels of the above 10 hub genes (ALDOB, APOC3, APOH, CYP2E1, CYP3A4, GC, HRG, LINC01554, PDK4, and TXN) in the GSE54236 dataset. Consistently, except for TXN, which was overexpressed in tumor tissues (n = 81), the remaining nine genes were highly expressed in normal tissues (n = 80) (Figure 10E; all P < 0.01).
Figure 10.
Verification of the hub genes in the TCGA database. (A) Differential gene volcano map. (B) Heat map visualization of differentially expressed genes. (C) Kaplan-Meier Curve for survival analysis of the hub genes. (D) ROC of the hub genes. (E) The expression levels of the above 10 hub genes in the GSE54236 dataset.
Discussion
Liver cancer is a major health problem all over the world. There are more than 850,000 cases of liver cancer every year. This tumor is currently the second leading cause of cancer-related death worldwide, with about 800,000 deaths from liver cancer each year,1,2 and the number is still rising. Based on single-cell data, we found that some genes play an important role in the development of HCC. We hope that the results and findings of this study can provide the basis and important reference for the clinical diagnosis and treatment of HCC.
After downloading the GSE124395 data set from the GEO database, we finally selected 11,578 cells for subsequent analysis after relevant data processing. To better analyze these 11,578 cells, firstly, these cells are classified into different clusters according to some pattern similarity measurement and clustering algorithm. By unsupervised cluster analysis,11 we identified 9 different cell clusters from 11,578 cells. Then, the existing marker genes of each cell type in the cell marker database are used as a reference, and the single-R algorithm12 is used to annotate these cell clusters. As can be seen from Figure 5A, all cells in cluster 5 are from patients with liver cancer. It can be inferred that the marker genes in group 5 (RP3-323A16.1, RP11-346D14.1, RP11-703G6.1, RP11-382B18.1, RP11-624A21.1, RP11-259O2.3, RP11-609N14.4, RP4-598P13.1, and RP11-142G1.3) can be used as biomarkers for patients with liver cancer.
During development, cells respond to stimuli. In the whole process of life, cells change from one functional state to another all the time. Different states of cells express different gene sets, which further leads to the dynamic changes of proteins and metabolites.13 When cells change from one state to another, they undergo transcriptome recombination, in which some genes are silenced while others are activated.14 These transient states are usually difficult to describe because it is very difficult to purify cells in different states. Single-cell RNA-Seq7 allows us to view these states without purifying cells. Pseudo timing is a measurement method, which represents the “progress” of a cell in a certain transformation process. The less progress, the closer to the original cell state, and the more progress, the closer to the terminal cell state. In this study, to observe the differentiation trajectory of Hepatocytes and simulate the process of gradual transformation of Hepatocytes into hepatocellular carcinoma cells, we extracted the differential genes between Hepatocytes and cancer cells and further analyzed the single-cell sequencing data by “Mpnocle”. It can be seen from Figure 8A and B that there are two nodes in the Pseudo timing analysis of liver cells and liver cancer cells from the two samples, which are divided into five branches, while HCC cells are mainly located in the fifth branch.Then, according to the expression pattern of the branching heat map (Figure 8C), the genes are divided into three clusters. In Cluster1, compared with Pre-Branch and Cell fate1, the gene expression of Cell fate2 is significantly reduced, while in Cluster3, on the contrary, the gene expression of Cluster2 is not so strong. Therefore, we selected different genes in Cluster1 and Cluster3 for GO and KEGG enrichment analysis, and further elaborated the potential regulatory mechanism of hub gene in HCC. We selected the top 10 statistically significant GO information items in biological process (BP), cell component (CC), and molecular function (MF)respectively (Figure 9A, Supplementary Table 3). It can be seen that in biological process (BP), hub gene is significantly enriched in Terms such as plant degradation, acute phase response, fibrinolysis; in cell component (CC), hub gene is enriched in blood microparticle, high-density lipoprotein. However, in molecular function (MF), the hub gene is enriched in Terms of enzyme inhibitor activity and steroid binding. KEGG enrichment analysis showed that hub gene was significantly enriched in cholesterol metabolism, PPAR signaling pathway, and drug metabolism cytochrome P450 pathway. These results suggest that these genes and their related regulatory mechanisms may be related to the occurrence and progression of HCC in the process of Hepatocytes transformation into HCC cells.
To explore the importance of the hub gene in the process of cell differentiation, we further evaluated the expression level of the hub gene through TCGA database. From the volcanic map in Figure 6A, we can see that there are 36 differential genes, including 2 upregulated genes (tumor group is higher than normal group) and 34 downregulated genes (tumor group is less than normal group). Subsequently, we used Kaplan Meier analysis to study the prognostic value of 36 hub genes in HCC and used ROC curve analysis to verify the discrimination ability of hub genes between tumor samples and normal samples. The results showed that 10 of 36 hub genes were closely related to the survival of HCC patients (P < 0.05, Figure 10C and D and Supplementary Table 6), and they were ALDOB, APOC3, APOH, CYP2E1, CYP3A4, GC, HRG, LINC01554, PDK4, and TXN, respectively.
ALDOB is a glycolytic metabolizing enzyme. ALDOB inhibits HCC by directly binding to and inhibiting glucose-6-phosphate dehydrogenase (G6PD), the rate limiting enzyme in pentose phosphate pathway, which reveals a new metabolic reprogramming mode due to the loss of ALDOB in hepatocellular carcinoma and provides a potential therapeutic strategy for the treatment of hepatocellular carcinoma.15,16 In our study, ALDOB was significantly less in HCC, and in survival analysis, high expression of ALDOB gene is associated with better prognosis. (P < 0.01).
APOC3 gene (Apolipoprotein C gene) is one of the anti-aging genes, which has a significant relationship with age. Recent studies have shown that elevated levels of the protein APOC3 in the blood are associated with an increased risk of cardiovascular disease.17 Wang’s study found that APOC3 may be a potential prognostic biomarker for HCC.18 In our study, the expression of APOC3 was less in HCC, but the mechanism of APOC3 in HCC remains unknown, they may be involved in steroid metabolism, PPAR signaling pathway and fatty acid metabolism.
APOH is involved in the metabolism of triglyceride (TG), and its phenotype will affect the level of TG. Abnormal lipid metabolism is an important factor leading to stroke and depression. Therefore, APOH is related to lipid metabolism and cerebrovascular diseases and is also a risk factor for atherosclerosis and hypertension.19,20 Our study showed that the expression of APOH in HCC was lower than that in normal tissues, and the prognosis of low expression of APOH was worse than that of high expression of APOH (P < 0.05).
CYP2E1 and CYP3A4 are members of the cytochrome P450 enzyme system. They are the core system members of drug metabolism. They are mainly distributed in the liver and can catalyze the metabolism of a variety of internal and external substances (including most clinical drugs). At present, it is believed that cytochrome enzymes are involved in the metabolism of exogenous substances (such as drugs, alcohol, chemicals, etc.), and the metabolites may be toxic or carcinogenic.21 It has been found that cytochrome P450 (CYPs), the major foreign metabolic enzyme, is significantly down-regulated in hepatocellular carcinoma tumor samples from European Caucasian patients compared to surrounding non-cancerous tissues.22 In our study, we found that the expression of CYP2E1 and CYP3A4 in HCC was lower than that in normal hepatocytes, and proved that low expression of CYP2E1 and CYP3A4 was associated with poor prognosis (P < 0.05).
Gc globulin is synthesized by hepatocytes and has a steroid binding site. It is a tool for binding and transporting vitamin D and its metabolites.23 In our study, the expression of GC in HCC was lower than that in normal tissues, and low GC expression was significantly correlated with poor prognosis (P < 0.01).
HRG is a gene located on chromosome 3, which can interact with heparin, thrombospondin and plasminogen.24 Studies have shown that HRG can induce macrophage polarization and vascular normalization by down-regulating PLGF, thus inhibiting tumor growth and metastasis.25 In our study, the expression of HRG in HCC was lower than that in normal tissues, and the low expression of HRG was significantly associated with poor prognosis (P < 0.010).
Linc01554 has been reported to be involved in the pathogenesis of nonalcoholic fatty liver disease and esophageal cancer.26,27 It has been reported that low expression of LINC01554 is significantly correlated with overall survival, pathological stage, hepatitis B infection, tumor size, portal vein tumor thrombus and TNM stage.28 This is consistent with our finding that low expression of LINC01554 indicates a poor prognosis.
Pyruvate dehydrogenase kinase 4 (PDK4) is a key enzyme of glucose metabolism, which is closely related to apoptosis, survival and proliferation of tumor cells. Many studies have shown that PDK4 plays an important role in the apoptosis of hepatocellular carcinoma.29,30 In our study, the expression of PDK4 in HCC is lower than that in normal tissues. Low expression of PDK4 indicates a poor prognosis.
Thioredoxin (Trx, TXN) is a kind of heat-stable protein widely existing as hydrogen carrier.31 In our study, we studied the effect of TXN gene on the prognosis of patients with liver cancer. Interestingly, compared with the expression level of the first nine genes in liver cancer, there is a negative correlation between the expression level and poor prognosis. The prognosis of patients with high TXN expression is worse than that of patients with low TxN expression, indicating that the expression of TXN gene may have carcinogenic effect.
Conclusion
Based on the single-cell data, this study analyzed the differences of the same kind of cells from normal samples and tumor samples, observed the interaction between different liver cells, analyzed the key nodes of liver cells transforming into liver cancer cells by Pseudo timing, and verified the genes of these nodes in TCGA database, systematically analyzed the expression of 10 genes closely related to the survival of HCC patients in liver cancer It is found that these gene deletions play an important role in the occurrence and development of HCC. There are still limitations in this study: for example, lack of experimental verification, and the mechanism of some genes in liver cancer also needs further research. All in all, the results and findings of this study can provide the basis and important reference for the clinical diagnosis and treatment of HCC, and also help to further study the molecular mechanism of liver cancer.
Ethical Statement
The data from GEO is shared and available to the public, and there are no ethical concerns.
Ethics Approval and Informed Consent
This study was approved by the Biomedical Research Ethics Committee of Affiliated Hospital of Zunyi Medical University (KLL-2021-301). Since all the data involved in this study were acquired from GEO public database, there is no risk of harming ethics and informed consent of this research.
Disclosure
The authors report no conflicts of interest in this work.
References
- 1.Forner A, Reig M, Bruix J. Hepatocellular carcinoma. Lancet (London, England). 2018;391(10127):1301–1314. doi: 10.1016/S0140-6736(18)30010-2 [DOI] [PubMed] [Google Scholar]
- 2.Villanueva A, Longo DL. Hepatocellular carcinoma. N Engl J Med. 2019;380(15):1450–1462. doi: 10.1056/NEJMra1713263 [DOI] [PubMed] [Google Scholar]
- 3.Ziegenhain C, Vieth B, Parekh S, et al. Comparative analysis of single-cell RNA sequencing methods. Mol Cell. 2017;65(4):631–43.e4. doi: 10.1016/j.molcel.2017.01.023 [DOI] [PubMed] [Google Scholar]
- 4.Baslan T, Hicks J. Unravelling biology and shifting paradigms in cancer with single-cell sequencing. Nat Rev Cancer. 2017;17(9):557–569. doi: 10.1038/nrc.2017.58 [DOI] [PubMed] [Google Scholar]
- 5.Fan J, Slowikowski K, Zhang F. Single-cell transcriptomics in cancer: computational challenges and opportunities. Exp Mol Med. 2020;52(9):1452–1465. doi: 10.1038/s12276-020-0422-0 [DOI] [PMC free article] [PubMed] [Google Scholar]
- 6.Ritchie ME, Phipson B, Wu D, et al. limma powers differential expression analyses for RNA-sequencing and microarray studies. Nucleic Acids Res. 2015;43(7):e47. doi: 10.1093/nar/gkv007 [DOI] [PMC free article] [PubMed] [Google Scholar]
- 7.Qiu X, Mao Q, Tang Y, et al. Reversed graph embedding resolves complex single-cell trajectories. Nat Methods. 2017;14(10):979–982. doi: 10.1038/nmeth.4402 [DOI] [PMC free article] [PubMed] [Google Scholar]
- 8.Tomczak K, Czerwińska P, Wiznerowicz M. The Cancer Genome Atlas (TCGA): an immeasurable source of knowledge. Contemp Oncol. 2015;19(1a):A68–77. doi: 10.5114/wo.2014.47136 [DOI] [PMC free article] [PubMed] [Google Scholar]
- 9.Yu G, Wang LG, Han Y, et al. clusterProfiler: an R package for comparing biological themes among gene clusters. Omics. 2012;16(5):284–287. doi: 10.1089/omi.2011.0118 [DOI] [PMC free article] [PubMed] [Google Scholar]
- 10.Robin X, Turck N, Hainard A, et al. pROC: an open-source package for R and S+ to analyze and compare ROC curves. BMC Bioinform. 2011;12:77. doi: 10.1186/1471-2105-12-77 [DOI] [PMC free article] [PubMed] [Google Scholar]
- 11.Stuart T, Butler A, Hoffman P, et al. Comprehensive integration of single-cell data. Cell. 2019;177(7):1888–902.e21. doi: 10.1016/j.cell.2019.05.031 [DOI] [PMC free article] [PubMed] [Google Scholar]
- 12.Aran D, Looney AP, Liu L, et al. Reference-based analysis of lung single-cell sequencing reveals a transitional profibrotic macrophage. Nat Immunol. 2019;20(2):163–172. doi: 10.1038/s41590-018-0276-y [DOI] [PMC free article] [PubMed] [Google Scholar]
- 13.Trapnell C, Cacchiarelli D, Grimsby J, et al. The dynamics and regulators of cell fate decisions are revealed by pseudotemporal ordering of single cells. Nat Biotechnol. 2014;32(4):381–386. doi: 10.1038/nbt.2859 [DOI] [PMC free article] [PubMed] [Google Scholar]
- 14.Qiu X, Hill A, Packer J, et al. Single-cell mRNA quantification and differential analysis with Census. Nat Methods. 2017;14(3):309–315. doi: 10.1038/nmeth.4150 [DOI] [PMC free article] [PubMed] [Google Scholar]
- 15.Chang YC, Yang YC, Tien CP, et al. Roles of aldolase family genes in human cancers and diseases. Trends Endocrinol Metab. 2018;29(8):549–559. doi: 10.1016/j.tem.2018.05.003 [DOI] [PubMed] [Google Scholar]
- 16.Li M, He X, Guo W, et al. Aldolase B suppresses hepatocellular carcinogenesis by inhibiting G6PD and pentose phosphate pathways. Nat Cancer. 2020;1(7):735–747. doi: 10.1038/s43018-020-0086-7 [DOI] [PubMed] [Google Scholar]
- 17.Crosby J, Peloso GM, Auer PL, et al. Loss-of-function mutations in APOC3, triglycerides, and coronary disease. N Engl J Med. 2014;371(1):22–31. [DOI] [PMC free article] [PubMed] [Google Scholar]
- 18.Wang X, Gong Y, Deng T, et al. Diagnostic and prognostic significance of mRNA expressions of apolipoprotein A and C family genes in hepatitis B virus-related hepatocellular carcinoma. J Cell Biochem. 2019;120(10):18246–18265. doi: 10.1002/jcb.29131 [DOI] [PubMed] [Google Scholar]
- 19.Castro A, Lázaro I, Selva DM, et al. APOH is increased in the plasma and liver of type 2 diabetic patients with metabolic syndrome. Atherosclerosis. 2010;209(1):201–205. doi: 10.1016/j.atherosclerosis.2009.09.072 [DOI] [PubMed] [Google Scholar]
- 20.Hoekstra M, Chen HY, Rong J, et al. Genome-wide association study highlights APOH as a novel locus for lipoprotein(a) levels-brief report. Arterioscler Thromb Vasc Biol. 2021;41(1):458–464. doi: 10.1161/ATVBAHA.120.314965 [DOI] [PMC free article] [PubMed] [Google Scholar]
- 21.Nebert DW, Russell DW. Clinical importance of the cytochromes P450. Lancet (London, England). 2002;360(9340):1155–1162. doi: 10.1016/S0140-6736(02)11203-7 [DOI] [PubMed] [Google Scholar]
- 22.Nekvindova J, Mrkvicova A, Zubanova V, et al. Hepatocellular carcinoma: gene expression profiling and regulation of xenobiotic-metabolizing cytochromes P450. Biochem Pharmacol. 2020;177:113912. doi: 10.1016/j.bcp.2020.113912 [DOI] [PubMed] [Google Scholar]
- 23.Meier U, Gressner O, Lammert F, et al. Gc-globulin: roles in response to injury. Clin Chem. 2006;52(7):1247–1253. doi: 10.1373/clinchem.2005.065680 [DOI] [PubMed] [Google Scholar]
- 24.Dantas E, Erra Díaz F, Pereyra Gerber P, et al. Histidine-rich glycoprotein inhibits HIV-1 infection in a pH-dependent manner. J Virol. 2019;93(4). doi: 10.1128/JVI.01749-18 [DOI] [PMC free article] [PubMed] [Google Scholar]
- 25.Rolny C, Mazzone M, Tugues S, et al. HRG inhibits tumor growth and metastasis by inducing macrophage polarization and vessel normalization through downregulation of PlGF. Cancer Cell. 2011;19(1):31–44. doi: 10.1016/j.ccr.2010.11.009 [DOI] [PubMed] [Google Scholar]
- 26.Fan Q, Liu B. Identification of a RNA-seq based 8-long non-coding RNA signature predicting survival in esophageal cancer. Med Sci Monit. 2016;22:5163–5172. doi: 10.12659/MSM.902615 [DOI] [PMC free article] [PubMed] [Google Scholar]
- 27.Ryaboshapkina M, Hammar M. Human hepatic gene expression signature of non-alcoholic fatty liver disease progression, a meta-analysis. Sci Rep. 2017;7(1):12361. doi: 10.1038/s41598-017-10930-w [DOI] [PMC free article] [PubMed] [Google Scholar]
- 28.Li L, Huang K, Lu Z, et al. Bioinformatics analysis of LINC01554 and its co-expressed genes in hepatocellular carcinoma. Oncol Rep. 2020;44(5):2185–2197. [DOI] [PMC free article] [PubMed] [Google Scholar]
- 29.Qin YJ, Lin TY, Lin XL, et al. Loss of PDK4 expression promotes proliferation, tumorigenicity, motility and invasion of hepatocellular carcinoma cells. J Cancer. 2020;11(15):4397–4405. doi: 10.7150/jca.43459 [DOI] [PMC free article] [PubMed] [Google Scholar]
- 30.Yang C, Wang S, Ruan H, et al. Downregulation of PDK4 increases lipogenesis and associates with poor prognosis in hepatocellular carcinoma. J Cancer. 2019;10(4):918–926. doi: 10.7150/jca.27226 [DOI] [PMC free article] [PubMed] [Google Scholar]
- 31.Hilgers RH, Kundumani-Sridharan V, Subramani J, et al. Thioredoxin reverses age-related hypertension by chronically improving vascular redox and restoring eNOS function. Sci Transl Med. 2017;9(376). doi: 10.1126/scitranslmed.aaf6094 [DOI] [PMC free article] [PubMed] [Google Scholar]


