

Abstract
Mitochondria require oxygen to produce ATP in sufficient quantities to drive energy-requiring reactions in eukaryotic organisms. The measurement of oxygen consumption rates from isolated mitochondria in vitro is a useful and valuable technique in the research and evaluation of mitochondrial dysfunction and disease since ADP-dependent oxygen consumption directly reflects coupled respiration or oxidative phosphorylation (OXPHOS). This chapter describes the traditional method of mitochondrial polarography using a Clark electrode for measuring coupled respiration in freshly isolated mitochondria from both mammalian tissues and Drosophila melanogaster.
Keywords: Mitochondria, Polarography, Coupled respiration, Oxygen consumption rate, Oxidative phosphorylation
1. Introduction
The analysis of oxygen consumption from isolated mitochondria by polarography is a well-established technology that has been utilized for over 50 years (1). This approach is based upon the fundamental biochemical principle of oxidative phosphorylation (OXPHOS) that electron transport along the respiratory chain (with the final step being consumption of molecular oxygen via reduction to H2O by cytochrome c oxidase) is functionally coupled to the phosphorylation of ADP through the generation and utilization of the proton electrochemical gradient across the mitochondrial inner membrane (2). The ability to measure oxygen consumption of intact mitochondria isolated from human tissues or cells or from animal tissues is an important tool for functional analysis of OXPHOS in the context of mitochondrial dysfunction and disease (2-4). Mitochondrial polarography involves using a Clark electrode to measure soluble oxygen content in a closed system.
In the presence of oxidizable substrates, freshly isolated mitochondria are introduced into the system and oxygen consumption, in the presence of exogenously added ADP and or inhibitors, is measured. In this chapter, the methods for isolating intact mitochondria from tissues and for performing mitochondrial polarography are presented.
2. Materials
Prepare all solutions using ultrapure water (prepared by purifying deionized water via reverse osmosis to attain a resistivity of 18 MΩ cm at 25°C). Prepare and store all reagents at room temperature (unless indicated otherwise). All waste disposal regulations should be followed when disposing waste materials.
2.1. Stock Solutions (see Note 1)
1 M mannitol: Dissolve 91 g mannitol in 300 mL of ultrapure water and then add water to final volume of 0.5 L (see Note 2).
0.5 M sucrose: Dissolve 85.6 g sucrose in 300 mL ultrapure water and then add water to final volume of 0.5 L.
0.5 M HEPES [4-(2-Hydroxyethyl)piperazine-1-ethanesulfonic acid]: Dissolve 59.6 g HEPES in 300 mL of ultrapure water and adjust pH to 7.2 using 10 M KOH. Add water to final volume of 0.5 L.
0.4 M EGTA (ethylene glycol tetraacetic acid): Add 15.2 g EGTA to 90 mL ultrapure water. Add 3.5 g NaOH pellets initially and then carefully titrate pH to 7.5 by adding individual NaOH pellets as needed (see Note 3). Add water to final volume of 100 mL.
1 M Tris–HCl: Dissolve 60.6 g Tris base in 400 mL of ultrapure water. Carefully adjust pH to 7.2 using concentrated HCl. Add water to final volume of 0.5 L.
1 M KCl: Dissolve 37.3 g KCl in 400 mL of ultrapure water. Add water to final volume of 0.5 L.
1 M KH2PO4: Dissolve 68 g KH2PO4 in 400 mL of ultrapure water. Adjust pH to 7.2 with concentrated HCl. Add water to final volume of 0.5 L.
2.2. Equipment and Buffer for Mitochondrial Isolation
Mitochondrial isolation buffer: 5 mM HEPES (pH 7.2), 210 mM mannitol, 70 mM sucrose, 1 mM EGTA, and 0.5% (w/v) BSA. To make 1 L, combine 210 mL of 1 M mannitol, 140 mL of 0.5 M sucrose, 10 mL of 0.5 M HEPES, 2.5 mL of 0.4 M EGTA, and 5 g of bovine serum albumin (BSA, fraction V, fatty acid free). Add ultrapure water to final volume of 1 L. Filter and sterilize the buffer and store at 4°C.
Dounce glass homogenizer (Kontes): It is useful to have at least two sizes of Dounce homogenizers (with accompanying “tight” and “loose” glass pestles) to facilitate homogenization of various amounts of tissues. In our experience, having sizes of 15, 7, and 2 mL provide sufficient capacity and flexibility for homogenizing mammalian tissues, fly tissues, and cell pellets.
Refrigerated centrifuge and microfuge (set at 4°C), 50 mL Oak Ridge centrifuge tubes, and 1.5 mL microfuge tubes.
2.3. Reagents for Polarography
Respiration buffer: 225 mM mannitol, 75 mM sucrose, 10 mM KCl, 10 mM Tris–HCl (pH 7.2), and 5 mM KH2PO4. To make 0.5 L, combine 112.5 mL of 1 M mannitol, 75 mL of 0.5 M sucrose, 5 mL of 1 M KCl, 5 mL of 1 M Tris–HCl (pH 7.2), and 2.5 mL of 1 M KH2PO4 (pH 7.2). Add ultrapure water to final volume of 0.5 L. Filter, sterilize, and dispense into 50 mL aliquots and store at −20°C.
Malate, glutamate, pyruvate, and succinate stock solutions (0.65 M): Make up 20 mL amounts of 0.65 M stocks of each, adjusting pH to 7.2 with 10 M KOH. Dispense into 150 μL aliquots and store at −80°C. These stock solutions are generally stable for several years when stored at −80°C. All are used at a working concentration of 5 mM (see Note 4).
ADP (25 mM): Prepare 20 mL of 25 mM stock solution of ADP (214 mg in 20 mL total volume) and use diluted (1 M) KOH to adjust the pH to within 6.0–6.8 to ensure long-term stability. Immediately dispense into 150 μL aliquots and store at −80°C (see Note 5). Usually 125 nmol of ADP is used to stimulate respiration for 200–300 μg of isolated mitochondria.
6.5 mM DNP (2,4-dinitrophenol): Prepare 20 mL of a 6.5 mM stock by placing 24 mg of DNP into 4 mL of 1 M NaOH in a 15 mL polypropylene tube and fully dissolve by heating at 50°C for 20 min. Adjust the pH to neutral with 1 M HCl by adding ~3 mL. Check the pH until 7.2 is achieved (solution of DNP should have a translucent yellow color). Add ultrapure water to make a 20 mL final volume, dispense into 150 μL aliquots, and store at −80°C (see Note 6).
2.4. Equipment for Polarography
Clark-type microoxygen probe (YSI LifeSciences, Yellow Springs, OH).
Water-jacketed microoxygen chamber (0.65 mL) with magnetic stirrer (YSI LifeSciences, Yellow Springs, OH) and standard circulating water bath.
Oxygen monitor (YSI model 5300A, YSI LifeSciences, Yellow Springs, OH).
PowerLab 4/30 electronic chart recorder plus LabChart analysis software (ADInstruments, Colorado Springs, CO).
3. Methods
3.1. Isolation of Mitochondria from Tissue
Dissect or collect desired tissue (see Note 7) and wash twice with 2–5 mL of either ice-cold PBS or isolation buffer to remove any associated debris (see Note 8).
Mince the tissue with a razor blade and place in a prechilled Dounce homogenizer. Add up to 10 mL of the isolation buffer, then homogenize using eight to ten manual passes of the glass pestle (see Notes 9 and 10).
Transfer the homogenate into a 50 mL centrifuge tube (see Note 11).
Centrifuge at 1,500 × g for 5 min at 4°C.
Carefully decant the supernatant into a fresh tube, avoiding transferring any loose material from the pellet and centrifuge at 8,000 × g for 15 min at 4°C.
Discard the supernatant and wash the mitochondrial fraction by suspending the pellet in 25 mL of isolation buffer and repeating centrifugation at 8,000 × g for 15 min at 4°C.
Suspend the washed mitochondrial pellet in isolation buffer (use 0.1 mL per gram of tissue used) and keep on ice while preparing the polarographic chamber (see Subheading 3.2 below). Determine the protein concentration using any one of the standard colorimetric methods such as the Bradford assay (5) (see Note 12).
3.2. Preparation of Equipment for Polarography
Disassemble and clean the microchamber, which consists of a 650-μL plastic chamber with magnetic stirrer, inlet and outlet ports for chamber flushing, a port for the oxygen electrode, a port for introduction of samples/substrates into chamber, and rotating stopcock with transparent viewport that is adhered to the chamber using silicone grease. To facilitate the cleaning of old grease, use a cotton swab saturated with an organic solvent such as xylene or methanol. Once clean, reassemble the chamber apparatus, turn on the circulating water bath to heat and maintain the water-jacketed chamber at 30°C, and turn on the oxygen monitor, electronic chart recorder, and computer.
Thaw a 50 mL aliquot of respiration buffer and ensure that it is saturated with room air by shaking in a flask in a 30°C water bath for at least 30 min.
Prepare the oxygen probe by covering the probe tip with a drop of fresh KCl solution (approximately half saturated by dissolving 5.25 g KCl in 16 mL ultrapure water) then overlaying the polyethylene membrane and securing with the O-ring as according to the manufacturer’s instructions (see Note 13).
Calibrate the oxygen monitor and the electronic data recorder by first removing the probe jack from the monitor and setting the zero point for the data recorder. Plug the probe jack back into the monitor, flush the clean chamber with a few milliliters of equilibrated buffer then fill the chamber with buffer, close the chamber cock, and turn on magnetic stirrer (see Note 14). Once the signal has stabilized, calibrate the oxygen monitor for 100% air saturation and set the maximum point on the chart recorder for proper unit conversion of oxygen content (see Note 15).
3.3. Performing Mitochondrial Polarography
On ice, thaw aliquots of substrates (glutamate, malate, pyruvate, and succinate), ADP, and DNP.
Fill the chamber with fresh respiration buffer, and once a stable baseline is observed (usually after 1–3 min), add 5 μL of each of the desired substrates (see Note 4) and observe recording for 2–5 min until baseline restabilizes.
Add 200–500 μg of freshly isolated mitochondria to the chamber (see Note 16). There should be a low oxygen consumption rate (state IV or ADP-limiting rate) primarily caused by an endogenous baseline leak of protons across the inner membrane of the isolated mitochondria (4).
Add 5 μL (125 nmol) of ADP. The addition of ADP should stimulate a high oxygen consumption rate (state III or ADP-stimulating rate) that will transition back to a baseline state IV rate once the exogenously added ADP is consumed by OXPHOS (see Note 17). For well-coupled mitochondria, the state III rate should be at least threefold greater than the state IV rate (Figs. 1-3) (see Note 18). After state IV respiration has resumed for 1–2 min (allowing sufficient time to accurately measure the rate), a second addition of ADP can be made which should result in a similar state III rate and transition back to state IV (let run for 1–2 min).
Add DNP to a final concentration of 50 μM (see Note 6) and measure the uncoupled respiration rate for at least 2–3 min to complete the assay (see Note 19).
Fig. 1.
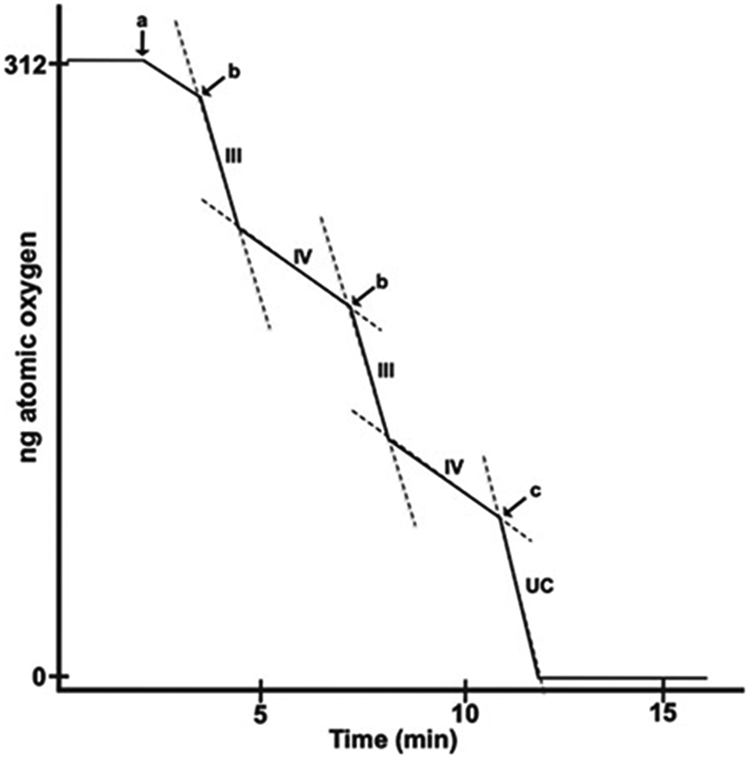
Idealized trace of a polarographic run. At time “0,” substrate (5 μM of glutamate + malate or succinate) is added to chamber full of air-saturated respiration buffer, and a stable baseline is observed. (a) Isolated mitochondria are added to a final concentration of 0.3 mg/mL. (b) 125 nmol of ADP is added, stimulating state III rate which transitions to state IV once exogenous ADP is consumed by OXPHOS. (c) DNP (50 μM) is added to stimulate maximal uncoupled rate (UC).
Fig. 3.

Typical polarographic trace of Drosophila larval mitochondria with glutamate + malate as substrate. A polarographic experiment using mitochondria isolated from wild-type Drosophila melanogaster third instar larvae is shown. (a) Glutamate + malate (5 μM each) is added. (b) Fly larval mitochondria (0.3 mg/mL) is added. (c) 125 nmol of ADP is added. (d) DNP (50 μM) is added.
3.4. Data Analysis
The typical parameters determined from mitochondrial polarography include state III rate, state IV rate, RCR, uncoupled rate, and the ADP/O ratio (Fig. 1). The RCR (respiratory control ratio or state III rate/state IV rate) is a good indicator of the integrity of the inner membrane of the isolated mitochondria and is sensitive for indicating OXPHOS defects, while the ADP/O ratio is a direct reflection of phosphorylation efficiency and can indicate abnormalities of the ATP synthase or coupling (2, 4). The uncoupled rate (UC) reflects the maximal respiratory capacity of the mitochondria and in wild-type mitochondria the ratio of state III rate/UC rate is usually between 0.85 and 0.95 (4).
Using the LabChart analysis software that accompanies the digital chart recorder, the oxygen consumption rates (i.e., state III, state IV, and UC) are measured from the linear phases and normalized to protein content (rates expressed as ng atomic oxygen/min/mg mitochondrial protein).
For the ADP/O ratio, the amount of ADP consumed during state III (125 nmol) is divided by the amount of oxygen consumed during state III (ng atomic oxygen).
Fig. 2.

Typical polarographic trace of rat heart mitochondria with succinate as substrate. A polarographic experiment using mitochondria isolated from wild-type rat heart is shown. (a) Succinate (5 μM) is added. (b) Rat heart mitochondria (0.9 mg/mL) is added. (c) 125 nmol of ADP is added. (d) DNP (50 μM) is added.
Footnotes
Sterilize all stock solutions by filtration through 0.22-μm vacuum filter and store at 4°C for 1–2 months. Solutions can also be autoclaved, except for those containing sucrose, which will caramelize and turn solution brown.
When stored at 4°C, the mannitol stock solution (or other mannitol containing solutions) may precipitate out of solution. When this occurs, simply heat in a 65°C water bath to dissolve crystals immediately prior to using.
EGTA will not adequately dissolve without adding base. Once the pH is sufficiently raised, EGTA will rapidly go into solution. Take care when titrating to pH 7.5 so as not to overshoot.
The stock solutions are 0.65 M so that adding 5 μL of a stock solution in the microchamber gives a final concentration of 5 mM. The most common substrates utilized include malate, glutamate, pyruvate, and succinate and are oxidized at high rates in multiple mammalian tissues and cell types (3, 4, 6-9). Typically, malate + glutamate or malate + pyruvate are used for assaying complex I-specific respiration, while succinate is used for assaying complex Il-specific respiration. Palmitoylcarnitine (0.4 mM) plus malate (1 mM) is a substrate pair useful for assessing fatty acid oxidation. Ascorbate in combination with tetramethylphenylenediamine (TMPD) to reduce intramito-chondrial cytochrome c can be used for testing respiration directly through complex IV (3, 4). It is important to ensure that the pH of substrates and buffer stays between 7.2 and 7.4. Most substrates used for polarography are organic acids and adding substrates that are not pH neutral can uncouple mitochondria.
The accuracy of the ADP concentration is important because the calculation of ADP/O ratios is based upon the assumption that each microliter of ADP contains 25 nmol.
Uncouplers abolish the functional linkage between the respiratory chain and the ATP synthase by dissipating the proton electrochemical gradient. We routinely use DNP for polarography, but other proton ionophores such as carbonyl cyanide m-chlorophenyl hydrazone (CCCP) or carbonyl cyanide-p-trifluoromethoxyphenylhydrazone (FCCP) can also be used. The stock solution of DNP is 6.5 mM; therefore, adding 5 μL of DNP to the microchamber full volume will result in a final concentration of 50 μM.
In general, 1 g of mammalian tissue will provide a yield of 0.5–2 mg of isolated mitochondria, depending on the specific tissue. For Drosophila, 100 adult flies or sufficient third instar larvae to fill a 1.5 mL Eppendorf to 0.5 mL will yield approximately 0.5 mg mitochondria.
It is extremely important to keep all reagents and samples at 4°C or on ice at all times.
The optimal buffer volume to tissue weight ratio is 10 mL/g tissue. If using smaller amounts of tissue, one can reduce the amount of isolation buffer used proportionally.
For liver and brain, the tissues have minimal connective tissue, so eight to ten strokes with pestle B (the “tight” fitting pestle) typically result in complete homogenization. For tissues with more significant connective tissue, such as lung, heart, skeletal muscle and kidney, a razor blade can be used to mince the tissue into small pieces to facilitate homogenization and improve the mitochondrial yield. In addition, for heart and skeletal muscle, pestle A (the “loose” fitting pestle) should be used for five initial passes to ensure complete connective tissue breakdown, followed by five to six additional passes using pestle B to complete homogenization. For lung tissue, which may be still partially inflated after dissection, initially add one-half of the volume of the necessary buffer for the first two strokes due to trapped air contained within the lung tissue sample in order to avoid spillage.
For mitochondria isolation from Drosophila adult or larvae, we use buffer-saturated cheesecloth to filter either adult exoskeleton debris or larval fat from the homogenate prior to centrifugation.
Be sure to account for the 0.5% BSA when determining protein concentration. Either subtract it from the total concentration or wash and resuspend small aliquot of mitochondrial pellet in BSA-free buffer before measuring protein concentration.
A polyethylene membrane that allows diffusion of oxygen, but not metabolites, is required. The plastic from any generic sandwich plastic bag actually works very well as the membrane. Avoid using saturated KCl solution as precipitating crystals will disrupt optimal probe functioning. After several days of use, the silver anode will become uneven with AgCl leading to probe instability. Therefore, when the probe exhibits unstable behavior not corrected by changing the membrane, the old chloride layer of the anode should be carefully removed by gentle abrasion using the supplied abrasive pad (avoid abrading the platinum cathode in the center of the probe tip). Once the anode tip appears a bright and clean silver color, add a fresh layer of chloride by electroplating the KCl solution using the “chlorider” supplied with the probe.
Avoid introducing air bubbles into the chamber, as bubbles will displace volume, reducing the effective volume of the chamber.
Assuming a chamber volume of 650 μL, constant temperature of 30°C, and sea level altitude (1 atm. of pressure), the air-saturated buffer in the chamber will contain 312 ng of atomic oxygen (10).
In general, mitochondria should be added to a final protein concentration of 0.3–0.8 mg/mL, and the isolated mitochondrial suspension should have a minimum concentration of 10 mg/mL in order to minimize the volume added to the chamber.
Sufficient mitochondria should be added so that a typical assay takes approximately 10–15 min. Avoid adding too much mitochondria which results in the assay taking less than 5 min and is too fast to make additions of ADP or inhibitors comfortably. If the assay takes longer than 20–25 min, wild-type mitochondria can exhibit functional deterioration. The optimal amount of mitochondria must be determined empirically for each tissue. In our experience, the optimal concentration for mammalian mitochondria is 0.3–0.6 mg/mL and for Drosophila mitochondria is 0.45–0.9 mg/mL.
The ratio of state III rate to state IV rate is expressed as the respiratory control ratio (RCR) and should be greater than 3.0 for well-coupled wild-type mitochondria (4). An RCR of less than 3.0 for wild-type mitochondria most commonly suggests a suboptimal concentration of mitochondria or a technical problem with the isolation of mitochondria that damages the integrity of the inner membrane.
DNP should be added, while there is at least 30% of the total oxygen content remaining in the microchamber. This ensures that maximal uncoupled respiration occurs for a sufficient amount of time to allow an accurate determination of the rate (i.e., at least 2 min).
References
- 1.Chance B, and Williams GR (1955) A simple and rapid assay of oxidative phosphorylation, Nature 175, 1120–1121. [DOI] [PubMed] [Google Scholar]
- 2.Brand MD, and Nicholls DG (2011) Assessing mitochondrial dysfunction in cells, Biochem. J 435, 297–312. [DOI] [PMC free article] [PubMed] [Google Scholar]
- 3.Barrientos A (2002) In vivo and in organello assessment of OXPHOS activities, Methods 26, 307–316. [DOI] [PubMed] [Google Scholar]
- 4.Trounce IA, Kim YL, Jun AS, and Wallace DC (1996) Assessment of mitochondrial oxidative phosphorylation in patient muscle biopsies, lymphoblasts, and transmitochondrial cell lines, Methods Enzymol 264, 484–509. [DOI] [PubMed] [Google Scholar]
- 5.Bradford MM (1976) A rapid and sensitive method for the quantitation of microgram quantities of protein utilizing the principle of protein-dye binding, Anal Biochem 72, 248–254. [DOI] [PubMed] [Google Scholar]
- 6.Puchowicz MA, Varnes ME, Cohen BH, Friedman NR, Kerr DS, and Hoppel CL (2004) Oxidative phosphorylation analysis: assessing the integrated functional activity of human skeletal muscle mitochondria–case studies, Mitochondrion 4, 377–385. [DOI] [PubMed] [Google Scholar]
- 7.Rasmussen UF, and Rasmussen HN (2000) Human quadriceps muscle mitochondria: a functional characterization, Mol Cell Biochem 208, 37–44. [DOI] [PubMed] [Google Scholar]
- 8.Rossignol R, Letellier T, Malgat M, Rocher C, and Mazat JP (2000) Tissue variation in the control of oxidative phosphorylation: implication for mitochondrial diseases, Biochem J 347 Pt 1, 45–53. [PMC free article] [PubMed] [Google Scholar]
- 9.Wenchich L, Drahota Z, Honzik T, Hansikova H, Tesarova M, Zeman J, and Houstek J (2003) Polarographic evaluation of mitochondrial enzymes activity in isolated mitochondria and in permeabilized human muscle cells with inherited mitochondrial defects, Physiol Res 52, 781–788. [PubMed] [Google Scholar]
- 10.Truesdale GA, and Downing AL (1954) Solubility of Oxygen in Water, Nature 173, 1236. [Google Scholar]