

Abstract
Background
Plasma P-tau217 and P-tau181 are associated with Alzheimer’s disease (AD) tau pathology. P-tau217 is a more novel blood-based biomarker that may be diagnostically superior to P-tau181. We compared the diagnostic value of both biomarkers in a cohort of cognitively normal participants and patients with a clinical diagnosis of Mild Cognitive Impairment, AD or frontotemporal lobar degeneration (FTLD).
Methods
In this multi-cohort diagnostic performance study, we gathered plasma samples from the University of California San Francisco Memory and Aging Center and the Advancing Research and Treatment for Frontotemporal Lobar Degeneration consortium. Plasma Ptau-181 and Ptau-217 were measured using electrochemiluminescence-based assays which only differed in the biotinylated antibody epitope specificity. Receiver operating characteristic analyses were used to determine diagnostic accuracy of both plasma markers using clinical diagnosis, neuropathological findings, and amyloid- and tau-PET measures as gold standards. Difference between two area under the curve (AUC) analyses was tested with the Delong test.
Findings
Data were collected from 593 participants (mean age 64 years [SD 13], 294 [49.6%] females) between July and November 2020. Plasma P-tau217 and P-181 were correlated (r=0.90, p<0·0001). Both P-tau217 and P-tau181 concentrations were increased in clinical AD (mean age 65.3 years) relative to cognitively normal controls (mean age 60.9 years) (P-tau217 AUC=0.98, 95%CI=[0.95–1.00], P-tau181 AUC=0.97, 95%CI=[0.94–0.99], p[difference]=0.31, n=75 vs 118) and in pathology-confirmed AD (mean age 72.8 years) vs FTLD (mean age 67.1 years) (P-tau217 AUC=0.96, 95%CI=[0.92–1.00], P-tau181 AUC=0.91, 95%CI=[0.82–1.00], p[difference]=0.22, n=15 vs 68). P-tau217 outperformed P-tau181 in differentiating clinical AD from FTLD spectrum (mean age 66.8 years) (P-tau217 AUC=0.93, 95%CI=[0.91–0.96], P-tau181 AUC=0.91, 95%CI=[0.88–0.94], p[difference]=0.007, n=75 vs 274). P-tau217 was a stronger indicator of amyloid-PET positivity (P-tau217: AUC=0.91, 95%CI=[0.88–0.94], P-tau181: AUC=0.89, 95%CI=[0.86–0.93], p[difference]=0.049, n=146 vs 214). Tau-PET binding in the temporal cortex was more strongly associated with P-tau217 than P-tau181 (r=0.79 vs r=0.72, p[difference] <0·0001, n=230).
Interpretation
In a direct comparison using matched immunoassays, both P-tau217 and P-tau181 had excellent diagnostic performance for differentiating AD from other groups. There were small, but statistically significant differences in favor of P-tau217 for differential diagnosis of clinical AD, indication of amyloid-PET-positivity and stronger correlations with tau-PET signal. Pending replication in independent, diverse, and older cohorts, plasma P-tau217 and P-tau181 may be useful screening tools to identify individuals with underlying amyloid and AD tau pathology.
Funding:
US National Institutes of Health, State of California Department of Health Services, Rainwater Charitable Foundation, Michael J Fox foundation, Alzheimer’s Association.
Introduction
Tau pathology plays an essential role in Alzheimer’s disease (AD) and in about half of frontotemporal lobar degeneration (FTLD) spectrum diseases.1 The clinical syndromes associated with AD or FTLD pathology are heterogeneous and frequently overlap, particularly in younger individuals. Established biomarkers for AD including beta amyloid and tau measurements in cerebrospinal fluid (CSF), or amyloid or tau positron emission photography (PET) imaging, have been of limited use for screening because of invasiveness, high costs, and the need for specialized personnel. Blood-based biomarkers generally have lower costs, are less invasive and have the potential to be deployed widely throughout the community, allowing for early and repeated testing.
With the development of disease modifying AD therapies, a blood test could be employed to identify patients with underlying AD pathology to undergo more established CSF or PET diagnostic testing prior to initiating therapy. This may be particularly valuable in clinical syndromes that are not strongly predictive of a specific neuropathology but where AD pathology or co-pathology is a possibility, such as mild cognitive impairment (MCI),2,3 corticobasal syndrome (CBS),4 and dementia with Lewy bodies (DLB).5
Phosphorylated tau (P-tau) is a key component of neurofibrillary tangles in AD pathology. Plasma P-tau181 is a valuable differential diagnostic marker with concentrations 1.5–3.5 times higher in AD compared to normal controls (NC),6–8 and 1.8–3.7 times higher in AD compared clinical and pathology-confirmed FTLD.6 P-tau181 is a strong indicator of both amyloid- (receiver operating characteristic (ROC) area under the curves (AUC): 0.769-0.91)6 and tau-PET-positivity (AUC: 0.839-0.938), and can be used for individualized prediction of AD dementia in patients with MCI.10,11
Tau has over forty phosphorylation sites, though little research has been done on their comparative diagnostic value, especially in plasma. A recent autopsy study indicated that P-tau217 was the most important phosphorylation site in the differentiation between AD and control brain tissue, outperforming P-tau181.12 Several studies have shown an advantage of P-tau217 over P-tau181 when measured in CSF using mass spectrometry13,14 or immunoassays.15,16 When measured simultaneously in CSF using mass spectrometry, P-tau217 had higher accuracy for differentiating amyloid-PET-positive participants from amyloid-PET-negative (AUC=0.96 versus AUC=0.79, n=82).14 In an immunoassay study using similar assays for P-tau217 and P-tau181, CSF P-tau217 was consistently more strongly correlated with amyloid- and tau-PET binding than P-tau181. P-tau217 also differentiated AD dementia from other neurodegenerative diseases with somewhat higher accuracy.15 A comparative mass-spectrometry study (n=92) in plasma also showed that P-tau217 outperformed P-tau181 for detecting amyloid-PET-positivity (AUC=0.92 versus AUC=0.75).17 Similarly, an immunoassay study in larger cohorts reported that plasma P-tau217 performed similar to CSF P-tau217 and tau-PET and outperformed plasma P-tau181 in identifying AD in a clinical cohort (AUC of 0.96 for P-tau217 vs 0.81 for P-tau181, n=220).9 However, the P-tau217 and P-tau181 plasma assays used different platforms, detector antibodies, buffers, and calibrators. As pointed out by the authors,9 these important technical differences complicated the interpretation of which P-tau epitope might be superior for differential diagnosis and other purposes. A more recent study using assays with better comparable antibodies and the same technology did not find such large differences in performance.18 Additional work is therefore needed to confirm the diagnostic superiority of P-tau217 since previously observed differences could be attributable to assay characteristics unrelated to which P-tau residue was measured.
As plasma P-tau measurements become more widely available and are increasingly planned for use in research and clinical care, it will be important to understand the relative merits of different epitopes and assays. In this study we compared plasma P-tau217 and P-tau181, measured using a novel P-tau181 assay with the same electrochemiluminescence-based technology, antibody and buffers as the P-tau217 assay. We analyzed a wide range of neurodegenerative diseases including the full spectrum of AD, MCI, FTLD and other dementia patients as well as age matched controls.
Methods
Participants
Data were retrospectively collected between July and November 2020. The cohort consisted of clinically normal controls, patients in the AD or FTLD spectrum, patients with DLB and with traumatic encephalopathy syndrome (TES) (see details in eMethod). Normal controls were healthy elderly with normal neurological examinations, normal neuropsychological testing and Clinical Dementia Rating (CDR®)19 scores of 0. Participants were included when both P-tau217 and P-tau181 were successfully measured in plasma.
Participants provided written informed consent at the time of recruitment. The study was approved by the institutional review board of each research center from which the individual was recruited.
Pathology diagnosis
Eighty-three participants from the UCSF Memory and Aging Center had a pathology-confirmed diagnosis. AD neuropathological changes, including Thal amyloid phase, CERAD neuritic plaque score and Braak neurofibrillary tangles stage were ascertained as previously described.20 FTLD participants were grouped as FTLD-tau or FTLD-TAR DNA-binding protein 43 (FTLD-TDP) as described.21 Lewy body disease and chronic traumatic encephalopathy (CTE) neuropathological changes were also assessed.22–24 One AD patient and seven FTLD-TAU patients had Limbic-predominant age-related TDP-43 encephalopathy (LATE) co-pathology.25
Procedures
P-tau217 and P-tau181 assays differed only in their epitope specific capture antibodies. Biotinylated-IBA493 was used as a capture antibody for the P-tau217 assay and biotinylated-AT270 for the P-tau181 assay. In both assays, SULFO-TAG-Ru-4G10-E2 (anti-tau monoclonal antibody) was used as detector antibody. Assays were performed in technical duplicate on the same sample aliquot and processed together in the same batch on a streptavidin small spot plate using the Meso Scale Discovery platform (MSD, Rockville, Maryland) (see eMethods and eTables 1–3 for details on assays).
Plasma NfL was measured using Simoa technology with either a homebrew kit or commercial kit on a Quanterix HD-1 analyzer (Quanterix, Billerica, MA) (eMethod).
Amyloid-PET, tau-PET, and MRI image data were acquired across multiple centers; acquisition, processing, and analyses are fully detailed in the eMethod. Amyloid-PET status was derived from visual read26 based on PET acquired with [11C]Pittsburgh Compound B (PIB), [18F]florbetapir, or [18F]florbetaben. Tau-PET was acquired using [18F]Flortaucipir; Standardized Uptake Value Ratio (SUVR) values were extracted from the temporal structures using the inferior cerebellum as a reference, and a threshold of SUVR > 1.27 was used to determine tau-PET positivity.1 Magnetization Prepared Rapid Gradient Echo (MP-RAGE) T1-weighted images were acquired from various 3 Tesla scanners; total intracranial volume was used as a covariate in volumetric analyses.
Statistical analysis
Raw fluid biomarker concentrations were not normally distributed (skewness: P-tau181=3.47, P-tau217=2.34, kurtosis: P-tau181=20.52, P-tau217=6.32); natural log transformation improved the distributions (skewness: P-tau181=0.69, P-tau217=0.47, kurtosis: P-tau181=0.02, P-tau217=−0.10). To clearly convey the distribution of P-tau concentrations, all figures and plots represent raw P-tau217 and P-tau181 values, although group comparisons were conducted using ANCOVAs on natural log-transformed values. For each model, the distribution of the residuals was examined using histograms, quantile-quantile, and residuals-predicted plots. All ANCOVAs were adjusted for age and sex; additional covariates were used when applicable: CDRsb when comparing groups of clinically-impaired or pathology-confirmed patients, or time between blood draw and death when analyzing neuropathology data. Partial η2 (η2p) was used as a measure of effect size for group differences, and pairwise post hoc comparisons were conducted using Bonferroni correction. Bivariate correlations between plasma values or plasma and PET values were assessed using both Pearson’s (r) and Spearman’s (ρ) coefficients. Correlations between biomarkers and cognitive tests, which were not normally distributed, were calculated using Spearman rank tests (ρ). The difference in strength between two correlations was tested using methods described in Diedenhofen et al.27 ROC analyses were used to determine diagnostic accuracy. AUCs were computed from binary logistic regression adjusted for covariates (sex and age for all models; adding CDRsb or time between blood test and death when relevant, see above) and the predicted values were used for ROC analyses. Difference between AUC values was tested with the Delong test.28 Cut-off values maximizing Youden indices were used for sensitivity and specificity.29 Statistical analyses were performed using SPSS (version 26; SPSS/IBM, Chicago, IL) and R (version 3.6.1, packages: Cocor and pROC).
Role of funder/sponsor:
The funding agencies had no role in the design and conduct of the study, collection, management, analysis or interpretation of the data, preparation, review or approval of the manuscript or decision to submit the manuscript for publication.
Results
This clinical study included 593 participants from two cohorts; 443 from the University of California San Francisco (UCSF) Memory and Aging Center, and 150 from the Advancing Research and Treatment for Frontotemporal Lobar Degeneration (ARTFL) consortium. The selected cohort included 118 normal controls (NC, detailed in eTable 4) and a broad range of neurodegenerative syndromes: 75 patients in the clinical AD spectrum (58 ADclin,30 15 logopenic variant primary progressive aphasia, [lvPPA] and 2 posterior cortical atrophy, [PCA]), 99 MCI patients31, and 274 individuals with clinical diagnoses in the FTLD spectrum (79 CBS32, 74 progressive supranuclear palsy [PSP],33 62 behavioral variant FTD [bvFTD],34 32 nonfluent variant PPA [nfvPPA], and 27 semantic variant PPA [svPPA]35). In addition, 14 participants with DLB and 13 participants with Traumatic Encephalopathy syndrome (TES) were included (Table 1). Eighty-five percent (n=507) of participants were white, and 294 (49.6%) were females. Eighty-three participants had a pathology-confirmed diagnosis, 15 AD, 52 FTLD-TAU, and 16 FTLD-TDP (detailed in eTable 5). The average time between blood draw and death was 33±19 months. The participants with an FTLD clinical diagnosis included 77 carriers of FTLD-causing mutations: 44 microtubule-associated protein tau (MAPT) associated with FTLD-tau, 13 progranulin (GRN) and 20 chromosome 20 open reading frame (C9orf72), associated with FTLD-TDP. The MAPT group included 11 individuals with mutations that produce 3R/4R tau (6 V337M and 5 R406W), and 33 with mutations that produce 4R tau (20 P301L, 7 N279K, 6 IVS10+16C>T).36 Amyloid-PET imaging was available for 360 participants; average time from plasma collection: 5±16 months. Tau-PET was available for 230 participants; average time from plasma collection: 1.6±7 months. MRI was available for 535 participants: average time from plasma collection: 1.7±8 months.
Table 1.
Participant characteristics.
| NC (n=118) | MCI (n=99) | ADclin (n=58) | lvPPA (n=15) | PCA (n=2) | CBS (n=79) | PSP (n=74) | bvFTD (n=62) | nfvPPA (n=32) | svPPA (n=27) | DLB (n=14) | TES (n=13) | All (n=593) | |
|---|---|---|---|---|---|---|---|---|---|---|---|---|---|
| Sex, M/F | 55/63 | 55/44 | 25/33 | 7/8 | 0/2 | 36/43 | 34/40 | 37/25 | 17/15 | 11/16 | 9/5 | 13/0 | 299/294 |
| Age, y | 60.9 (18) | 65.5 (13) | 65.3 (10) | 63.1 (9) | 57.6 (11) | 67.3 (8)a | 68.5 (7)a | 61.2 (10) | 69.8 (7)a | 70.0 (7)a | 69.3 (6) | 63.2 (13) | 64.3 (13) |
| APOE E4 positivity N/total N (%) | 31/109 (28%) | 31/92 (34%) | 37/58 (64%) | 7/14 (50%) | 2/2 (0%) | 11/42 (26%) | 11/53 (21%) | 7/40 (18%) | 5/28 (18%) | 8/27 (30%) | 4/13 (31%) | 3/13 (23%) | 155/491 (32%) |
| Disease severity | |||||||||||||
| CDR sum of boxes | 0 (0)b,c | 2 (1)a,c | 6 (3)a,b | 3 (2)a | 2 (0) | 4 (3)a,b,c | 4 (3)a,b | 7 (4)a,b | 3 (3)a,c | 6 (3)a,b | 5 (2)a,b | 4 (2)a | 3 (3) |
| N | 113 | 47 | 58 | 15 | 2 | 79 | 70 | 62 | 31 | 27 | 13 | 13 | 582 |
| SEADL, % | 100 (1) | 89 (18) | 73 (21) | 78 (13) | - | 55 (24)a,b | 49 (26)a,b | 50 (24)a,b | 67 (25)a | 58 (19)a,b | 55 (7) | - | 65 (29) |
| N | 55 | 20 | 3 | 4 | - | 65 | 64 | 48 | 22 | 17 | 2 | - | 300 |
| FAQ | 0 (0)b | 5 (4)a | 16 (8)a,b | 10 (7)a | 9 (8) | 12 (7)a,b | 14 (6)a,b | 18 (7)a,b | 11 (7)a | 16.0 (8)a,b | 15 (7)a,b | 10 (7)a | 10 (9) |
| N | 83 | 85 | 56 | 14 | 2 | 42 | 49 | 37 | 11 | 27 | 14 | 13 | 433 |
| GDS | 3 (3) | 8 (10) | 8 (5) | 14 (23)a | 4 (1) | 9 (11)a | 10 (7)a | 9 (17) | 13 (26)a | 7 (4) | 9 (7) | 10 (9) | 8 (11) |
| N | 103 | 87 | 49 | 13 | 2 | 65 | 60 | 52 | 20 | 17 | 8 | 10 | 486 |
| Neuropsychology | |||||||||||||
| MMSE | 29 (1)c | 27 (2)c | 19 (7)a,b | 22 (6)a,b | 25 (1) | 23 (6)a,b,c | 25 (4)a,c | 22 (8)a,b | 22 (6)a | 20 (8)a,b | 24 (2)c | 24 (7)a | 24 (6) |
| N | 82 | 86 | 54 | 14 | 2 | 40 | 49 | 37 | 11 | 27 | 13 | 12 | 427 |
| Imaging | |||||||||||||
| Total intracranial volume, L | 1.5 (0.2) | 1.5 (0.2) | 1.5 (0.2) | 1.5 (0.2) | 1.4 (0) | 1.5 (0.2) | 1.5 (0.2) | 1.5 (0.2) | 1.5 (0.2) | 1.5 (0.2) | 1.6 (0.2) | 1.7 (0.1)a,b,c | 1.5(0.2) |
| N | 118 | 87 | 55 | 15 | 2 | 68 | 65 | 51 | 31 | 26 | 7 | 11 | 536 |
| Bilateral hippocampal volume, mm3* | 5668 (606)b,c | 5292 (825)a,c | 4834 (698)a,b | 5014 (688)a | 5385 (478) | 5330 (717)a,c | 5287 (608)a,c | 4816 (763)a,b | 5341 (635)c | 4166 (760)a,b,c | 5802 (483)c | 5349 (1114)a | 5235 (793) |
| N | 118 | 87 | 55 | 15 | 2 | 68 | 65 | 51 | 31 | 26 | 7 | 11 | 536 |
| Amyloid-PET read, neg/pos (%positive) | 53/11 (17%) | 44/29 (40%) | 0/54 (100%) | 0/14 (100%) | 0/2 (100%) | 33/17 (34%) | 24/3 (11%) | 23/3 (12%) | 19/5 (21%) | 8/2 (20%) | 2/1 (33%) | 8/5 (38%) | 214/146 (41%) |
| N | 64 | 73 | 54 | 14 | 2 | 50 | 27 | 26 | 24 | 10 | 3 | 13 | 360 |
| FTP-PET temporal meta ROI SUVR | 1.1 (0.1)c | 1.4 (0.3)c | 2.0 (0.4)a,b | 2.3 (0.4)a,b | - | 1.4 (0.4)c | 1.2 (0.1)c | 1.2 (0.1)c | 1.1 (0.1)c | 1.7 (0.5) | 1.7 | 1.3 (0.4) | 1.5 (0.5) |
| N | 8 | 46 | 50 | 15 | - | 34 | 24 | 19 | 21 | 3 | 1 | 9 | 230 |
| FTP-PET temporal meta ROI neg/pos(%positive) | 8/0 (0%) | 23/23 (50%) | 0/50 (100%) | 0/15 (100%) | - | 24/10 (29%) | 21/3 (13%) | 16/3 (16%) | 18/3 (14%) | 1/2 (67%) | 0/1 (100%) | 7/2 (22%) | 118/112 (49%) |
| N | 8 | 46 | 50 | 15 | - | 34 | 24 | 19 | 21 | 3 | 1 | 9 | 230 |
| Fluid biomarkers | |||||||||||||
| Plasma P-tau217, pg/mL** | 0.17 (0.1)b,c | 0.29 (0.3)a,c | 0.72 (0.4)a,b | 0.82 (0.2)a,b | 0.80 (0.3) | 0.27 (0.3)c | 0.17 (0.1)c | 0.20 (0.2)c | 0.15 (0.1)c | 0.23 (0.4)c | 0.18 (0.1)c | 0.25 (0.2) | 0.28 (0.3) |
| N | 118 | 99 | 58 | 15 | 2 | 79 | 74 | 62 | 32 | 27 | 14 | 13 | 593 |
| Plasma P-tau181, pg/mL** | 0.9 (1)b,c | 1.2 (1)a,c | 2.3 (1)a,b | 2.5 (1)a,b | 2.8 (1) | 1.1 (1)c | 1.0 (1)c | 1.0 (1)c | 0.7 (0)c | 1.1 (1)c | 1.0 (0)c | 1.0 (0) | 1.2 (1) |
| N | 118 | 99 | 58 | 15 | 2 | 79 | 74 | 62 | 32 | 27 | 14 | 13 | 593 |
| Plasma NfL, pg/mL** | 20.3 (26) | 19.3 (13) | 24.2 (12) | - | - | 51.2 (26)a,b,c | 41.4 (24)a,b | 55.9 (45)a,b,c | 46.4 (27)a | 59.9 (29)a,b,c | - | - | 34.3 (30) |
| N | 73 | 37 | 28 | - | - | 34 | 50 | 28 | 10 | 8 | - | - | 268 |
| CSF P-tau181, pg/mL** | 20.9 (8)b,c | 28.7 (12)a | 39.9 (18)a | - | - | 22.5 (15)c | 14.5 (5)b,c | 20.2 (11)b,c | 24.1 (7)c | 16.8 (3) | - | - | 23.4 (13) |
| N | 48 | 23 | 24 | - | - | 36 | 30 | 28 | 8 | 2 | - | - | 199 |
Values shown as mean (standard deviation). Abbreviations: ADclin, Clinical Alzheimer’s disease; APOE, apolipoprotein E; BNT, Boston Naming Test; bvFTD, behavioral variant FTD; CDR, Clinical Dementia Rating; CBD, corticobasal degeneration; FAQ, Functional Activities Questionnaire ; FTP-PET, 18F-Flortaucipir; GDS, Geriatric depression scale; MCI, mild cognitive impairment; MMSE, Mini-Mental State Test; NfL, neurofilament light chain; NC, Normal control; SEADL, Schwab and England Activities of Daily Living; SUVR, Standardized Uptake Value Ratio; PET, positron emission tomography; P-tau, phosphorylated tau; PPA, primary progressive aphasia; PSP, progressive supranuclear palsy; TES, traumatic encephalopathy syndrome. Amyloid status was based on visual read.
ANCOVA corrected for TIV,
ANCOVA corrected for age and sex
Indicates a statistically significant difference between groups (p < 0.05) with NC in ANCOVA with post hoc pairwise comparisons (Bonferroni)
p < 0.05 vs MCI
p < 0.05 vs ADclin
There was no correlation between age and P-tau217 (r=−0.02, p=0.61) or P-tau181 (r=0.04, p=0.37) and no difference between male (P-tau217: 0.26±0.3 pg/mL; P-tau181: 1.2±1 pg/mL) and female participants (P-tau217:0.31±0.4 pg/mL, p=0.98; P-tau181: 1.2±1 pg/mL, p=0.94). P-tau217 and P-tau181 concentrations were correlated (r=0.90, p<0·0001, eFigure 1). Both P-tau217 and P-tau181 were increased in the clinical AD-spectrum (ADclin+lvPPA+PCA) compared to all other diagnostic groups (Figure 1). P-tau217 concentrations were 4.4-fold higher in patients in the clinical AD-spectrum (0.74±0.4 pg/mL, n=75) compared to controls (0.17±0.2 pg/mL, n=118, η2p=0.69, p<0·0001). P-tau181 concentrations were 2.8-fold higher in the clinical AD-spectrum (2.4±1 pg/mL, n=75) compared to controls (0.87±1 pg/mL, n=118, η2p=0.60, p<0·0001). The AUCs for AD versus controls were comparable for P-tau217 (AUC=0.98, p<0·0001) and P-tau181 (AUC=0.97, p<0·0001, DeLong test for difference in AUC accuracy p=0.31, eTable 6).
Figure 1. P-tau217 and P-tau181 concentrations per clinical diagnosis.
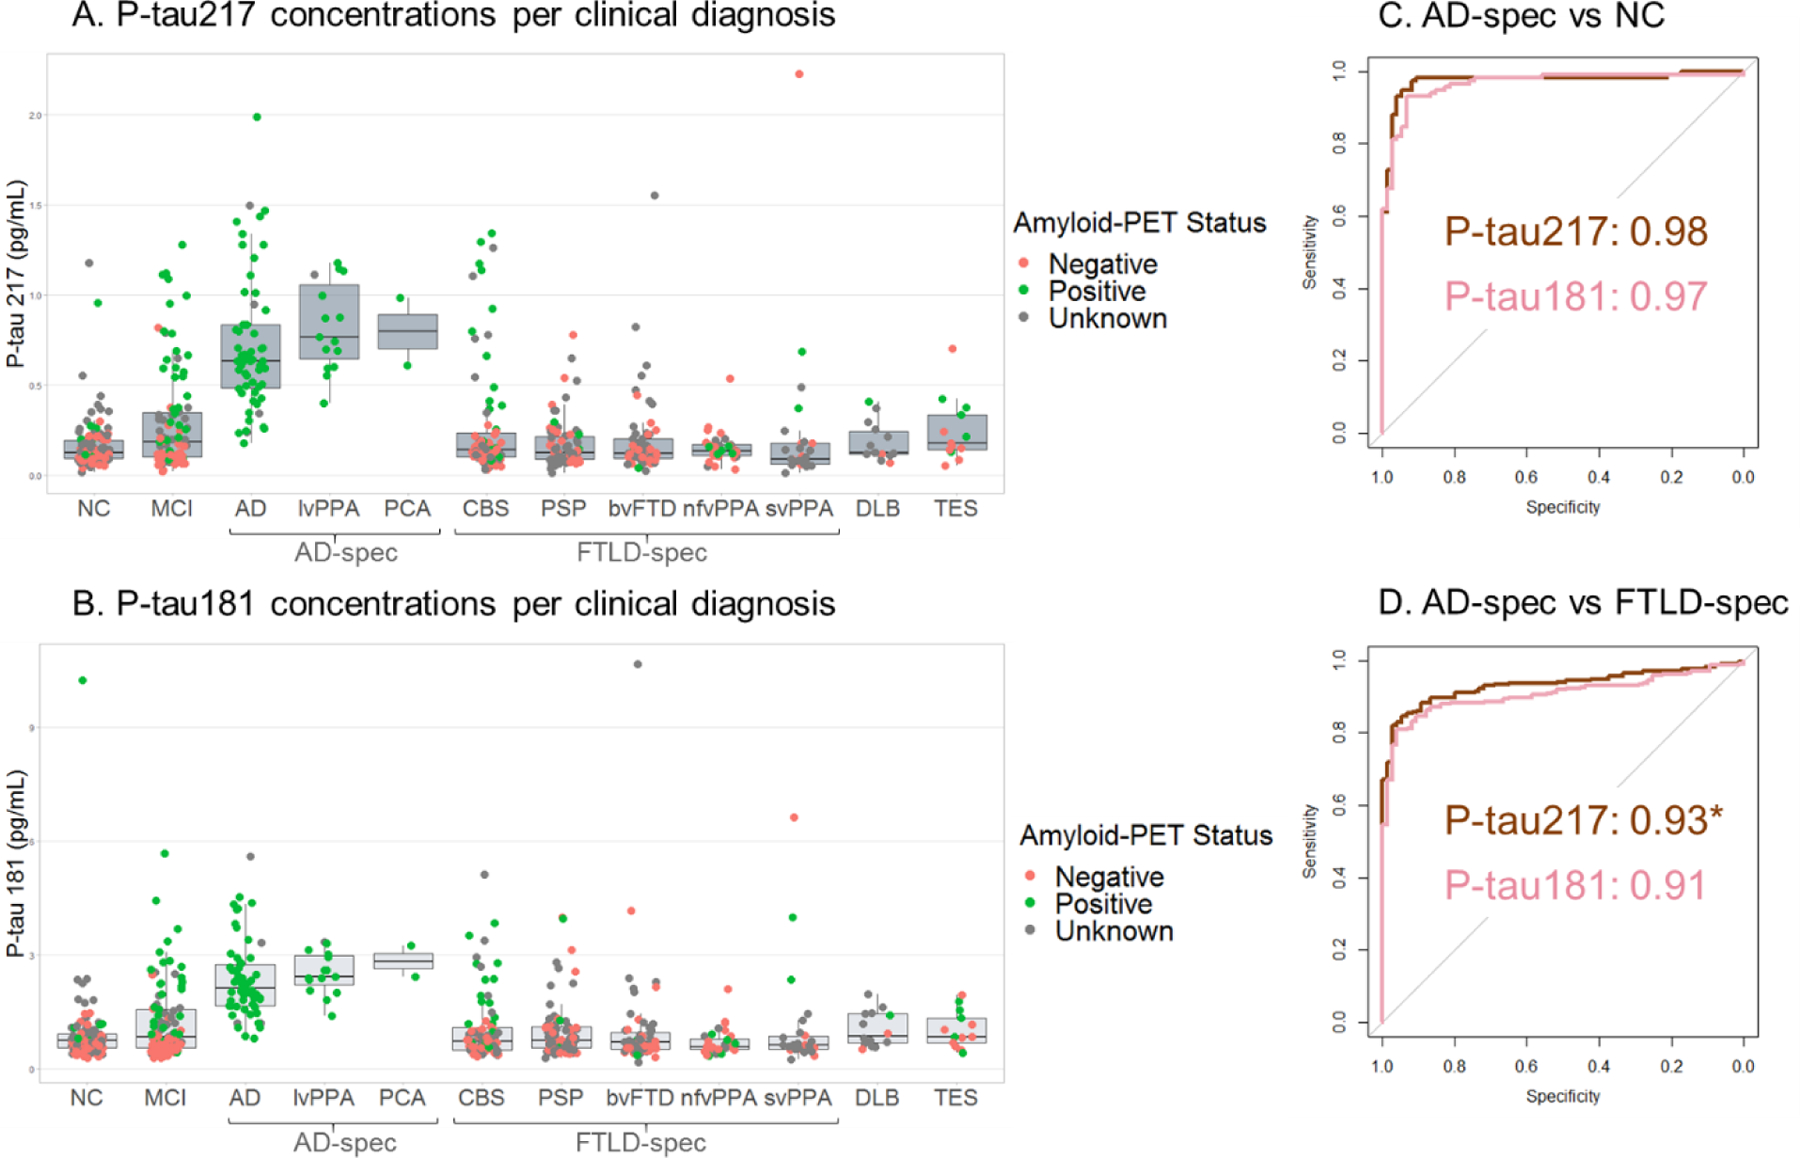
A. P-tau217 was increased in the AD spectrum compared to all other diagnoses. B. P-tau18 was increased in the AD-spectrum compared to all other diagnoses. C. ROC curve analyses of the differentiation between the patients in the AD-spectrum and the normal controls. Brown represents P-tau217, pink represents P-tau181. D. ROC curve analyses of the differentiation between the patients in the AD-spectrum and patients in the FTLD-spectrum. Brown represents P-tau217, pink represents P-tau181. *Significant difference in AUC. For visualization, raw biomarker concentrations were used.
P-tau217 concentrations were increased 3.5-fold in the clinical AD-spectrum compared to the clinical FTLD-spectrum (CBS+PSP+bvFTD+nfvPPA+svPPA) (0.21±0.3 pg/mL, n=274, η2p=0.42, p<0·0001). P-tau181 was 2.4-fold higher in the clinical AD-spectrum compared to the clinical FTLD-spectrum (1.0±1 pg/mL, n=274, η2p=0.36, p<0·0001). Results were unchanged when adding CDRsb as a covariate in the ANCOVA (η2p=0.42 for P-tau217 and η2p=0.36 for P-tau181; with 5 missing values in the FTLD group). The AUC for AD versus FTLD for P-tau217 (0.93, p<0·0001) was higher than for P-tau181 (AUC=0.91, p<0·0001, DeLong test p=0.007, eTable 6). The outliers in the FTLD groups are discussed in the eResults.
Both P-tau217 and P-tau181 concentrations were associated with AD neuropathology in autopsy-confirmed participants. P-tau217 concentrations varied across neuropathological groups (η2p=0.41, p<0·0001); pairwise comparisons showed that P-tau217 concentration were 4.1-fold higher in ADpath (0.62±0.4 pg/mL, n=15) compared to FTLD-tau (0.15±0.1 pg/mL, n=52, AUC=0.96 p<0·0001) and 5.6-fold compared to FTLD-TDP (0.11±0.04 pg/mL, n=16, AUC=0.98, p<0·0001) (Figure 2A, eTable 6). No difference was observed between FTLD-tau and FTLD-TDP (p=0.39). P-tau217 was associated with Thal phase (η2p=0.60, p<0·0001), Braak stage (η2p=0.57, p<0·0001), and neuritic plaque CERAD score (η2p=0.49, p<0·0001). Post-hoc comparisons (eFigures 2–5) showed that Ptau217 values were significantly increased at Thal phases 4–5, Braak stages V-VI, and CERAD frequent scores (eFigure 2–5). P-tau181 concentrations also varied across neuropathological diagnoses (η2p=0.38, p<0·0001) and were 2.8-fold higher in ADpath (2.2±1 pg/mL, n=15) compared to FTLD-tau (0.8±0.5 pg/mL, n=52, AUC=0.90, p<0·0001) and 3.7-fold compared to FTLD-TDP (0.6±0.1 pg/mL, n=16, AUC=0.95, p<0·0001) (Figure 2B, eTable 6). No difference was observed between FTLD-tau and FTLD-TDP (p=0.14). P-tau181 was associated with Thal phase (η2p=0.55, p<0·0001), Braak stage (η2p=0.52, p<0·0001), and CERAD score (η2p=0.42, p<0·0001); see eFigures 2–5 for post-hoc analyses. The AUC for the differentiation between AD and FTLD (FTLD-tau+FTLD-TDP) was 0.96 for P-tau217 and 0.91 for P-tau181 (Figure 2C); Delong test: p=0.22, (eTable6).
Figure 2. P-tau217 and P-tau181 concentrations per pathology confirmed diagnosis and MAPT genotype.
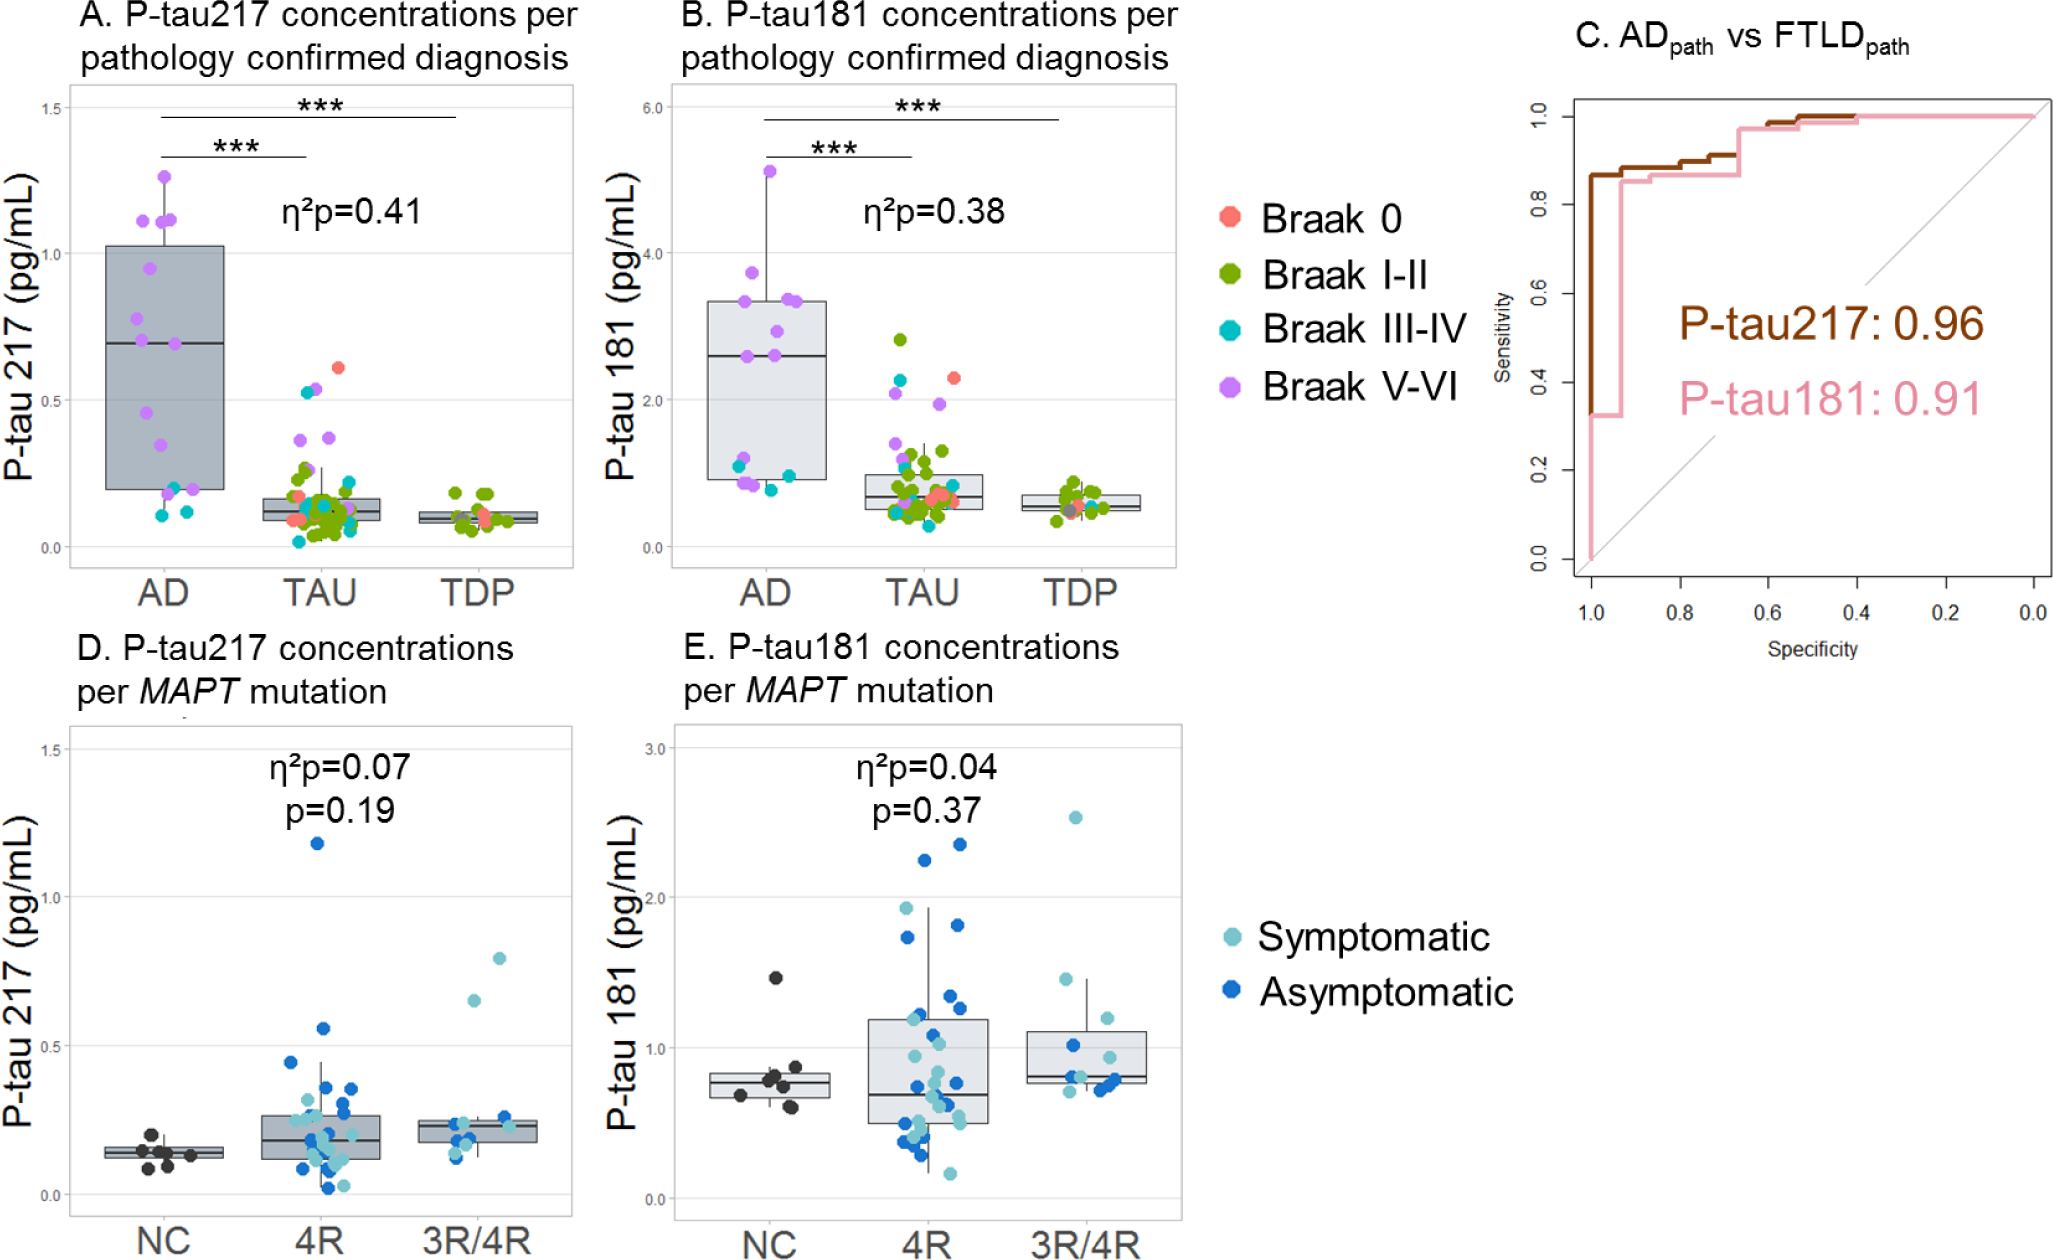
A. P-tau217 was increased in the pathology confirmed AD group compared to the FTLD-TDP and FTLD-tau groups. B. P-tau181 was increased in the pathology confirmed AD group compared to the FTLD-TDP and FTLD-tau groups. C. ROC curve analyses of the differentiation between the pathology-confirmed AD and FTLD-tau combined with the FTLD-TDP participants. Brown represents P-tau217, pink represents P-tau181. D. There was no difference in P-tau217 concentrations between 4R (n=33, 58% female, mean age=41.8), 3R/4R (n=11, 45% female, mean age=45.3) MAPT and age and sex matched amyloid-PET-negative controls (n=8, 50% female, mean age=50.7). E. There was no difference in P-tau181 concentrations between 4R, 3R/4R MAPT and age and sex matched controls. Three of the five MAPT mutation carriers with the highest P-tau values (P-tau217>0.5 pg/mL or P-tau181>2.0 pg/mL) had a known CSF P-tau concentration which was also high (>30 pg/mL).***p<0·0001, adjusted for sex, age, CDRsb (and time between plasma sample and death for pathology-confirmed participants). For visualization, raw biomarker concentrations were used, although natural log transformed data were used for ANCOVA.
Seventy-seven individuals had an FTLD-causing mutation. There was no difference in P-tau217 or P-tau181 concentrations between MAPT, GRN, or C9orf72 mutation carriers or between the mutation carrier groups and normal controls (P-tau217: η2p=0.03, p=0.30; P-tau181: η2p=0.01, p=0.66). When studying the MAPT mutation carriers in details, there was no difference in P-tau217 or P-tau181 concentrations between age- and sex-matched amyloid-PET negative NC (P-tau217:0.14±0.04 pg/mL, P-tau181:0.82±0.3 pg/mL, n=8), 4R (P-tau217: 0.23±0.21 pg/mL, P-tau181: 0.9±0.6 pg/mL, n=33), or AD-like 3R/4R tau pathology mutation carriers (P-tau217: 0.29±0.2, η2p=0.07, p=0.19; P-tau181: 1.1±0.5, η2p=0.04, p=0.37, n=11). Since these results differed from our previous finding of increased plasma P-tau181 concentrations in 3R/4R mutation carriers,6 we directly compared the results from 39 MAPT individuals who were measured with both the previous assay and the new P-tau181 assay designed to be more comparable to the P-tau217 assay. P-tau181 concentrations with both assays did not correlate in MAPT mutation carriers (r=−0.02, p=0.99), even though the old and new P-tau181 concentrations were correlated in the whole cohort (r=0.69, p<0·0001, eFigure 6).
Both P-tau217 and P-tau181 showed similar Spearman rank-order correlation coefficients with MMSE, CDRsb, functional activities questionnaire (FAQ), modified Rey figure recall, trail making test, Stroop color-naming, semantic fluency, and D-word fluency in the whole cohort (range absolute ρ: 0.133–0.393, eTable 7). In the AD-spectrum subgroup, P-tau217 remained associated with MMSE, CDRsb, FAQ, trail making test, semantic fluency and D-word fluency (range absolute ρ:0.247–0.470), whereas P-tau181 was only significant associated with MMSE (ρ=−0.347, p=0.003, see eTable7 for details). Correlations should be interpreted with caution as they were globally weak (ρ<0.5) and only significant when not correcting for multiple tests.
There was no correlation between plasma NfL and P-tau217 (r=−0.07, p=0.25) or P-tau181 (r=−0.013, p=0.83, n=268) in the whole sample, nor in the AD-spectrum (P-tau217: r=0.013, p=0.95; P-tau181: r=0.20, p=0.30, n=28). Plasma NfL was inferior to either plasma P-tau in diagnostic accuracy (eTable 6). CSF P-tau181 (n=199) was correlated with plasma P-tau217 (r=0.60, p<0·0001) and P-tau181 (r=0.50, p<0·0001), even though the CSF and plasma samples were not measured with the same assay. CSF P-tau181 showed similar accuracy to plasma P-tau217 (eTable 6).
Both plasma P-tau217 and P-tau181 were associated with amyloid-PET positivity. P-tau217 was 3.9-fold higher in amyloid-PET-positive (0.58±0.4 pg/mL, n=146) compared to amyloid-PET-negative participants (0.15±0.2 pg/mL, n=214, η2p=0.49, p<0·0001, controlling for age and sex Figure 3A and C). P-tau181 was 2.5-fold higher in amyloid-PET-positive (2.0±1 pg/mL, n=146, Figure 3B and C) compared to amyloid-PET-negative participants (0.8±0.6 pg/mL, n=214, η2p=0.44, p<0·0001). Group differences were unchanged when including CDRsb as a covariate in the ANCOVA (η2p=0.47 for P-tau217 and η2p=0.42 for P-tau181; with 5 missing values in the amyloid-negative group). P-tau217 differentiated amyloid-PET positive from negative individuals with a ROC AUC of 0.91, which was slightly higher than the differentiating accuracy of P-tau181 (AUC=0.89, Delong test p=0.049, Figure 3C, eTable 6). We assessed whether P-tau217 and P-tau181 could predict amyloid-PET positivity within clinical diagnoses of MCI, CBS, DLB, or controls, as underlying AD pathology is common in these groups.2–4,37 Amyloid-PET positivity was found in 40% of patients with (AUC = 0.93 for P-tau217 and 0.92 for P-tau181, both p<0·0001, n=73), in 34% of patients with CBS (AUC = 0.90 for both P-tau217 and P-tau181, both p<0·0001, n=50), and in 17% of controls (AUC of 0.83 for P-tau217 and 0.85 for P-tau181, both p≤0.001, n=64, eTable 6, eFigure 7). There was no significant difference in AUC between the two plasma biomarkers for these subgroups (all p’s>0.62, eTable 6). Amyloid-PET status was only available of 3 DLB patients, preventing any statistical analyses.
Figure 3. Association between P-tau217, P-tau181, amyloid-PET and tau-PET.
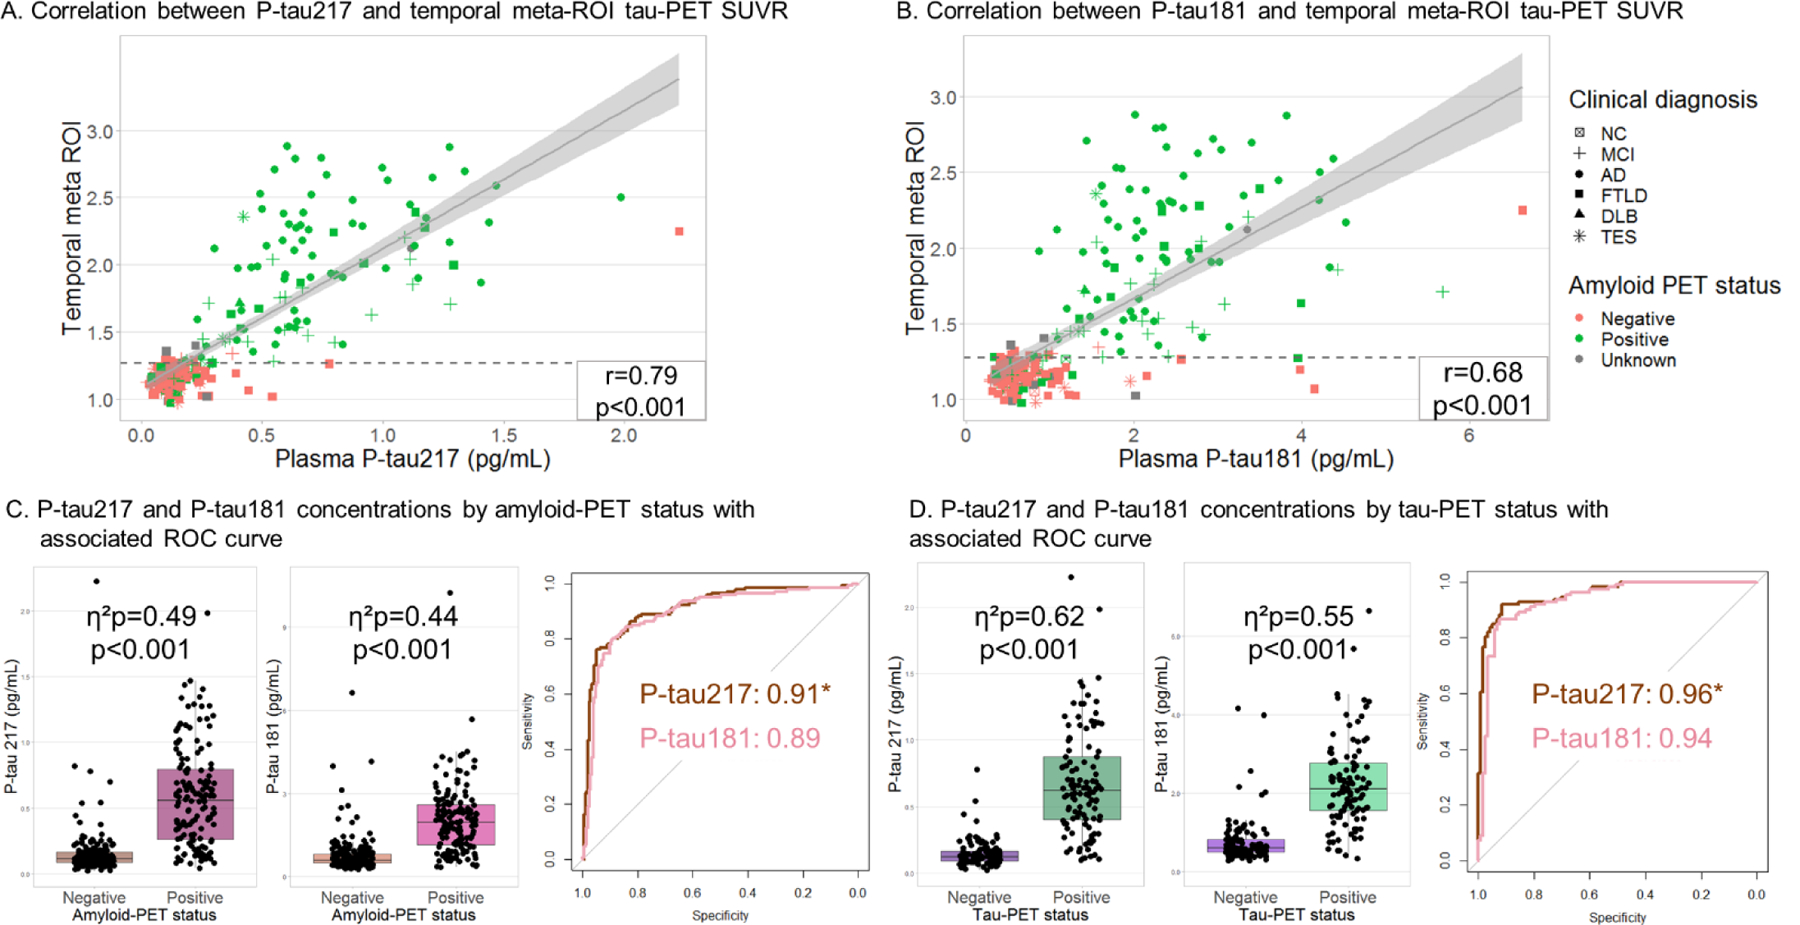
A. The correlation between plasma P-tau217 and temporal tau-PET SUVR, shapes show clinical diagnosis and color shows amyloid-PET status. The dotted line is the cut-off value for tau-PET positivity of 1.27 SUVR. Correlation coefficient indicates Pearson’s correlation on raw plasma and PET values, but correlation strength was not impacted by log-transformation of P-tau217 values (r=0.80) or using rank correlation (Spearman ρ=0.79). B. The correlation between plasma P-tau181 and temporal tau-PET SUVR. Correlation strength was little impacted by log-transformation of P-tau181 (r=0.72) or rank correlation (Spearman ρ=0.72). C. Differentiation between amyloid-PET-positive and -negative, by boxplot and ROC AUC. Brown represents P-tau217, pink represents P-tau181. D. Differentiation between tau-PET-positive and -negative, by boxplot and ROC AUC. Brown represents P-tau217, pink represents P-tau181. *Significant difference in AUC, adjusted for sex, age. For visualization, raw biomarker concentrations were used, although natural log transformed data were used for ANCOVA.
Plasma P-tau217 was more strongly correlated with temporal tau-PET binding (combining bilateral entorhinal, amygdala, fusiform, inferior and middle temporal cortices)1 than P-tau181 (r=0.80 vs r=0.72 using log-transformed P-tau values, both p<0·0001, n=230, Δr=0.08, 95%CI=[0.057–0.106], p<0·0001, Figure 3A–B). The correlation in the amyloid-PET-positive group (n=117) was r=0.73, p<0·0001 for P-tau217 and r=0.61, p<0·0001 for P-tau181 (Δr= 0.12, 95%CI=[0.067–0.198], p<0·0001). In the amyloid-PET-negative group (n=104) temporal tau-PET binding was not correlated with P-tau217 (r=0.14, p=0.17) or P-tau181 (r=0.07, p=0.46); note that for this subgroup analysis, one amyloid-PET negative participant with high P-tau217 and P-tau181 concentrations was excluded since it was a clear outlier on both PET and plasma variables (right-most data point included in figure 3A–B).
When binarizing temporal tau-PET values into positive and negative groups, P-tau217 concentrations were 4.5-fold higher in tau-PET-positive (0.68±0.4 pg/mL, n=112) compared to tau-PET-negative participants (0.15±0.1 pg/mL, n=118, η2p=0.62, p<0·0001, controlling for age and sex). P-tau181 concentrations were 2.9-fold higher in tau-PET-positive (2.2±1 pg/mL, n=112) compared to tau-PET-negative participants (0.76±0.6 pg/mL, n=118, η2p=0.55, p<0·0001). Group differences were unchanged when including CDRsb as a covariate in the ANCOVA (η2p=0.60 for P-tau217 and η2p=0.53 for P-tau181; with 1 missing value in the tau-PET-negative group). P-tau217 differentiated between tau-PET-positive and -negative with an AUC of 0.96, which was slightly higher than P-tau181 (AUC=0.94, Delong test: p=0.03, Figure 3D, eTable 6). P-tau217 and P-tau181 could also differentiate between tau-PET-positive and -negative participants within subgroups with a clinical diagnosis of MCI and CBS (all AUC’s ≥0.88), with no significant difference in discriminability between the two plasma markers (eFigure 8, eTable 6). 46 MCI patients had both tau-PET and amyloid-PET. Nineteen of those were amyloid-PET and tau-PET negative (A−T−), four were A+T−, two were A−T+, and 21 were A+T+. The P-tau217 and P-tau181 concentrations seemed increased in A+T+ MCI patients, compared to A−T− MCI patients, and to A+T− MCI patients, though sample sizes were too small to perform accurate statistical analyses (eFigure 9).
A small number of participants (n=55) had plasma biomarkers, tau-PET and CSF P-tau181; correlations in this subgroup are available in eTable8
In the whole tau-PET sample, plasma P-tau concentrations were associated with tau-PET throughout the cortex, with strongest correlations in temporoparietal and lateral frontal areas (Figure 4). The correlation was most pronounced for P-tau217, with correlation coefficients of up to 0.81 compared to 0.70 for P-tau181, both peaking in the right middle temporal lobe. There was no significant association between P-tau concentration and tau-PET in amyloid-PET-negative participants, after excluding one amyloid-PET-negative outlier described above. In contrast, tau-PET-plasma associations were significant in the amyloid-PET-positive group, with correlation coefficients up to 0.74 for P-tau217 and 0.59 for P-tau181 (eFigure 10). The pattern of voxelwise correlations was very similar in patients with a clinical diagnosis of MCI, and even stronger in CBS, with correlations exceeding r=0.9 in frontal, parietal, and temporal areas.
Figure 4. Voxelwise correlation between plasma P-tau217, P-tau181 and Tau-PET tracer binding or grey matter volume.

The density plots on top of the color bars show the distribution of Pearson’s r values across all voxels included in the GM cortex mask. The pink lines in the color bar indicate p<0·0001 at the voxel level for tau-PET, green lines in the color bar indicate p<0·0001 for grey matter atrophy, and correspond to various r values depending on each subsample size. The voxelwise correlation brain maps are available on Neurovault: https://neurovault.org/collections/SDXLLPNR/
Higher plasma P-tau concentration was associated with lower GM volume in a pattern that resembled, but was more restricted than the pattern seen with tau-PET (Figure 4, eFigure 10). In the whole cohort, the association was maximal in temporoparietal areas, with correlation coefficients reaching −0.36 for P-tau217 and −0.33 for P-tau181. Strong associations between plasma P-tau markers and temporo-parietal volume were seen in amyloid-PET-positive participants and patients with clinical diagnoses of MCI or CBS, but not in the amyloid-PET negative subgroup.
Discussion
We compared the diagnostic performance of plasma P-tau217 with a novel P-tau181 assay, designed to match the assay characteristics of the P-tau217 assay, in a large cohort of patients with various neurodegenerative diseases. Both plasma biomarkers could distinguish AD from non-AD disorders defined either clinically or neuropathologically with high accuracy (AUC’s>0.90), and both were associated with in vivo presence of amyloid and tau pathology as measured with PET. Higher P-tau concentrations were also associated with greater brain atrophy measured on MRI scans in brain regions typically affected by AD pathology, and with cognitive impairment. Across multiple contrasts of interest, plasma P-tau217 tended to perform slightly better than P-tau181: the diagnostic accuracy of P-tau217 as measured with the AUC curve was higher for differentiation of clinical AD vs clinical FTLD, amyloid-PET-positive vs -negative participants, and tau-PET-positive vs -negative participants, although the magnitudes of the performance differences were small (ΔAUC<0.02).
The data collected from this cohort including both primary (FTLD-tau) and secondary tauopathies (AD) support the use of either plasma P-tau217 or P-tau181 as screening tools to help target therapies to individuals with underlying AD tau pathology. Both P-tau217 and P-tau181 were associated with amyloid and tau-PET biomarkers of AD in patients with clinical MCI or CBS diagnoses (AUCs for both ≥0.88). Voxelwise analyses showed strong associations between both plasma P-tau species and tau-PET binding in regions affected by AD pathology in MCI and CBS patients. This study and studies by us and others showed that plasma P-tau has better diagnostic accuracy for AD than plasma NfL6,7,9 and similar to CSF P-tau181.7,9 Our data suggest that plasma P-tau may be a particularly useful biomarker to screen MCI or CBS patients for underlying AD-pathology to allow them to participate in clinical trials of AD-tau-targeted therapies, or exclude them from trials targeting non-AD-tau pathology. Indeed, recent studies demonstrated that plasma P-tau217 increased longitudinally in preclinical AD38 and that plasma P-tau217 or P-tau181 (combined with NfL) provided subject-level prognostic information about cognitive decline due to AD in MCI patients.10 Recently, a comprehensive study found that the most parsimonious model for predicting AD dementia in a heterogeneous population of individuals with SCD and MCI was a combination of plasma P-tau, APOE genotype and three brief cognitive tests of memory and executive function.11 Importantly, in that study the prognostic algorithm established in BioFINDER, using normalized plasma P-tau217 levels, could be cross-validated in ADNI, using normalized plasma P-tau181 levels, emphasizing the results from the present study that high-performing assays for P-tau217 and P-tau181 can be used interchangeably in clinical practice and trials.
Although CSF studies have suggested that P-tau217 might be an earlier marker of AD pathology than P-tau181,13 we found no significant difference between P-tau217 and P-tau181 in indicating amyloid- or tau-PET positivity in MCI patients, or in indicating amyloid-PET positivity in controls. In the whole cohort, P-tau217 was more strongly correlated with cognitive performance, a later occurring feature of AD. This lack of superiority for plasma compared to the CSF assays may be due to the difference in assay technology, a difference in cohort composition, or might be attributable to a high pass filter effect of the blood-brain barrier for P-tau217 fragments which could reduce the relative sensitivity of plasma compared to CSF measurements for detecting AD pathology.
In this study, we did not replicate the relative increase in plasma P-tau181 concentrations in 3R/4R tau producing compared to 4R tau producing MAPT mutation carriers that we found in our previous study.6 This likely reflected the use of a different P-tau181 assay with a different detector antibody and different sample buffer. Although the P-tau181 concentrations of these new and old assays were moderately correlated in the whole cohort, there was no correlation in MAPT carriers alone. One potential explanation for this difference is that the physicochemical properties of MAPT 3R/4R soluble tau species might differ from AD 3R/4R soluble tau species in sensitivity to the assay conditions. This difference could expose a binding region with more affinity for the capture antibody from the older assay.
To widely implement P-tau as a biomarker for AD, diagnostic cut-off values should be established. Arguably, clinically, the cut-off value that can help to estimate whether dementia syndromes are due to AD or FTLD might be most useful. For example, our pathology-confirmed cohort included three patients who had a clinical diagnosis of CBS but had AD pathology at autopsy. These patients had plasma P-tau217 and P-tau181 concentrations above the cut-off value for AD compared to FTLD. Assay validation in a larger, more diverse community with close attention to pre-analytic sample handling will be critical to determine widely applicable cut-off concentrations.
A strength of this study was its robust approach to comparing plasma P-tau217 and P-tau181, using matched immunochemical assays. This is most likely the reason why the difference in diagnostic accuracy was not as large as previously reported, since the previous study could be confounded by differences in the types of assays used that were unrelated to the targeted epitope, a limitation noted by the authors of the study.9 This is particularly an issue for immunoassays and less so for mass spectrometry studies.17 The cohort covered a broad range of neurodegenerative diseases, including FTLD cases with non-AD tau pathology of considerable sample sizes to AD, allowing us to demonstrate differential diagnostic performance similar to a recent study in a larger cohort.9
This study also had several limitations. The P-tau217 and P-tau181 concentrations were very low in the FTLD group, with 79 measurements <LLOQ for P-tau217. This indicates a floor effect that limits the dynamic range of the marker for the low concentrations. A relatively small number of patients in the AD spectrum was included in our cohort, since we focused on differential diagnosis. Further, our cohort was relatively young, and therefore provides little information on how plasma P-tau will perform in older age, when AD is more prevalent. However, in this cohort we found no correlation of plasma P-tau with age. Only three out of 13 DLB patients had amyloid-PET data and therefore we could not determine whether P-tau217 or 181 could successfully identify amyloid co-pathology in DLB. Another limitation was the lack of ethnic and socioeconomic diversity in our cohort, in contrast to a recently published multi-ethnic study with plasma P-tau.18
In conclusion, in this direct comparison of the diagnostic performance of plasma P-tau217 and P-tau181 we demonstrate that both markers have excellent diagnostic performance for AD. Although the fold difference in concentration between diagnostic groups were higher with P-tau217 than P-tau181, this did not translate to a clinically meaningful difference in diagnostic utility in our highly selected research population. Both plasma P-tau species can aid in evaluation of participants by identifying those with underlying AD tau pathology. Additional studies in larger and more diverse cohorts are needed to establish if differences between these biomarkers are clinically meaningful.
Supplementary Material
Research in context.
Evidence before this study:
We searched PubMed for all articles published up to June 1, 2021, with no language limitations. Keywords included: “plasma phosphorylated tau”, “CSF phosphorylated tau”, “tau-PET”, “amyloid-PET”, “MRI”, “MAPT mutation carriers, “Alzheimer’s disease”, “Alzheimer’s pathology”, and “frontotemporal lobar degeneration”. CSF P-tau181 is one of the core biomarkers incorporated into the NIA-AA Research Framework to define Alzheimer’s disease. Recent studies suggested that CSF p-tau217 is consistently more strongly related to the AD pathological process and might be more useful than P-tau181. To make testing for AD-pathology more widely accessible, assays were developed that are sensitive enough to measure P-tau in blood. Previous cross-sectional and longitudinal studies covering the clinical Alzheimer’s disease continuum have indicated the value of plasma P-tau217 and P-tau181 for differentiation of clinical and pathology-confirmed AD, and differentiation of amyloid-PET or tau-PET-positive participants from amyloid-PET or tau-PET negative participants. One study using immunoassays showed that P-tau217 was significantly better than P-tau181 when differentiating AD dementia to other dementias, however there were important technical differences between the P-tau217 and P-tau181 assays used. Further, a mass spectrometry-based study has shown better separation between amyloid-PET positive and negative cases using P-tau217 compared to P-tau181
Added value of this study:
This study provides a direct comparison between two plasma P-tau assays for measuring P-tau217 or P-tau181 in a broad range of diagnostic and correlative neuroimaging analyses. The assay conditions were optimized to ensure that the immunochemical properties of the P-tau217 and P-tau181 assays were directly comparable. Similar to previous work, both P-tau217 and P-tau181 were increased in AD clinical syndromes compared to healthy controls and a spectrum of FTLD syndromes, Lewy body dementia and Traumatic Encephalopathy Syndrome (TES) patients. Both P-tau species were also increased in pathology-confirmed AD compared to pathology-confirmed FTLD, but neither could differentiate between 3R/4R tau versus 4R tau producing microtubule-associated protein tau (MAPT) mutation carriers. Both P-tau species were increased in amyloid-PET-positive compared to amyloid-PET-negative participants, and in tau-PET-positive compared to tau-PET-negative participants and correlated with regional tracer uptake on the voxel level. In addition, both plasma P-tau measures strongly reflected underlying AD pathology in patients with clinical diagnoses of either mild cognitive impairment (MCI) or corticobasal syndrome (CBS), for which underlying AD pathology is a possible but uncertain etiology. We show that plasma P-tau217 is slightly superior to P-tau181 when differentiating AD dementia to other dementias and when correlating with amyloid- and tau-PET, but overall, both assays performed very well.
Implications of all the available evidence:
This study shows that consideration of assay characteristics is critical to understanding the relative performance and utility of plasma P-tau biomarkers. These data, together with other recent reports, suggest that both P-tau217 and P-tau181 are useful biomarkers of AD pathology. Plasma biomarkers are likely to be less expensive and more accessible than CSF or PET, allowing them to be more scalable and more easily deployed to medically underserved and remote populations. Plasma P-tau217 and P-tau181 are particularly powerful tools for differential diagnosis between AD and FTLD pathologies, which may further improve the ability to identify suitable participants for clinical trials and large-scale epidemiological studies.
Acknowledgements
Data collection and dissemination of the data presented in this manuscript was supported by the ALLFTD Consortium (U19: AG063911, funded by the National Institute on Aging and the National Institute of Neurological Diseases and Stroke) and the former ARTFL & LEFFTDS Consortia (ARTFL: U54 NS092089, funded by the National Institute of Neurological Diseases and Stroke and National Center for Advancing Translational Sciences; LEFFTDS: U01 AG045390, funded by the National Institute on Aging and the National Institute of Neurological Diseases and Stroke) as well as the NIA-funded UCSF AD Research Center (P30-AG062422) and program project grant on frontotemporal dementia (P01-AG019724).
Funding details
US National Institutes of Health (U19AG063911, U01AG045390, U54NS092089, R01AG038791, P01AG019724, U24AG21886, R01AG045611, P50AG023501, P50AG016574, K24AG053435; P30-AG062422, P01-AG019724, R01 AG045611, K99AG065501); State of California Department of Health Services (04-33516); Rainwater Charitable Foundation, Michael J Fox foundation, AFTD, Alzheimer’s Association (AARF-16-443577). Avid Radiopharmaceuticals enabled use of the [18F]flortaucipir tracer by providing precursor, but did not provide direct funding and was not involved in data analysis or interpretation. Plasma P-tau assay results were donated by Lilly Research laboratories. HZ is a Wallenberg Scholar supported by grants from the Swedish Research Council (#2018-02532), the European Research Council (#681712), Swedish State Support for Clinical Research (#ALFGBG-720931), the Alzheimer Drug Discovery Foundation (ADDF), USA (#201809-2016862), the European Union’s Horizon 2020 research and innovation programme under the Marie Skłodowska-Curie grant agreement No 860197 (MIRIADE), and the UK Dementia Research Institute at UCL.
Declaration of interests
E.H.T, R.L.J, A.S., L.I., L.V. declare no conflict of interest. J.L.D. and N.K.P are employees of Eli Lilly and Company who is exploring commercial development opportunities for P-tau assays. J.L.D. is listed as an inventor on a patent related to reagents used in the P-tau assays. HZ has served at scientific advisory boards for Denali, Roche Diagnostics, Wave, Samumed, Siemens Healthineers, Pinteon Therapeutics and CogRx, has given lectures in symposia sponsored by Fujirebio, Alzecure and Biogen, and is a co-founder of Brain Biomarker Solutions in Gothenburg AB (BBS), which is a part of the GU Ventures Incubator Program. OH has acquired research support (for the institution) from AVID Radiopharmaceuticals, Biogen, Eli Lilly, Eisai, GE Healthcare, Pfizer, and Roche. In the past 2 years, he has received consultancy/speaker fees from AC Immune, Alzpath, Biogen, Cerveau and Roche. K.B. served as a consultant, at advisory boards, or at data monitoring committees for Abcam, Axon, Biogen, JOMDD/Shimadzu. Julius Clinical, Lilly, MagQu, Novartis, Roche Diagnostics, and Siemens Healthineers, and is a co-founder of Brain Biomarker Solutions in Gothenburg AB (BBS), which is a part of the GU Ventures Incubator Program, all unrelated to the work presented in this paper. L.T.G. receives research support from Avid Radiopharmaceuticals, Eli Lilly. She has received consulting fees from the Simon Foundation and Cura Sen, Inc. She serves as associate editor for Frontiers in Aging Neurosciences, Frontiers in Dementia and the Journal of Alzheimer Disease. H.R. has received research support from Biogen Pharmaceuticals, has consulting agreements with Wave Neuroscience and Ionis Pharmaceuticals, and receives research support from NIH. B.F.B. receives research support from NIH, the Mangurian Foundation and the Little Family Foundation. He is on the Scientific Advisory Board for the Tau Consortium. He has received grant support for clinical trials from Biogen, Alector and EIP Pharma. G.D.R. receives research support from NIH, Alzheimer’s Association, American College of Radiology, Rainwater Charitable Foundation, Avid Radiopharmaceuticals, Eli Lilly, GE Healthcare, Life Molecular Imaging. He has served as a consultant for Eisai, Merck, Axon Neurosciences, Johnson & Johnson. He received speaking honoraria from GE Healthcare. He serves as Associate Editor for JAMA Neurology. J.C.R. is a site PI for clinical trials supported by Eli Lilly and receives support from NIH. A.L.B. receives research support from the NIH, the Rainwater Charitable Foundation, the Association for Frontotemporal Degeneration, Bluefield Project to Cure Frontotemporal Dementia, the Alzheimer’s Drug Discovery Foundation and the Alzheimer’s Association. He has served as a consultant for Alector, AGTC, Arkuda, Arvinas, AZTherapies, GSK, Oligomerix, Ono, Regeneron, Roche, Samumed, Stealth, Third Rock, Transposon and Wave, and received research support from Biogen, Eisai and Regeneron.
Footnotes
Data Sharing
Data and informed consent form are available upon request after publication (University of California, San Francisco Memory and Aging Center: http://memory.ucsf.edu/research-trials/professional/open-science and Advancing Research and Treatment for Frontotemporal Lobar Degeneration consortium: https://www.allftd.org/data). Requests will be considered by each study investigators based on the information provided by the requester regarding the study and analysis plan. If the use is appropriate, a data sharing agreement will be put in place before a fully de-identified version of the dataset including the data dictionary used for analysis with individual participant data is made available.
References
- 1.Ossenkoppele R et al. Discriminative Accuracy of [18F]flortaucipir Positron Emission Tomography for Alzheimer Disease vs Other Neurodegenerative Disorders. Jama 320, doi: 10.1001/jama.2018.12917 (2018). [DOI] [PMC free article] [PubMed] [Google Scholar]
- 2.Dugger BN et al. Neuropathological comparisons of amnestic and nonamnestic mild cognitive impairment. BMC Neurology 15, 146, doi: 10.1186/s12883-015-0403-4 (2015). [DOI] [PMC free article] [PubMed] [Google Scholar]
- 3.Altomare D et al. Applying the ATN scheme in a memory clinic population: The ABIDE project. Neurology 93, e1635–e1646, doi: 10.1212/WNL.0000000000008361 (2019). [DOI] [PubMed] [Google Scholar]
- 4.Pardini M et al. FDG-PET patterns associated with underlying pathology in corticobasal syndrome. Neurology 92, e1121–e1135, doi: 10.1212/WNL.0000000000007038 (2019). [DOI] [PMC free article] [PubMed] [Google Scholar]
- 5.Irwin DJ et al. Neuropathological and genetic correlates of survival and dementia onset in synucleinopathies: a retrospective analysis. The Lancet Neurology 16, 55–65, doi: 10.1016/s1474-4422(16)30291-5 (2017). [DOI] [PMC free article] [PubMed] [Google Scholar]
- 6.Thijssen EH et al. Diagnostic value of plasma phosphorylated tau181 in Alzheimer’s disease and frontotemporal lobar degeneration. Nat Med, doi: 10.1038/s41591-020-0762-2 (2020). [DOI] [PMC free article] [PubMed] [Google Scholar]
- 7.Janelidze S et al. Plasma P-tau181 in Alzheimer’s disease: relationship to other biomarkers, differential diagnosis, neuropathology and longitudinal progression to Alzheimer’s dementia. Nat Med, doi: 10.1038/s41591-020-0755-1 (2020). [DOI] [PubMed] [Google Scholar]
- 8.Karikari TK et al. Blood phosphorylated tau 181 as a biomarker for Alzheimer’s disease: a diagnostic performance and prediction modelling study using data from four prospective cohorts. The Lancet Neurology 19, 422–433, doi: 10.1016/s1474-4422(20)30071-5 (2020). [DOI] [PubMed] [Google Scholar]
- 9.Palmqvist S et al. Discriminative Accuracy of Plasma Phospho-tau217 for Alzheimer Disease vs Other Neurodegenerative Disorders. JAMA, doi: 10.1001/jama.2020.12134 (2020). [DOI] [PMC free article] [PubMed] [Google Scholar]
- 10.Cullen NC et al. Individualized prognosis of cognitive decline and dementia in mild cognitive impairment based on plasma biomarker combinations. Nature Aging, doi: 10.1038/s43587-020-00003-5 (2020). [DOI] [PubMed] [Google Scholar]
- 11.Palmqvist S et al. Prediction of future Alzheimer’s disease dementia using plasma phospho-tau combined with other accessible measures. Nat Med, doi: 10.1038/s41591-021-01348-z (2021). [DOI] [PubMed] [Google Scholar]
- 12.Wesseling H et al. Tau PTM Profiles Identify Patient Heterogeneity and Stages of Alzheimer’s Disease. Cell, doi: 10.1016/j.cell.2020.10.029 (2020). [DOI] [PMC free article] [PubMed] [Google Scholar]
- 13.Barthelemy NR et al. A soluble phosphorylated tau signature links tau, amyloid and the evolution of stages of dominantly inherited Alzheimer’s disease. Nat Med 26, 398–407, doi: 10.1038/s41591-020-0781-z (2020). [DOI] [PMC free article] [PubMed] [Google Scholar]
- 14.Barthelemy NR et al. Cerebrospinal fluid phospho-tau T217 outperforms T181 as a biomarker for the differential diagnosis of Alzheimer’s disease and PET amyloid-positive patient identification. Alzheimers Res Ther 12, 26, doi: 10.1186/s13195-020-00596-4 (2020). [DOI] [PMC free article] [PubMed] [Google Scholar]
- 15.Janelidze S et al. Cerebrospinal fluid p-tau217 performs better than p-tau181 as a biomarker of Alzheimer’s disease. Nat Commun 11, 1683, doi: 10.1038/s41467-020-15436-0 (2020). [DOI] [PMC free article] [PubMed] [Google Scholar]
- 16.Hanes J et al. Evaluation of a novel immunoassay to detect p-tau Thr217 in the CSF to distinguish Alzheimer disease from other dementias. Neurology 95, e3026–e3035, doi: 10.1212/WNL.0000000000010814 (2020). [DOI] [PMC free article] [PubMed] [Google Scholar]
- 17.Barthelemy NR, Horie K, Sato C & Bateman RJ Blood plasma phosphorylated-tau isoforms track CNS change in Alzheimer’s disease. J Exp Med 217, doi: 10.1084/jem.20200861 (2020). [DOI] [PMC free article] [PubMed] [Google Scholar]
- 18.Brickman AM et al. Plasma p-tau181, p-tau217, and other blood-based Alzheimer’s disease biomarkers in a multi-ethnic, community study. Alzheimer’s & dementia : the journal of the Alzheimer’s Association, doi: 10.1002/alz.12301 (2021). [DOI] [PMC free article] [PubMed] [Google Scholar]
- 19.Lynch CA et al. The clinical dementia rating sum of box score in mild dementia. Dementia and geriatric cognitive disorders 21, 40–43, doi: 10.1159/000089218 (2006). [DOI] [PubMed] [Google Scholar]
- 20.Montine TJ et al. National Institute on Aging-Alzheimer’s Association guidelines for the neuropathologic assessment of Alzheimer’s disease: a practical approach. Acta Neuropathol 123, 1–11, doi: 10.1007/s00401-011-0910-3 (2012). [DOI] [PMC free article] [PubMed] [Google Scholar]
- 21.Mackenzie IR et al. A harmonized classification system for FTLD-TDP pathology. Acta Neuropathol 122, 111–113, doi: 10.1007/s00401-011-0845-8 (2011). [DOI] [PMC free article] [PubMed] [Google Scholar]
- 22.Braak H et al. Staging of brain pathology related to sporadic Parkinson’s disease. Neurobiology of aging 24, 197–211, doi: 10.1016/s0197-4580(02)00065-9 (2003). [DOI] [PubMed] [Google Scholar]
- 23.Kovacs GG et al. Aging-related tau astrogliopathy (ARTAG): harmonized evaluation strategy. Acta Neuropathol 131, 87–102, doi: 10.1007/s00401-015-1509-x (2016). [DOI] [PMC free article] [PubMed] [Google Scholar]
- 24.McKeith IG et al. Diagnosis and management of dementia with Lewy bodies. Fourth consensus report of the DLB Consortium 89, 88–100, doi: 10.1212/wnl.0000000000004058 (2017). [DOI] [PMC free article] [PubMed] [Google Scholar]
- 25.Nelson PT et al. Limbic-predominant age-related TDP-43 encephalopathy (LATE): consensus working group report. Brain : a journal of neurology 142, 1503–1527, doi: 10.1093/brain/awz099 (2019). [DOI] [PMC free article] [PubMed] [Google Scholar]
- 26.La Joie R et al. Multisite study of the relationships between antemortem [(11)C]PIB-PET Centiloid values and postmortem measures of Alzheimer’s disease neuropathology. Alzheimers Dement 15, 205–216, doi: 10.1016/j.jalz.2018.09.001 (2019). [DOI] [PMC free article] [PubMed] [Google Scholar]
- 27.Diedenhofen B & Musch J cocor: a comprehensive solution for the statistical comparison of correlations. PloS one 10, e0121945, doi: 10.1371/journal.pone.0121945 (2015). [DOI] [PMC free article] [PubMed] [Google Scholar]
- 28.DeLong ER, DeLong DM & Clarke-Pearson DL Comparing the Areas under Two or More Correlated Receiver Operating Characteristic Curves: A Nonparametric Approach. Biometrics 44, 837–845, doi: 10.2307/2531595 (1988). [DOI] [PubMed] [Google Scholar]
- 29.Youden WJ Index for rating diagnostic tests. Cancer 3, 32–35, doi: (1950). [DOI] [PubMed] [Google Scholar]
- 30.McKhann GM et al. The diagnosis of dementia due to Alzheimer’s disease: recommendations from the National Institute on Aging-Alzheimer’s Association workgroups on diagnostic guidelines for Alzheimer’s disease. Alzheimer’s & dementia : the journal of the Alzheimer’s Association 7, 263–269, doi: 10.1016/j.jalz.2011.03.005 (2011). [DOI] [PMC free article] [PubMed] [Google Scholar]
- 31.Albert MS et al. The diagnosis of mild cognitive impairment due to Alzheimer’s disease: recommendations from the National Institute on Aging-Alzheimer’s Association workgroups on diagnostic guidelines for Alzheimer’s disease. Alzheimer’s & dementia : the journal of the Alzheimer’s Association 7, 270–279, doi: 10.1016/j.jalz.2011.03.008 (2011). [DOI] [PMC free article] [PubMed] [Google Scholar]
- 32.Lee SE et al. Clinicopathological correlations in corticobasal degeneration. Annals of neurology 70, 327–340, doi: 10.1002/ana.22424 (2011). [DOI] [PMC free article] [PubMed] [Google Scholar]
- 33.Höglinger GU et al. Clinical diagnosis of progressive supranuclear palsy: The movement disorder society criteria. Mov Disord 32, 853–864, doi: 10.1002/mds.26987 (2017). [DOI] [PMC free article] [PubMed] [Google Scholar]
- 34.Rascovsky K et al. Sensitivity of revised diagnostic criteria for the behavioural variant of frontotemporal dementia. Brain : a journal of neurology 134, 2456–2477, doi: 10.1093/brain/awr179 (2011). [DOI] [PMC free article] [PubMed] [Google Scholar]
- 35.Gorno-Tempini ML et al. Classification of primary progressive aphasia and its variants. Neurology 76, 1006–1014, doi: 10.1212/WNL.0b013e31821103e6 (2011). [DOI] [PMC free article] [PubMed] [Google Scholar]
- 36.Ghetti B et al. Invited review: Frontotemporal dementia caused by microtubule-associated protein tau gene (MAPT) mutations: a chameleon for neuropathology and neuroimaging. Neuropathology and applied neurobiology 41, 24–46, doi: 10.1111/nan.12213 (2015). [DOI] [PMC free article] [PubMed] [Google Scholar]
- 37.Schneider JA, Arvanitakis Z, Leurgans SE & Bennett DA The neuropathology of probable Alzheimer disease and mild cognitive impairment. Annals of neurology 66, 200–208, doi: 10.1002/ana.21706 (2009). [DOI] [PMC free article] [PubMed] [Google Scholar]
- 38.Mattsson-Carlgren N et al. Longitudinal plasma p-tau217 is increased in early stages of Alzheimer’s disease. Brain : a journal of neurology 143, 3234–3241, doi: 10.1093/brain/awaa286 (2020). [DOI] [PMC free article] [PubMed] [Google Scholar]
Associated Data
This section collects any data citations, data availability statements, or supplementary materials included in this article.