Abstract
We present a dual-mode readout sensing mechanism that can effectively distinguish true and false-positive signals of melamine in milk by combining colorimetric analysis and surface-enhanced Raman scattering (SERS) spectroscopy. The colorimetry analysis takes advantage of color change of plasmonic nanoparticles upon the presence of melamine. We discovered that Ag colloids with 20 nm diameter was suitable for both colorimetric and SERS methods. However, the colorimetric method may present false-positive signals with the presence of interfering compounds. SERS spectroscopy can overcome this limitation and directly obtain signature spectra from the same plasmonic NPs used for the colorimetric assay without any modification. Melamine/s-triazine can be reliably differentiated by probing the SERS spectra based on surface-selection rules. The limit of detection of sensing melamine from milk by this method could reached to 0.05 ppm. Therefore, the combination of colorimetric and SERS method not only allows for rapid preliminary screening of melamine by naked eyes, but also greatly reduces false-positive signals by surface selection rules in SERS.
Keywords: Colorimetry, SERS, plasmonic NPs, melamine
1. Introduction
Melamine is a chemical compound widely used as a raw material in industry for producing synthetic polymers. Melamine resin exhibits excellent thermal resistance and heat tolerance; it is considered a nontoxic plastic material with a highly stable structure and is widely used for producing laminates, plastics, dishware, and kitchenware[1, 2]. However, serious health problems occur when the melamine monomer content is higher than the safety regulation level (2.5 ppm in the USA and EU and 1 ppm in China)[3]. There are six nitrogen atoms in molecule which cause the high nitrogen content (66% by mass) of melamine. Since 2008, melamine has attracted much attention due to the scandal of illegally adding melamine into dairy products to achieve a high readout of apparent protein content. The intake of melamine can lead to kidney disease and even death in infants [4, 5]. These above-mentioned facts are some of the key issues that makes the detection of melamine extremely necessary for food safety. Recently, some new technologies, such as high-performance liquid chromatography (HPLC) [6], gas chromatography in tandem with mass spectrometry and enzyme-linked immunosorbent assay (ELISA) have been employed for the detection of melamine[7, 8]. However, all of these techniques require expensive equipment and skilled manipulation and as well as being time consuming.
Plasmonic nanoparticles (NPs), such as gold (Au) or silver (Ag), show unique properties due to their localized surface plasmon resonances (LSPR). The LSPR feature of plasmonic NPs has been used in colorimetry analysis, in which the distance between metallic colloidal particles changes with the presence of target analytes[9]. The melamine molecule has three amino groups, which enable the strong crosslinking ability with the metallic NPs or the formation of multiple hydrogen bonds with the guest molecule. Lu’s group developed the pioneering work on colorimetry sensing of melamine. They first synthesized the cyanuric acid (CA) derivative with a thiol group[10]. The CA-functionalized Au NPs could aggregate in the presence of melamine as the triple hydrogen bonds formed between CA and melamine. Chi et al. synthesized citrate-stabilized gold nanoparticles and used them for sensing melamine directly. The interaction between the citrate on surface of the Au NPs and melamine enables instant colorimetric sensing of melamine [11]. Colorimetry provides a simple, instant and straightforward way for melamine sensing. However, the colorimetry process can be significantly affected by the analyte matrices and salt residues, resulting in false-positive signals. Therefore, a tedious sample pretreatment process is usually required to exclude the effects of interfering matrices or salt from the sample.
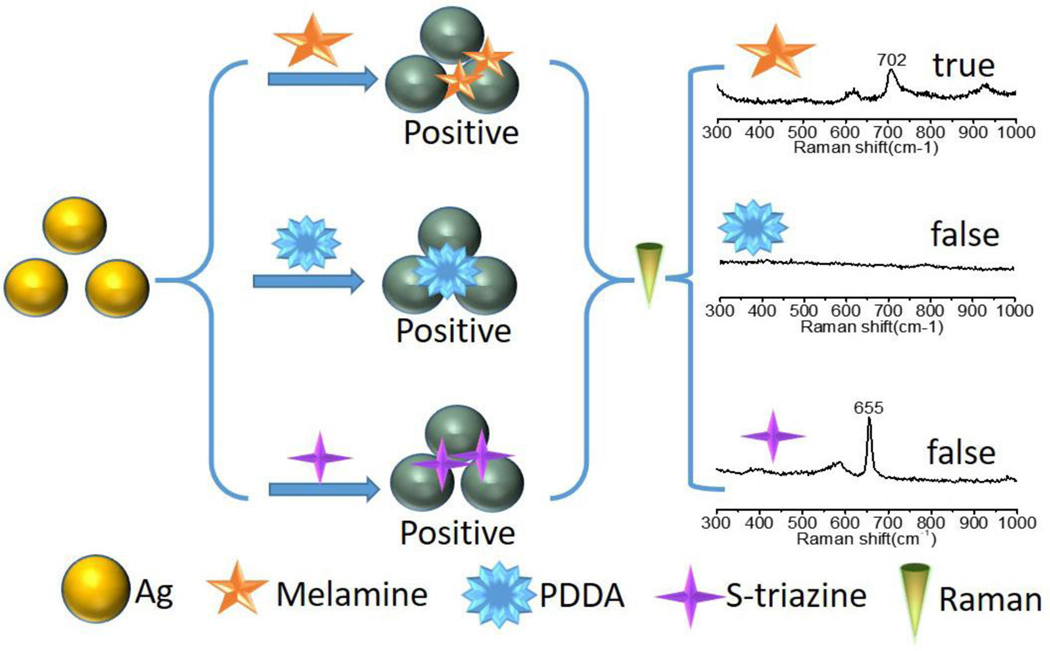
Surface-enhanced Raman Scattering (SERS) spectroscopy is an effective analytical technique due to its feasibility to obtain molecule structural information of analytes at low concentrations [12]. SERS methods have been widely used for food safety monitoring [13–18]. Xiao et. al. has fabricated silver film over nanospheres (AgFON) by vacuum magnetron sputtering and dip-coating methods. The AgFON was employed for detecting melamine from infant formula milk powder solution directly, and the sensitivity was down to 2 ppm[18]. Li et al. synthesized polymer-coated Ag NPs and used them as a SERS substrate for melamine sensing. The detection limit was dramatically enhanced after the Ag-polymer nanocomposite was washed by tetrahydrofuran [19]. Lu and coworkers combined molecular imprint technology with the SERS method for melamine selective sensing [20], in which the limit of detection was achieved at 0.5×10⁻⁵ M. The plasmonic nanoparticles were widely utilized as substrates in SERS measurement. The SERS enhancement factor is prominent at the junction or gap between plasmonic nanoparticles, which was named as the ‘hot spot’ for SERS. The appearance of the plasmonic colloid changed with the variation of the distance between plasmonic nanoparticles. Therefore, more clusters or junctions were formed during the process of colorimetric assay by using plasmonic NPs. The SERS sensor based on Au NPs provides an alternative method for the colorimetric detection and has been applied in biological and environmental detection [21, 22]. However, the extinction coefficient of colloidal Ag NPs is several times higher than that of colloidal Au with the similar particle size [23], and the price of Ag is much cheaper than Au. Herein, we developed a simultaneous colorimetry and SERS method for detecting melamine from milk by using Ag NPs. In the presence of melamine, Ag NPs could form crosslinks, inducing the aggregation of the Ag colloid. The color of colloidal Ag changed from bright yellow to gray, accompanied by the SERS signals of melamine. The SERS spectra could distinguish false positive signals efficiently as shown in Scheme 1. The detection result with Ag colloid showed higher sensitivity than that with Au colloid. This simple strategy takes advantage of both colorimetry and SERS technologies and provides a facile, instant and practical approach for monitoring melamine in milk products.
Scheme 1.
Principle of simultaneous colorimetric and SERS detection of melamine
2. Materials and methods
2.1. Reagents and chemicals
Silver nitrate (AgNO3), tetrachloroauric acid (HAuCl4), trisodium citrate dehydrate (Na3C6H5O7) and sodium borohydridewere (NaBH4) were purchased from Shanghai Chemical Reagent Co. (Shanghai, China). Melamine, S-triazine and acetonitrile were purchased from Sinopharm Chemical Reagent Co., Ltd. The liquid milk sample was obtained from local supermarkets. The water used was double distilled (pH 5.6, resistivity of 18.2 MΩ cm, surface tension of 73.06 mN/m at 22 °C) after a deionized exchange.
2.2. Preparation of plasmonic NPs
Au NPs (13 nm) were synthesized according to the method reported by Natan et.al. [24]. Typically, 5 mL of 1% trisodium citrate was added into a boiling aqueous solution of HAuCl4 (50 mL, 1 mM). The mixed solution was turned into wine-red color quickly. The suspension was further refluxed for another 30 min to ensure complete reaction and followed by cooling to room temperature under continues stirring.
Ag NPs (10–14 nm) were prepared as the protocol proposed by Ahern et. al [25]. Briefly, 3.5 mg of NaBH4 dissolved in 75 mL water and kept at 4 °C with ice bath. Aqueous solution of AgNO3 (9 mL, 2.2 mM) was added to the NaBH4 solution with stirring. The color of mixed solution changed to brown and the final color was bright yellow. The suspension was kept stirring for 2 h. The Au NPs(50 nm) and Ag NPs(40 nm) were prepared as previous reported[26, 27]. The Au and Ag colloids were used within 2 months.
2.3. Instruments
UV-vis absorption spectra were measured on a UV-3600 spectrophotometer (Shimadzu) in quartz cells with 1 cm optical path. Transmission electron microscopy (TEM) images of the metallic NPs were collected on a JEM-2100F microscope (JEOL, Tokyo). For SERS measurement, 5 ul of the mixture from the colorimetric assay was deposited onto a quartz plate and dried at air condition. The Raman measurement were developed on Renishaw InVia Raman spectrometer equipped with a CCD detector and 20× objective lens was used for sample focusing. The excitation laser was 514.5 nm from an air-cooled argon ion laser and the size of the laser spot was 2 μm. The exposure time for Raman measurement was 2 s and the spectra were collected by 2 scans. In order to achieve on-site monitoring of the quality of milk, the SERS sensing was carried on a portable Raman spectrometer (BWS465 iRman; B&W Tek, USA) with 785 nm laser and the resolution was 5 cm−1. The size of the beam spot was 105 μm and a 1.5 m bifurcated fiber probe was used to illuminate the analyte and collect the Raman signals. Raman spectra were recorded by the BWSPEC Software.
2.4. Melamine detection procedure
Melamine powder was spiked into distilled water under ultrasonic condition for 5 min, the original melamine solution (100 ppm) were obtained and kept at room temperature for further used. The melamine solution with series concentration were diluted by mixing water with original melamine solution at different ratio.
The liquid milk with various concentrations of melamine were prepared by mixing aqueous melamine solution with liquid milk at chemometric ratio. The original concentration of aqueous melamine solution was 600 ppm. The melamine/milk solution (0.3 ppm) were preparing by diluting aqueous melamine solution (600 ppm) with milk, and then further diluted with milk to obtain samples containing difference levels of melamine. The extraction of melamine from liquid milk was as follow procedure: The liquid milk was first mixed with acetonitrile (1:1 v/v) under vigorous vortex shaking for 30 S. The mixture was treated with ultrasonication for 5 min, and then centrifuged 8000 rpm for 10 min, the supernatant was used for the following detection.
3. Results and discussion
3.1. Metallic NPs characterization
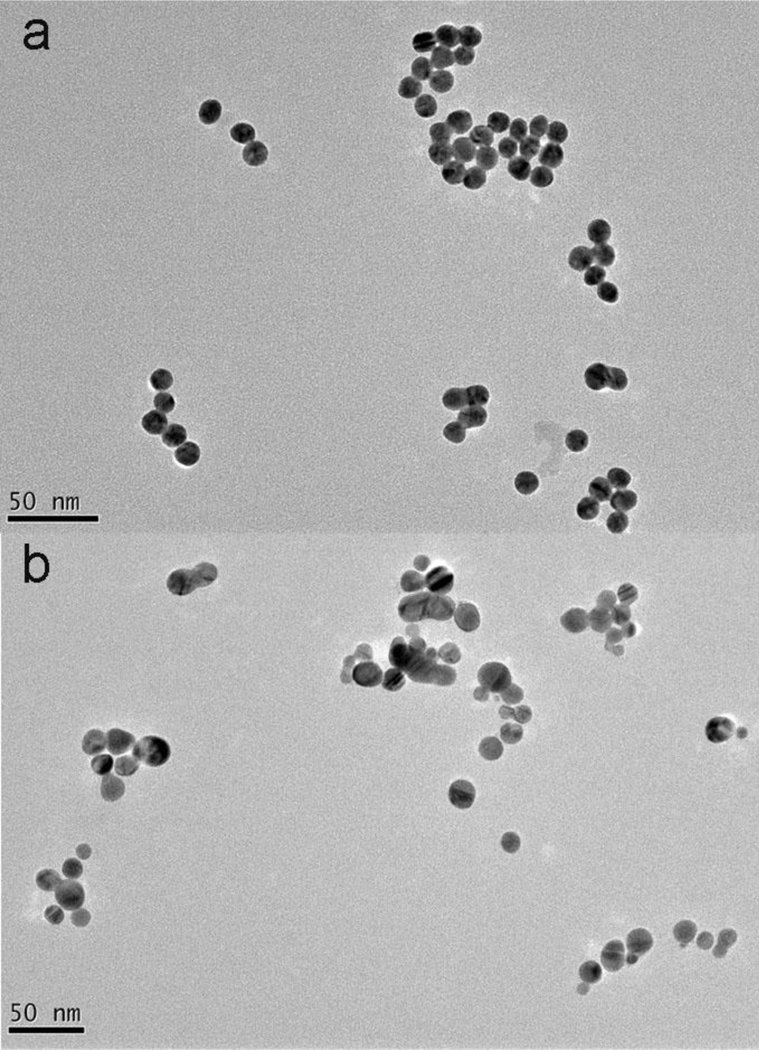
The quality of the metallic colloid is closely associated with the sensitivity in colorimetric and SERS sensing. The morphology and dispersibility of metallic NPs prepared for colorimetric and SERS sensing were characterized by TEM. Most of the as-prepared gold NPs are spherical appearance and with diameters in a narrow range between 12–14 nm. Au NPs with those diameters are firstly and mostly used for colorimetry sensing [28, 29]. The gold colloid exhibit negative charge feature as the citric acid capping ligand. It is well known that the Ag nanostructure exhibit higher SERS enhance factors than Au NPs[27]. Ag NPs with diameters of 16–22 nm are also used as effective substrate for colorimetric sensing. Representative TEM observation of the prepared Ag NPs (Figure 1b) show that the NPs possess spherical shape with a diameter distribution between 10–14 nm, which were used for colorimetry and SERS sensing.
Figure 1.
TEM images of Au (a) and Ag (b) NPs
3.2. Colorimetric assay of melamine by plasmonic NPs
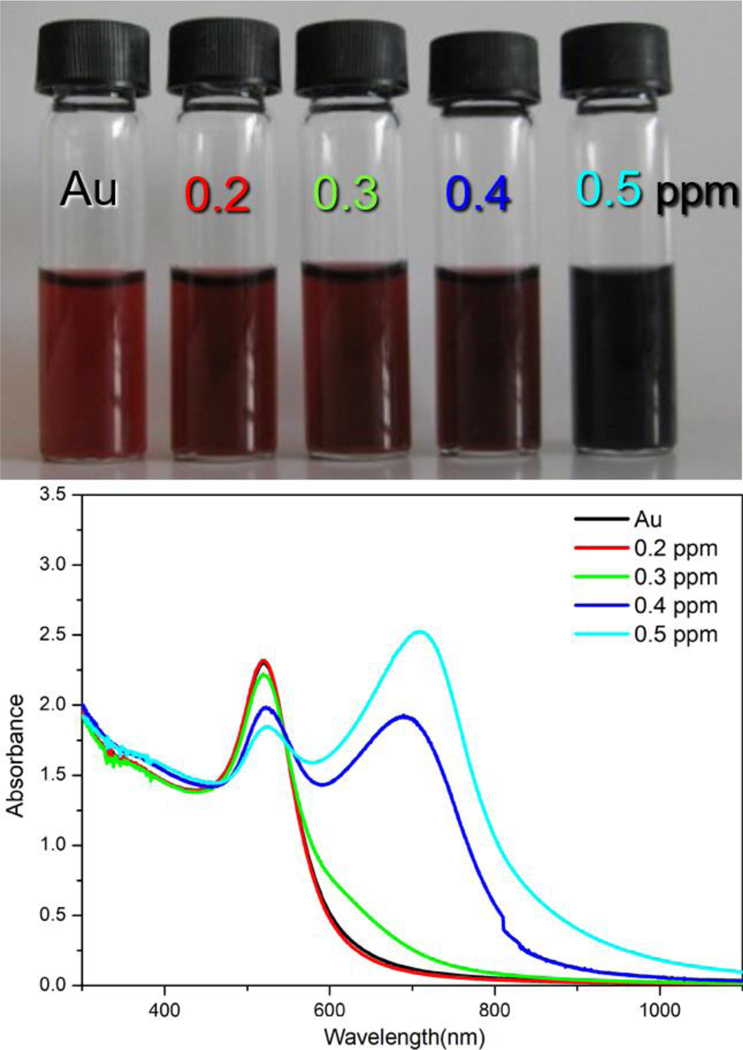
The initial Au NPs were uniformly dispersed in colloidal suspension, and the appearance of the Au colloid without melamine was wine red color as its strong surface plasmon resonance (SPR) at 521 nm. Upon direct exposure to melamine, the color of Au NPs colloid changed from wine red to deep red and deep blue progressively as the melamine concentration varied from 0 to 0.5 ppm as shown in Figure 2a. The aggregation of Au NPs resulted from the presence of melamine was also determined by UV-vis absorption spectra (Figure 2b). The UV-vis spectra of Au NPs remained nearly unchanged with the melamine concentration at 0.2 ppm. The SPR band of Au NPs at 521 nm was decreasing gradually when the melamine concentration increases from 0.3 to 0.5 ppm. In the meanwhile, a new absorbance band at 720 nm appeared as the melamine concentration increased to 0.4 ppm. The new peak at 720 nm was due to the dipole plasmon resonance of aggregation of the individual Au NPs[30, 31], which indicates more aggregation of Au NPs.
Figure 2.
Visual color change (a) and UV-vis absorption spectra of Au colloid with presenting different concentrations of melamine.
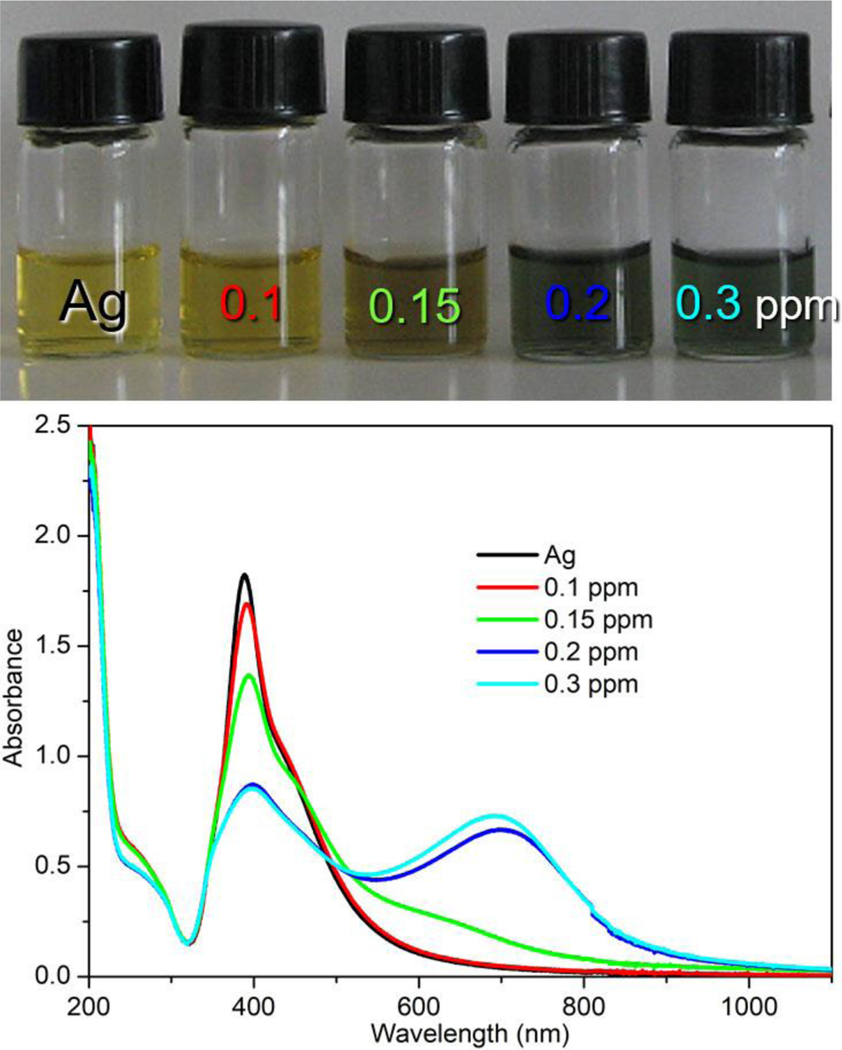
The molar extinction coefficient factor and SERS activity of Ag NPs is higher than that of Au NPs with similar diameter[32]. The Ag and Au NPs with different diameters were synthesize. The SERS performance of the prepared plasmonic NPs were shown in Figure S1, in which the Au (50 nm) and Ag NPs (40 nm) exhibited better SERS enhancement. The moderate enhancement was obtained from Ag NPs with 20 nm size, and Au NPs (13 nm) at here has not shown efficient SERS enhancement of melamine. The reason is the size of NPs play a key role in SERS performance of plasmonic NPs[19, 33]. The colorimetry images of these prepared NPs for melamine sensing were shown in Figure S2. It is difficult to distinguish the color change of Au NPs with 50 nm diameter with melamine as the purple appearance of Au colloid, and the aggregation was happened to Au with 50 nm after two months (Figure S3). The Ag NPs with 40 nm diameter also has not shown color change with melamine presented. The Colorimetric sensing base on plasmonic NPs could allow rapid preliminary discrimination of melamine activity by the naked eye. Thus, The Ag NPs with diameter nearly 20 nm was employed for simultaneous colorimetric and SERS sensing of melamine. The visual color change of Ag NPs upon the presence of melamine with different concentrations are shown in Figure 3a, the original Ag NPs shows bright yellow color as its plasmonic feature and the SPR band located at 400 nm. Upon the addition of melamine to Ag NPs suspension, the color of Ag NPs colloid changed from bright yellow to brown and deep green progressively, as the concentration of melamine increased from 0 to 0.3 ppm as shown in Figure 3a. The aggregation of Ag NPs as the concentration increasing of melamine was monitored through UV-vis spectra (Figure 3b). A sharp SPR band at 390 nm was observed of original Ag NPs, that corresponding to the 14nm Ag NPs within narrow size distribution. The intensity of SPR band of Ag NPs at 390 nm was decreasing gradually as melamine concentration increasing from 0.05–0.3 ppm, and a new absorption peak nearly at 700 nm is observed, which is due to the formation of Ag aggregates[34]. The Ag NPs shows higher sensitivity than Au NPs in colorimetric sensing of melamine, that is assigned to the higher molar extinction coefficient factor of Ag materials.
Figure 3.
Visual color change (a) and UV-vis absorption spectra of Ag colloid with presenting different concentrations of melamine.
3.3. SERS sensing of melamine
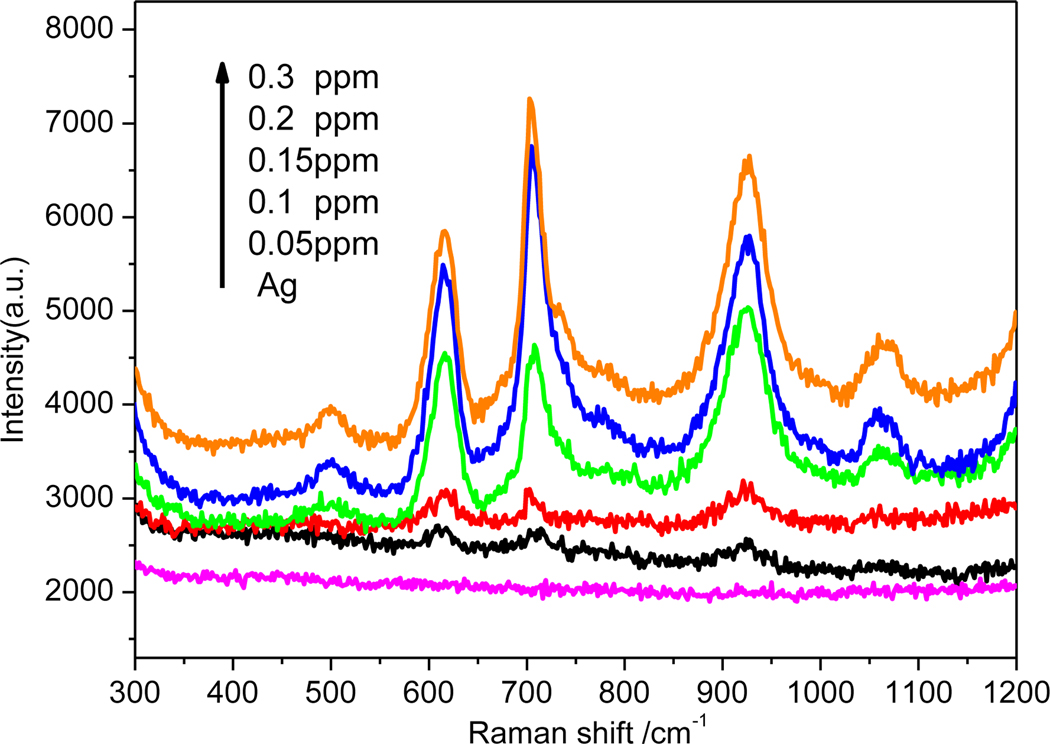
In order to demonstrate the validity of the dual-readout assay and get the molecular information of analyte, the Raman spectra of sample with melamine was measured. The SERS spectra of melamine at different concentrations was presented in Figure 4. Normal Raman spectra of solid melamine at was shown in Figure S4. The peaks at 582, 673 and 985 cm−1 were observed. The most prominent peak at 673 cm−1 is assigned to the Ring breathing mode of C atoms of melamine (ring-breathing II mode). The second most prominent peak at 985 cm−1 is assigned to the ring-breathing mode I of the triazine ring of melamine. The most prominent peak at 702 cm−1 in SERS spectra of melamine was chosen as feature band. The SERS spectra changed obviously compare with the solid Raman spectra of melamine. The feature peak of melamine at 702 cm−1 were shifted nearly 30 cm−1 relative to the peak (676 cm−1) in the Raman spectra of solid melamine. This may be attributed to the effect of SERS substrate of Ag [35, 36]. As shown in Figure 4, the intensity of the peak at 702 cm−1 was increased with the increment of the concentration of melamine. The formation of the Ag NPs clusters was further verified by TEM images as shown in Figure S5. The Ag NPs almost oligo aggregated in the presence of melamine at low concentration (Figure S5a). When the higher melamine (0.2 ppm) existed in the Ag colloid, the obviously aggregation of the Ag NPs were observed as shown in Figure S5b. The TEM image were in accordance with the colorimetric and SERS results.
Figure 4.
SERS spectra of Ag colloid with different concentrations of aqueous melamine solutions.
3.4. Detection of melamine in milk sample
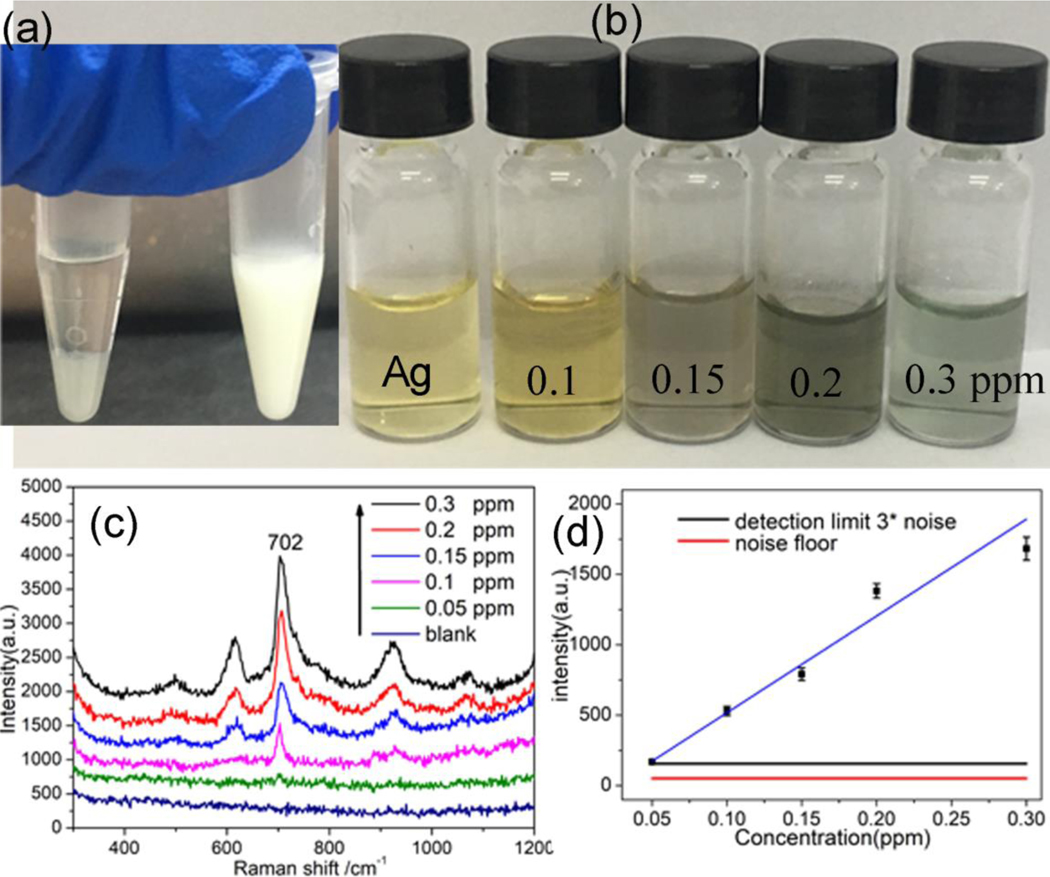
In order to verify these, simultaneous colorimetric and SERS sensor could be applied for melamine monitoring in real milk products, the different concentrations of melamine were mixing with liquid milk artificially. Acetonitrile were firstly added into the milk sample (2:3 v/v) for deproteinizing, and then the residues were separated by centrifuged. The acetonitrile usually used as solvent for extracting and SERS sensing melamine from milk[16, 37], and no interference were observed. Finally, the obtained supernatant as shown in Figure 5(a) was used for the following detection. As shown in Figure. 5(b), when supernatant with melamine were added to an aqueous solution of the Ag NPs, the color of Ag NPs solution changed from bright yellow to gray gradually with the increase of melamine concentration from 0 to 0.3 ppm. At the same time, the Raman spectra of the solution of Ag NPs were measured upon adding different concentrations of melamine, As shown in Figure 5(c), all the characteristic peaks of the melamine show a monotonous increase in intensity as the increase of the melamine concentration. The band at 702 cm−1 was chosen as the characteristic band for melamine. As shown in Figure 5(d), a linear regression (R2 = 0.9687) was found between Raman intensity and melamine concentration. The limit of detection (LOD), which is determined as the signal-to-noise (SNR) ratio at 3 as presented by the red line in Figure 5(d), the LOD of melamine in milk sample could reached 0.05 ppm. In order to distinguish the characteristic Raman band obviously, the SERS spectra were transformed by second derivative method (Luo, et al., 2016). The second derivative transformation of the band at 702 cm−1 is presented in Figure S6. As the concentration of melamine decrease from 0.3 to 0.05 ppm, the intensity of Raman band at 702 cm−1 decreases as well.
Figure 5.
The photographic image of the milk before and after deproteinization(a), visual color change(b) and SERS spectra (c) of Ag colloid encounter with different concentration melamine extract from milk, (d) SERS intensity as a function of melamine concentration in milk
3.5. Identification of false positive signals
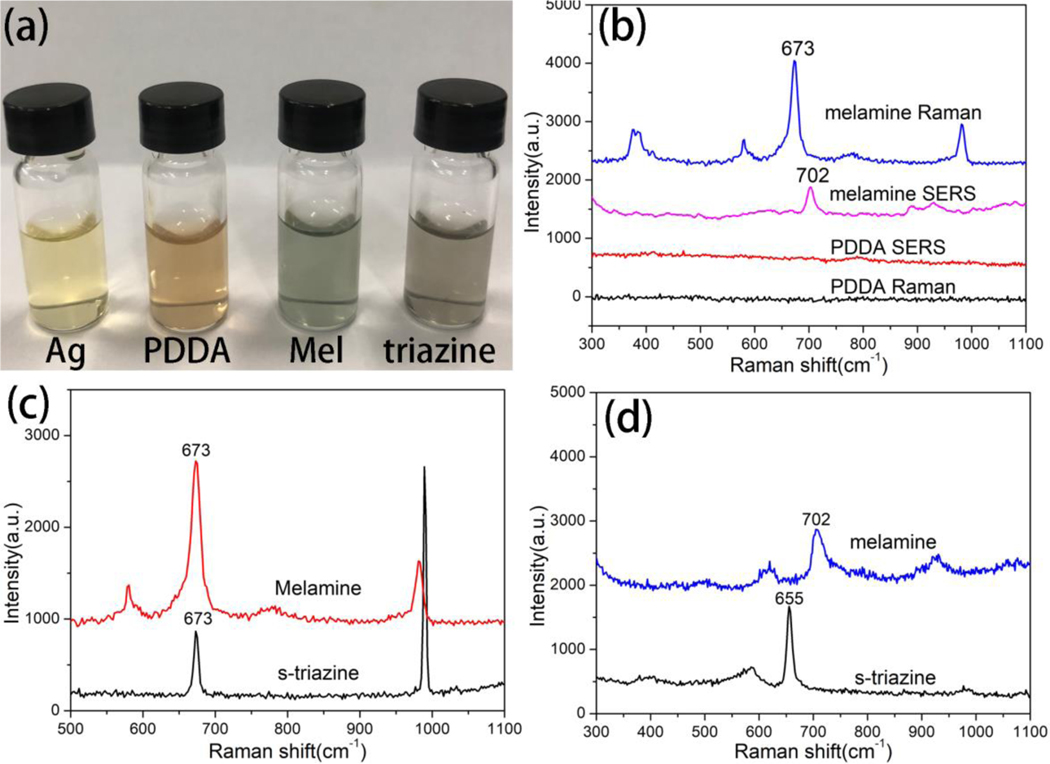
False positive signals for the metallic colloid colorimetric detection happened when the target samples gave a color change from yellow to brown/gray in the presence of other molecules. The polycationic electrolyte (PDDA) and s-triazine were added in control samples to demonstrate this concept. PDDA is a kind of water-soluble cationic polyelectrolyte which is commonly used for assembled metallic NPs. When the colloidal Ag NPs encountered with PDDA (0.2 ppm) the color was changed from bright yellow to brown as shown in Figure 6a. The Raman spectra could provide “fingerprint” information of molecule that would play an important role in reduce false positive results. The Raman spectra of PDDA in the presence (SERS) and absence (normal Raman) of Ag NPs are shown in Figure 6b. There is no Raman peak observed from the sample with PDDA contained. The Raman spectroscopy at here could discriminate PDDA from melamine easily. S-triazine has similar structure with melamine which was often used for synthesizing herbicides, and the residue of s-triazine in environment is harmful for the public health [38]. When the s-triazine presented in the control sample (0.2 ppm) the color of the Ag colloid changed to gray as shown in Figure 6a. The colorimetric assay result of s-triazine is similar with melamine, which cannot distinguish melamine from s-triazine. The Raman spectra of melamine and s-triazine solid as shown in Figure 6c. The feature peaks of melamine and s-triazine are located at 673 cm−1, both those peaks are assigned to ring breath type of vibrations of triazine group. The overlapping peak position makes it is difficult to discriminate melamine and s-triazine through normal Raman spectra. After mixed with Ag colloids, the SERS spectra of melamine and s-triazine were measured and presented in Figure 6d. The feature Raman peak of melamine was red shift to 702 cm−1 in SERS spectra. Furthermore, the Raman peak of s-triazine was blue shift to 655 cm−1 in SERS spectra. The SERS spectra of s-triazine and melamine display similar vibrational bands but with some differences in Raman shift. The s-triazine was binding on the surface of Ag NPs through N atom in triazine ring[39], and the melamine was bonding on the surface of Ag NPs through amino group[11]. This phenomenon points toward a difference of the molecular orientation of the triazine ring on the surface of Ag NPs, which is agree with the surface selection rules [40, 41]. The obvious difference of Raman peaks of melamine and s-triazine in SERS spectra could distinguish them effectively. Therefore, unlike colorimetric assay and normal Raman spectroscopy, SERS can effectively distinguish different analytes with similar molecule structure, and thus provide more accurate result.
Figure 6.
The photographic image of Ag colloid encounter with different analytes (0.2 ppm) (a), Raman and SERS spectra of PDDA and melamine at 0.2 ppm (b). Raman (c) and SERS (d) spectra of melamine and s-triazine (0.2 ppm).
4. Conclusion
In conclusion, a simple, rapid, and accurate strategy was developed to monitor and identify melamine from liquid milk by integration of colorimetric method and SERS. The colorimetric detection using noble metallic nanoparticles could provide information in a simple and straightforward way. The Ag NPs with 20 nm diameter was suitable for this simultaneous dual mode sensing melamine as the higher molar extinction coefficient factor of Ag than Au[32]. SERS measurement was conducted immediately to identify the results acquired from the colorimetric detection. The false-positive results of melamine could be distinguished through the feature peak position in SERS spectra. The On-site melamine identification can be achieved by using portable Raman spectrometer. This tandem assay of colorimetric method and SERS using Ag NPs with proper size can be applied as a simple, sensitive and reliable technology for screening melamine from other dairy products to enhance food safety.
Supplementary Material
Highlights.
A colorimetric and SERS dual-readout biosensor base on plasmonic Ag NPs.
Distinguishing true and false-positive results by surface selection rules in SERS.
Successful application for monitoring melamine in milk.
Acknowledgement:
The authors would like to acknowledge the support from the Science Research Project of Education Department of Liaoning Province of China (No. L2019011), the Natural Science Foundation of Liaoning Province China (No. 20180550246) and the talent scientific research fund of LSHU (No. 2017XJJ-037). The United States National Institutes of Health under Grant No. 1R21DA0437131 and the Unites States Department of Agriculture under Grant No. 2017-67021-26606
Footnotes
Declaration of interests
The authors declare that they have no known competing financial interests or personal relationships that could have appeared to influence the work reported in this paper.
Publisher's Disclaimer: This is a PDF file of an unedited manuscript that has been accepted for publication. As a service to our customers we are providing this early version of the manuscript. The manuscript will undergo copyediting, typesetting, and review of the resulting proof before it is published in its final form. Please note that during the production process errors may be discovered which could affect the content, and all legal disclaimers that apply to the journal pertain.
References:
- [1].Hong K, Park S, Melamine resin microcapsules containing fragrant oil: synthesis and characterization, Materials Chemistry and Physics, 58 (1999) 128–131. [Google Scholar]
- [2].Ding N, Yan N, Ren C, Chen X, Colorimetric determination of melamine in dairy products by Fe3O4 magnetic nanoparticles− H2O2− ABTS detection system, Analytical chemistry, 82 (2010) 5897–5899. [DOI] [PubMed] [Google Scholar]
- [3].Su H, Fan H, Ai S, Wu N, Fan H, Bian P, Liu J, Selective determination of melamine in milk samples using 3-mercapto-1-propanesulfonate-modified gold nanoparticles as colorimetric probe, Talanta, 85 (2011) 1338–1343. [DOI] [PubMed] [Google Scholar]
- [4].Shen J-S, Cai Q-G, Jiang Y-B, Zhang H-W, Anion-triggered melamine based self-assembly and hydrogel, Chemical Communications, 46 (2010) 6786–6788. [DOI] [PubMed] [Google Scholar]
- [5].Kong X, Du X, In situ IRRAS studies of molecular recognition of barbituric acid lipids to melamine at the air–water interface, The Journal of Physical Chemistry B, 115 (2011) 13191–13198. [DOI] [PubMed] [Google Scholar]
- [6].Ehling S, Tefera S, Ho I, High-performance liquid chromatographic method for the simultaneous detection of the adulteration of cereal flours with melamine and related triazine by-products ammeline, ammelide, and cyanuric acid, Food Additives and Contaminants, 24 (2007) 1319–1325. [DOI] [PubMed] [Google Scholar]
- [7].Hong M, Sai F, Yong-Ning W, Zhang L, Ping-Ping Z, Hui-Jing C, Yun-Feng Z, Jing-Guang L, Simultaneous determination of melamine, ammelide, ammeline, and cyanuric acid in milk and milk products by gas chromatography-tandem mass spectrometry, Biomedical and Environmental Sciences, 22 (2009) 87–94. [DOI] [PubMed] [Google Scholar]
- [8].Lutter P, Savoy-Perroud M-C, Campos-Gimenez E, Meyer L, Goldmann T, Bertholet M-C, Mottier P, Desmarchelier A, Monard F, Perrin C, Screening and confirmatory methods for the determination of melamine in cow’s milk and milk-based powdered infant formula: validation and proficiency-tests of ELISA, HPLC-UV, GC-MS and LC-MS/MS, Food Control, 22 (2011) 903–913. [Google Scholar]
- [9].Kannegulla A, Liu Y, Wu B, Cheng L-J, Plasmonic Open-Ring Nanoarrays for Broadband Fluorescence Enhancement and Ultrasensitive DNA Detection, The Journal of Physical Chemistry C, 122 (2017) 770–776. [Google Scholar]
- [10].Ai K, Liu Y, Lu L, Hydrogen-bonding recognition-induced color change of gold nanoparticles for visual detection of melamine in raw milk and infant formula, Journal of the American Chemical Society, 131 (2009) 9496–9497. [DOI] [PubMed] [Google Scholar]
- [11].Chi H, Liu B, Guan G, Zhang Z, Han M-Y, A simple, reliable and sensitive colorimetric visualization of melamine in milk by unmodified gold nanoparticles, Analyst, 135 (2010) 1070–1075. [DOI] [PubMed] [Google Scholar]
- [12].Subaihi A, Muhamadali H, Mutter ST, Blanch E, Ellis DI, Goodacre R, Quantitative detection of codeine in human plasma using surface-enhanced Raman scattering via adaptation of the isotopic labelling principle, Analyst, 142 (2017) 1099–1105. [DOI] [PubMed] [Google Scholar]
- [13].Kong X, Yu Q, Li E, Wang R, Liu Q, Wang AX, Diatomite Photonic Crystals for Facile On-Chip Chromatography and Sensing of Harmful Ingredients from Food, Materials, 11 (2018) 539. [DOI] [PMC free article] [PubMed] [Google Scholar]
- [14].Fan Y, Lai K, Rasco BA, Huang Y, Analyses of phosmet residues in apples with surface-enhanced Raman spectroscopy, Food Control, 37 (2014) 153–157. [Google Scholar]
- [15].Xu T, Wang X, Huang Y, Lai K, Fan Y, Rapid detection of trace methylene blue and malachite green in four fish tissues by ultra-sensitive surface-enhanced Raman spectroscopy coated with gold nanorods, Food Control, (2019) 106720. [Google Scholar]
- [16].Giovannozzi AM, Rolle F, Sega M, Abete MC, Marchis D, Rossi AM, Rapid and sensitive detection of melamine in milk with gold nanoparticles by Surface Enhanced Raman Scattering, Food Chemistry, 159 (2014) 250–256. [DOI] [PubMed] [Google Scholar]
- [17].Zhang C, You T, Yang N, Gao Y, Jiang L, Yin P, Hydrophobic paper-based SERS platform for direct-droplet quantitative determination of melamine, Food chemistry, 287 (2019) 363–368. [DOI] [PubMed] [Google Scholar]
- [18].Xiao G, Li L, Yan A, He X, Direct detection of melamine in infant formula milk powder solution based on SERS effect of silver film over nanospheres, Spectrochimica Acta Part A: Molecular and Biomolecular Spectroscopy, (2019) 117269. [DOI] [PubMed] [Google Scholar]
- [19].Joseph V, Matschulat A, Polte J, Rolf S, Emmerling F, Kneipp J, SERS enhancement of gold nanospheres of defined size, Journal of Raman Spectroscopy, 42 (2011) 1736–1742. [Google Scholar]
- [20].Hu Y, Feng S, Gao F, Li-Chan EC, Grant E, Lu X, Detection of melamine in milk using molecularly imprinted polymers–surface enhanced Raman spectroscopy, Food chemistry, 176 (2015) 123–129. [DOI] [PubMed] [Google Scholar]
- [21].Duan J, Yang M, Lai Y, Yuan J, Zhan J, A colorimetric and surface-enhanced Raman scattering dual-signal sensor for Hg2+ based on Bismuthiol II-capped gold nanoparticles, Analytica chimica acta, 723 (2012) 88–93. [DOI] [PubMed] [Google Scholar]
- [22].Zong S, Wang Z, Chen H, Hu G, Liu M, Chen P, Cui Y, Colorimetry and SERS dual-mode detection of telomerase activity: combining rapid screening with high sensitivity, Nanoscale, 6 (2014) 1808–1816. [DOI] [PubMed] [Google Scholar]
- [23].Cao Y, Jin R, Mirkin CA, DNA-modified core− shell Ag/Au nanoparticles, Journal of the American Chemical Society, 123 (2001) 7961–7962. [DOI] [PubMed] [Google Scholar]
- [24].Grabar KC, Freeman RG, Hommer MB, Natan MJ, Preparation and characterization of Au colloid monolayers, Analytical chemistry, 67 (1995) 735–743. [Google Scholar]
- [25].Ahern AM, Garrell RL, In situ photoreduced silver nitrate as a substrate for surface-enhanced Raman spectroscopy, Analytical Chemistry, 59 (1987) 2813–2816. [Google Scholar]
- [26].Kong XM, Chong XY, Squire K, Wang AX, Microfluidic diatomite analytical devices for illicit drug sensing with ppb-Level sensitivity, Sensors and Actuators B-Chemical, 259 (2018) 587–595. [DOI] [PMC free article] [PubMed] [Google Scholar]
- [27].Kong X, Yu Q, Zhang X, Du X, Gong H, Jiang H, Synthesis and application of surface enhanced Raman scattering (SERS) tags of Ag@ SiO 2 core/shell nanoparticles in protein detection, Journal of Materials Chemistry, 22 (2012) 7767–7774. [Google Scholar]
- [28].Mirkin CA, Letsinger RL, Mucic RC, Storhoff JJ, A DNA-based method for rationally assembling nanoparticles into macroscopic materials, Nature, 382 (1996) 607. [DOI] [PubMed] [Google Scholar]
- [29].Zhang X, Kong X, Fan W, Du X, Iminodiacetic acid-functionalized gold nanoparticles for optical sensing of myoglobin via Cu2+ coordination, Langmuir, 27 (2011) 6504–6510. [DOI] [PubMed] [Google Scholar]
- [30].Ghosh SK, Pal T, Interparticle coupling effect on the surface plasmon resonance of gold nanoparticles: from theory to applications, Chemical reviews, 107 (2007) 4797–4862. [DOI] [PubMed] [Google Scholar]
- [31].Basu S, Ghosh SK, Kundu S, Panigrahi S, Praharaj S, Pande S, Jana S, Pal T, Biomolecule induced nanoparticle aggregation: effect of particle size on interparticle coupling, Journal of colloid and interface science, 313 (2007) 724–734. [DOI] [PubMed] [Google Scholar]
- [32].Jiang R, Chen H, Shao L, Li Q, Wang J, Unraveling the evolution and nature of the plasmons in (Au core)–(Ag shell) nanorods, Advanced Materials, 24 (2012) OP200–OP207. [DOI] [PubMed] [Google Scholar]
- [33].Etchegoin PG, Le Ru EC, Basic electromagnetic theory of SERS, Surface Enhanced Raman Spectroscopy, (2011) 1–37. [Google Scholar]
- [34].Zheng J, Stevenson MS, Hikida RS, Van Patten PG, Influence of pH on dendrimer-protected nanoparticles, The Journal of Physical Chemistry B, 106 (2002) 1252–1255. [Google Scholar]
- [35].Haynes CL, McFarland AD, Van Duyne RP, Surface-enhanced Raman spectroscopy, in, ACS Publications, 2005. [Google Scholar]
- [36].Zhang XF, Zou MQ, Qi XH, Liu F, Zhu XH, Zhao BH, Detection of melamine in liquid milk using surface-enhanced Raman scattering spectroscopy, Journal of Raman Spectroscopy, 41 (2010) 1655–1660. [Google Scholar]
- [37].Xiong Z, Chen X, Liou P, Lin M, Development of nanofibrillated cellulose coated with gold nanoparticles for measurement of melamine by SERS, Cellulose, 24 (2017) 2801–2811. [Google Scholar]
- [38].Dörfler U, Feicht E, Scheunert I, S-triazine residues in groundwater, Chemosphere, 35 (1997) 99–106. [DOI] [PubMed] [Google Scholar]
- [39].Costa JC, Ando RA, Camargo PH, Corio P, Understanding the effect of adsorption geometry over substrate selectivity in the surface-enhanced Raman scattering spectra of simazine and atrazine, The Journal of Physical Chemistry C, 115 (2011) 4184–4190. [Google Scholar]
- [40].Pazos E, Garcia-Algar M, Penas C, Nazarenus M, Torruella A, Pazos-Perez N, Guerrini L, Vázquez ME, Garcia-Rico E, Mascareñas JL, Surface-enhanced raman scattering surface selection rules for the proteomic liquid biopsy in real samples: Efficient detection of the oncoprotein c-MYC, Journal of the American Chemical Society, 138 (2016) 14206–14209. [DOI] [PubMed] [Google Scholar]
- [41].Moskovits M, Suh J, Surface selection rules for surface-enhanced Raman spectroscopy: calculations and application to the surface-enhanced Raman spectrum of phthalazine on silver, The Journal of Physical Chemistry, 88 (1984) 5526–5530. [Google Scholar]
Associated Data
This section collects any data citations, data availability statements, or supplementary materials included in this article.


