

Abstract
Obesity and obesity-related metabolic disorders are linked to the intestinal microbiome. However, the causality of changes in the microbiome-host interaction affecting energy metabolism remains controversial. Here, we show the microbiome-derived metabolite δ-valerobetaine (VB) is a diet-dependent obesogen that is increased with phenotypic obesity and is correlated with visceral adipose tissue mass in humans. VB is absent in germ-free mice and their mitochondria but present in ex-GF conventionalized mice and their mitochondria. Mechanistic studies in vivo and in vitro show VB is produced by diverse bacterial species and inhibits mitochondrial fatty acid oxidation through decreasing cellular carnitine and mitochondrial long-chain acyl-CoAs. VB administration to germ-free and conventional mice increases visceral fat mass and exacerbates hepatic steatosis with Western diet but not control diet. Thus, VB provides a molecular target to understand and potentially manage microbiome-host symbiosis/dysbiosis in diet-dependent obesity.
The ongoing world-wide epidemic of obesity and its comorbidities is a major health challenge1, 2. While there are multiple contributing factors, emerging evidence links the epidemic to unfavorable changes in the composition and activity of the intestinal microbiota3–6. Given the complexity of an individual’s interacting genetic background, microbiome, and diet, application of new technologies to study these interactions may be key to personalized obesity management7.
Metabolomic profiling complements metagenomic methods by enabling detection and measurement of diverse small molecule products of both the microbiome and diet. In principle, this can be used for monitoring of intestinal microbiota functions in digestion of dietary macromolecules and microbial metabolites that may impact human metabolism8,9. For example, epidemiological and experimental evidence shows microbial products such as lipopolysaccharide10,11, phenylacetic acid12, and methylamines13,14 contribute to development of insulin resistance, hepatic steatosis, and cardiovascular disease. Untargeted metabolomic analyses of germ-free (GF) and conventional (C) mice with a reconstituted or intact microbiome show that approximately 10% of the circulating mammalian metabolome is of microbial origin15, with the majority of these metabolites unidentified16 and without defined functions. Therefore, identification and characterization of these microbially-derived metabolites may provide insight into how the microbiome regulates host metabolism and bioenergetics.
Among the known functions of microbiome-derived metabolites, quorum sensing compounds such as N-acyl lactones support communication within and between prokaryotic members of the microbiota17. Recent evidence for bi-directional communication between the microbiome and host mitochondria in metabolic health and disease18 raises the possibility that specific chemical signals also mediate a functional cross-talk between the microbiome and host mitochondria. Bi-directional communication is supported by reports of microbial metabolite effects on host mitochondrial function and metabolism19,20, and mitochondrial genetic effects on the composition of the microbiome 21. If the obesity epidemic is a consequence of changes to an evolved microbiome-host symbiosis affecting energy metabolism, then knowledge of the underlying chemical communication mechanisms may be key to remediation.
δ-Valerobetaine (VB) is a microbiome-derived metabolite
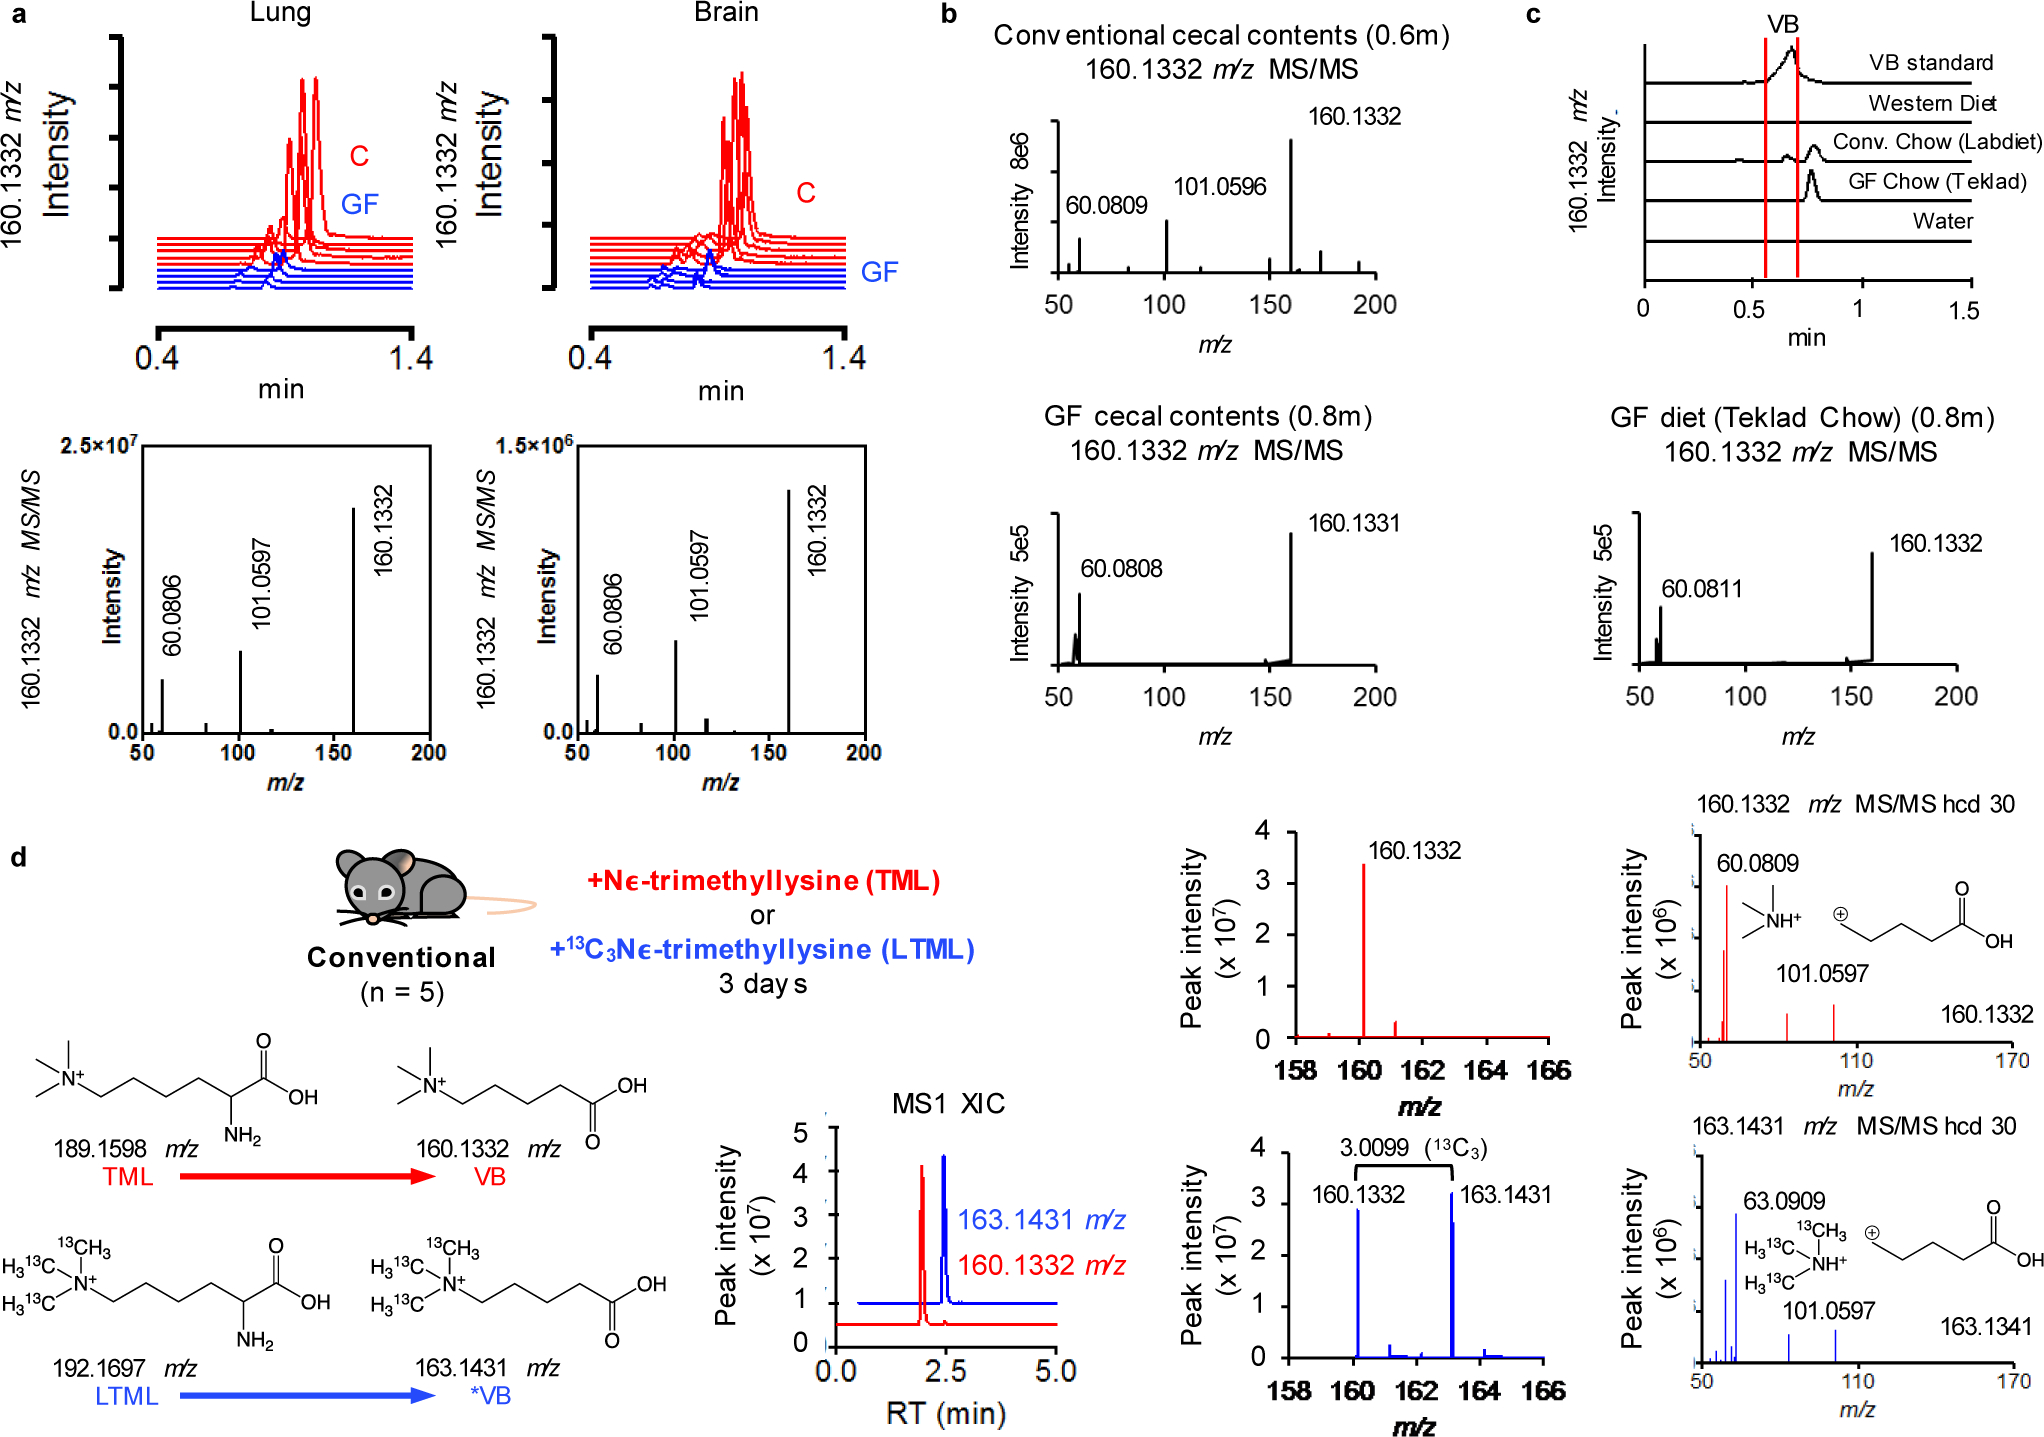
To identify microbial metabolites that could impact mitochondrial function, we split a cohort of GF mice into two groups at three weeks of age. For the next three weeks, one group remained GF while the other group was conventionalized (CV) by exposure to bedding from conventional (C) mice (animals with an intact microbiome). We compared the metabolome of liver and liver mitochondria from CV mice compared to GF mice. The top discriminatory metabolite had an accurate mass m/z of 160.1332 by ultra-high-resolution mass spectrometry (Fig. 1a), corresponding to predicted elemental composition C8H18NO2. This metabolite was found in liver and other tissues, portal and peripheral circulation, and cecal contents of conventional but consistently absent in germ-free mice (Fig. 1b; Extended data 1b). Authentic standard co-elution and MS/MS experiments show the identity of 160.1332 m/z to be δ-valerobetaine (VB) (Fig. 1c). Concurrent analyses of propionylcholine and valine betaine, similar molecules with identical elemental compositions, conclusively excluded these structures (Supplementary figure 1). VB was not present in the GF mouse diet or the diet used for conventionalization of GF mice (Extended data 1c, d). Furthermore, oral gavage of Nε, Nε, Nε-trimethyllysine increased circulating VB in conventional mice (Extended data 1e). Concentrations of VB in conventional mice were in the millimolar range in the cecum (320–560 μmol/kg wet weight), with somewhat lower concentrations in the colon (120–440 μmol/kg). Concentrations were 9–26 μM in the portal vein, with higher concentrations in the liver (75–190 μmol/kg) and lower concentrations in the peripheral plasma (2–10 μM) indicating tissue accumulation.
Fig. 1. δ-Valerobetaine (VB) is a microbiome-derived mitochondrial metabolite.
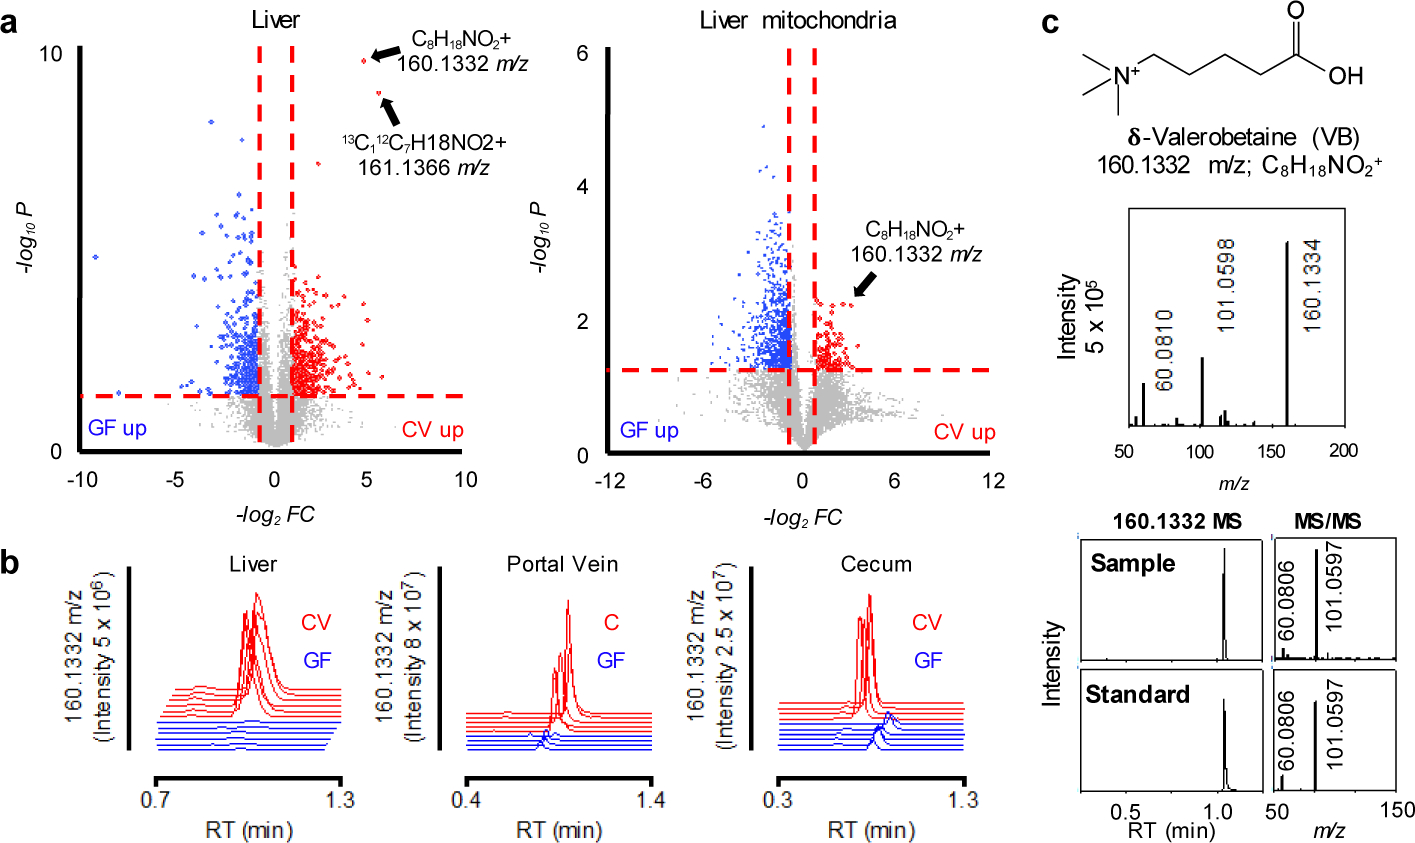
a) Volcano-plots of ultra-high-resolution mass spectrometry of extracts from germ-free (GF, blue, n = 6) and conventionalized (CV, red, n = 6) mouse liver and liver mitochondria show a metabolite with accurate mass m/z 160.1332 is higher in CV mouse liver and liver mitochondria. The accurate mass allows prediction of an elemental composition C8H18NO2. The horizontal broken line is at limma FDR (Benjamini-Hochberg) corrected p-value = 0.05, and the vertical broken line is at fold-change (FC) equal two. A list of differentially expressed annotated features is provided in the source data file. b) 160.1332 m/z is detected in liver, portal vein, and cecum of mice with intact microbiome (red extracted ion chromatograms) but not in germ-free mice (blue extracted ion chromatograms). c) Experimental confirmation that the chemical structure of m/z 160.1332 is VB is provided by co-elution and fragmentation pattern for experimental sample and synthesized standard. High-resolution tandem mass spectral analysis shows the characteristic fragmentation pattern of m/z 160.1332 includes the trimethyl ammonium product ion, 60.061 m/z and C5H9O2+, 101.06 m/z. VB standard was synthesized and structure confirmed by 1H-nuclear magnetic resonance spectroscopy (Supplementary figure 2).
To determine whether intestinal microbes produce VB, we performed ex vivo incubations of cecal contents from conventional and GF mice. LC-HRMS analyses show only conventional cecal contents produced VB whereas GF cecum contents did not (Fig. 2a). Incubations of candidate microbes from diverse taxa of gram positive and gram negative pathogenic and commensal bacteria, including lactobacilli, E. coli, Salmonella typhimurium (SL1344), anaerobic Bifidobacterium longum, and others showed that VB is produced by monocultures of different and diverse microbes (Fig. 2b). Furthermore, broad spcctrum antibiotic treatment for 5 days decreased circulating VB in conventional mice by approximately 25% (Fig. 2c). Taken together, the presence of VB in different tissues and isolated mitochondria of mice with an intact microbiome therefore reflects microbial production, followed by absorption and distribution.
Figure 2. δ-Valerobetaine (VB) is a microbiome-derived metabolite.
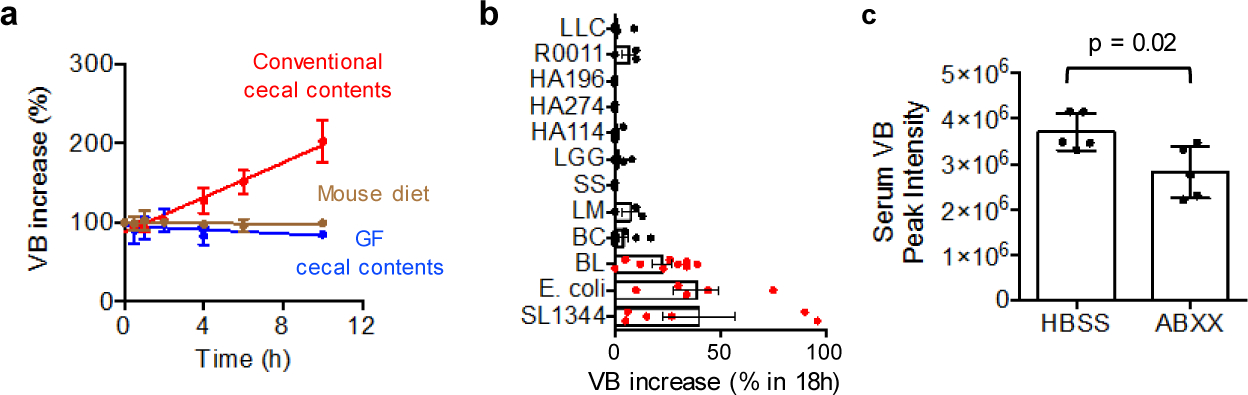
a) Proof that VB is generated by the microbiome is obtained by mass spectrometry detection of time-dependent increase in m/z 160.1332 in ex vivo incubation of cecum contents of mice with intact microbiome (red) Linear regression (F = 165.4, p < 0.0001, 95% confidence interval for slope (9.186 to 12.76). Cecum contents from germ-free mice did not generate VB (blue) (F = 2.332, p = 0.1462, slope CI (−2.997 to 0.4872)), and control incubation of mouse food showed no generation of VB (brown) (F = 0.3341, p = 0.5701, slope CI (−1.127 to 0.6393) (n = 3 biological replicates per group). Cecal contents and food were submerged in MRS media. b) Multiple species of commensal and pathogenic bacteria generate VB as shown by time dependent increase in VB (m/z 160.1332) in monocultures. Species included Lactococcus lactis Subsp. cremoris (LC, ATCC 19257), Lactobacillus rhamnosus GG (LGG, ATCC 53103), Lactobacillus rhamnosus (HA-114, R0011), Bacillus cereus (BC), E. coli (K12) [One-sample t-test (H0 = 0), p = 0.024], Streptococcus salivarius (SS), Listeria monocytogenes (LM), Salmonella typhimurium (SL1344) [One-sample t-test (H0 = 0), p = 0.067], and Bifidobacterium longum (LM) [One-sample t-test (H0 = 0), p = 0.0032]. Data are presented as fold-change (%) at 18h compared with initial sample for at least 3 replicates of each monoculture (± SEM). This experiment was designed to test for generation of VB and used different culture conditions for different species; consequently, the relative productions may not be representative of enteric generation. c) 5 day oral gavage of broad spectrum antibiotics [200 microliters of ampicillin (1 mg/mL), gentamicin (1 mg/mL), metronidazole (1 mg/mL), neomycin (1 mg/mL), vancomycin (1 mg/mL)] decreased (p = 0.01, one-tailed t-test) circulating VB in conventional mice.
VB decreases mitochondrial fatty acid oxidation
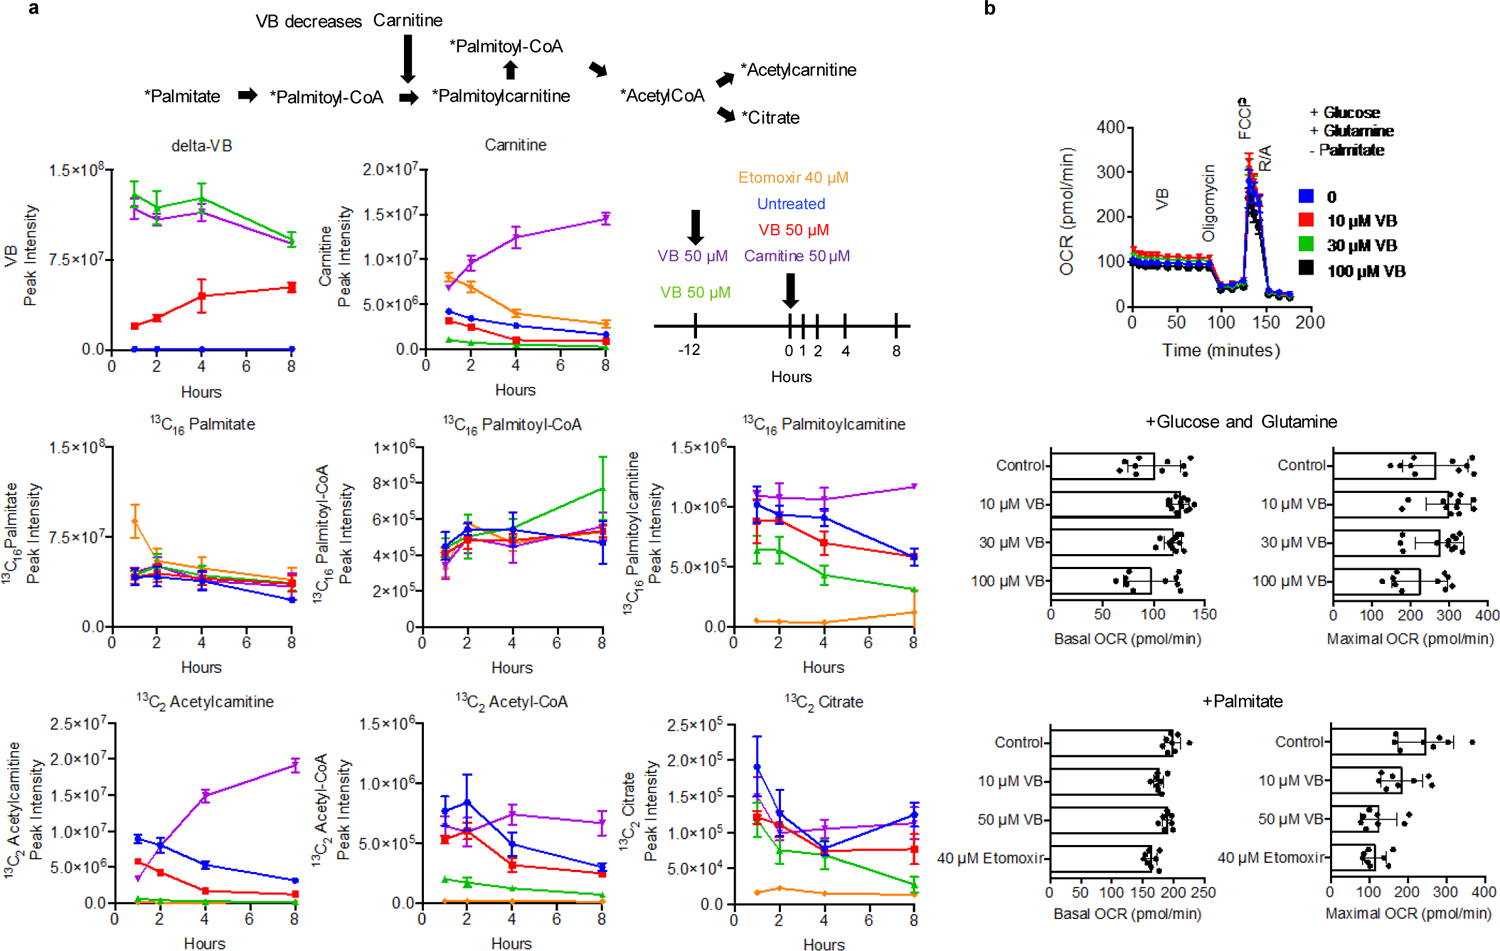
We performed dose-response experiments with VB in vitro (Fig. 3a) to examine metabolic effects of VB. The mitochondrial carnitine shuttle was the top metabolic pathway associated with VB treatment in human HepG2 cells (Fig. 3b). At 10 μM, equivalent to VB present in conventional mouse portal circulation, the cell content of carnitine was decreased to half that of control cells. The carnitine shuttle uses carnitine for transport of long-chain fatty acyl chains into mitochondria for fatty acid β-oxidation. Under culture conditions mimicking fasting (no glucose/pyruvate/glutamine), VB elicited a dose-dependent decrease in palmitate-dependent mitochondrial oxygen respiration (Fig. 3c). The effect of VB on inhibition of palmitate-dependent oxygen consumption rate was confirmed by stable isotope tracer studies of palmitate metabolism, which showed that VB inhibits formation of 13C16 palmitoylcarnitine from 13C16 palmitate and decreases the formation of 13C2 acetyl-CoA (Fig. 3d). Rescue experiments showed that addition of carnitine restores cellular carnitine and formation of palmitoylcarnitine (Extended data 2a). Thus, VB inhibited mitochondrial long-chain fatty acid metabolism through effects on carnitine and operation of the carnitine shuttle. Control experiments for studies of palmitate-dependent O2 consumption rate showed that when glucose, glutamine, and pyruvate are present at high concentration in the culture media, VB caused little decrease in basal O2 consumption rate, ADP-linked O2 consumption rate, spare capacity (maximal respiration – basal respiration), or non-mitochondrial respiration (Extended data 2b). These data show the effect of VB on fatty acid β-oxidation for mitochondrial energy production is dependent on the availability of other (glucose/glutamine) fuel substrates.
Fig. 3. Valerobetaine (VB) decreases fatty acid oxidation.
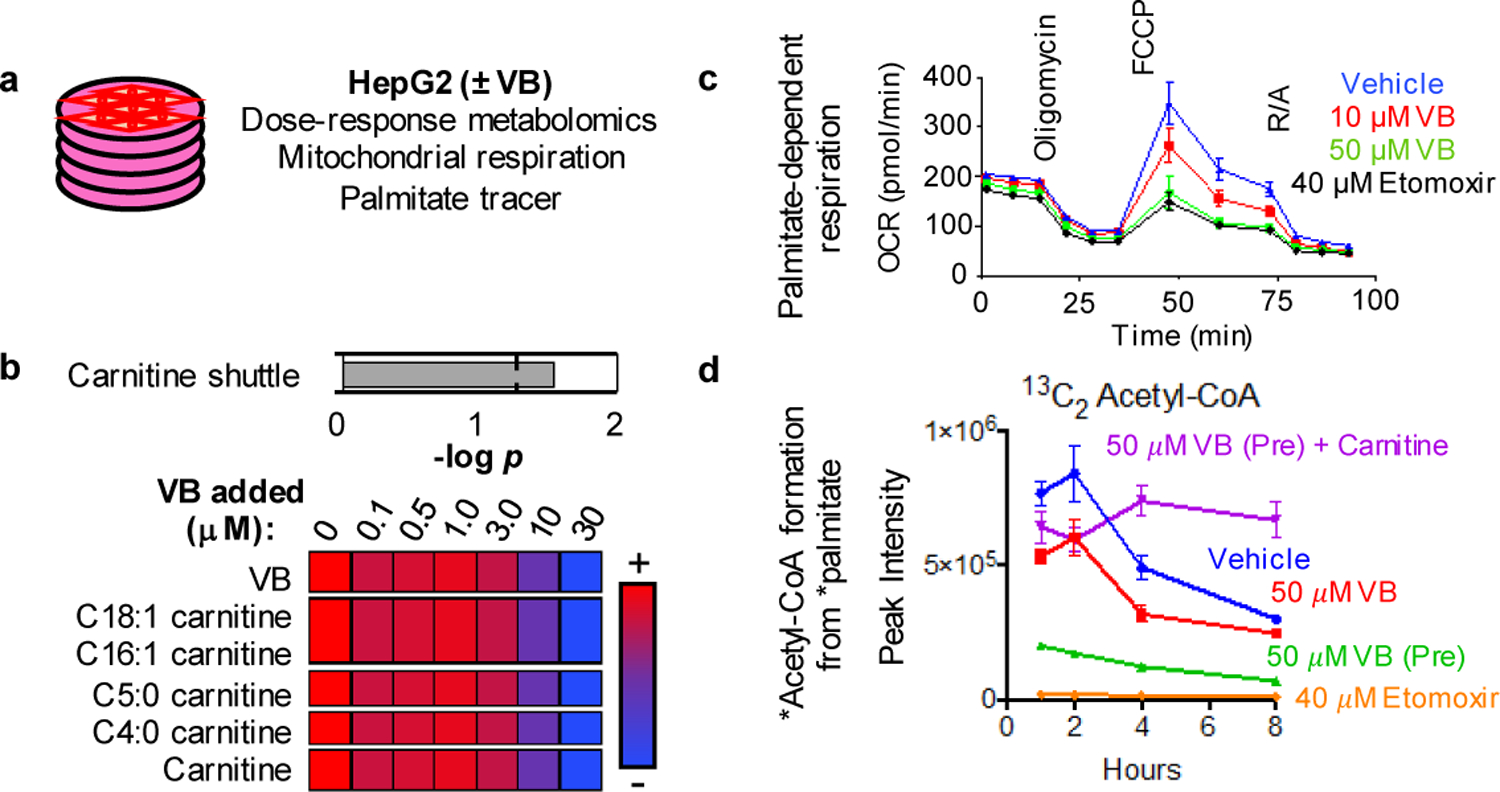
a) Experimental in vitro characterization of VB activity in HepG2 cells. b) VB alters carnitine shuttle metabolism (p < 0.05, mummichog pathway enrichment analysis) and decreases carnitine and acylcarnitines in cultured cells treated with 12h with VB at indicated concentrations (n = 8 each concentration). Spearman correlation analysis with Benjamini-Hochberg FDR corrections were used to identify metabolites with a dose-response relationship with VB-treatment. Data are presented as average relative intensities per treatment with red being the highest relative intensity and blue being the lowest. c) Mitochondrial palmitate-dependent O2 consumption rate is inhibited by VB. HepG2 cells were incubated for 12 h without glucose, glutamine and pyruvate and studied with either vehicle, 10 or 50 μM VB. Effect of VB is most pronounced in the spare capacity measured after addition of the uncoupler FCCP (ANOVA (F = 10.48, p < 0.0001) with post-hoc test for linear trend (R2 = 0.4905, p < 0.0001, Slope −22.79). Data presented are 6–8 biological replicates ± standard error of the mean. d) VB decreases formation of labeled acetyl-CoA from labeled palmitate in cultured HepG2 cells (n = 3 biological replicates for each treatment, Ordinary one-way ANOVA of Area Under the Curve (F = 60.59, p < 0.0001) with Tukey’s multiple comparisons test showing significance between Untreated and VB treated, but not between Untreated and VB + carnitine treated).
VB increases lipid accumulation in mouse tissues
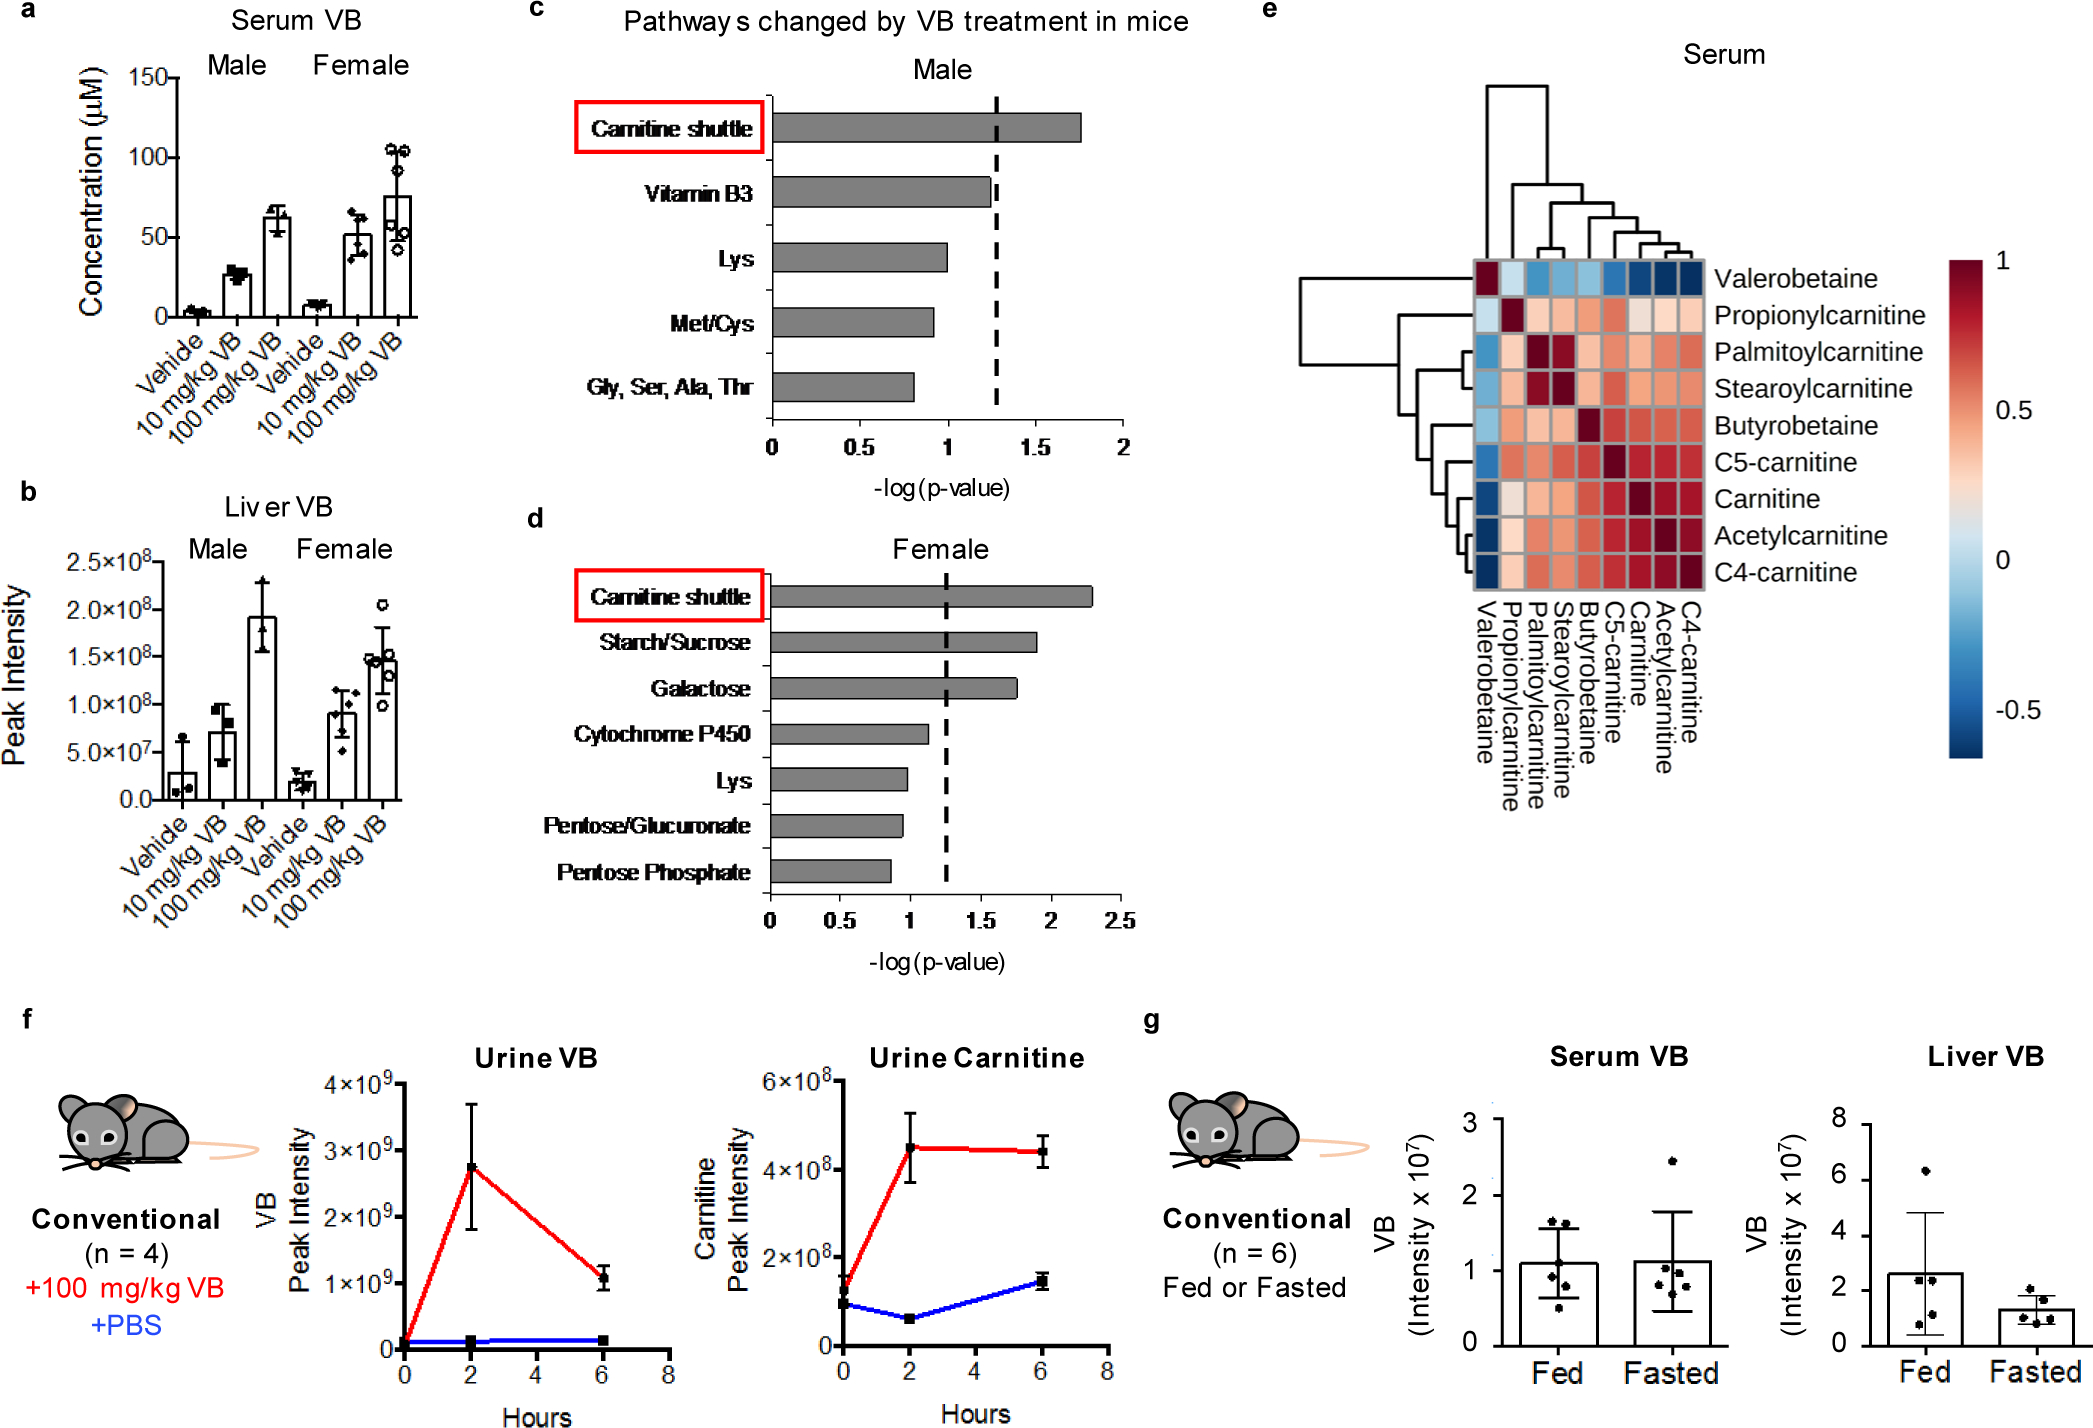
A consequence of decreased mitochondrial fatty acid oxidation during fasting is accumulation of lipids in the liver and other tissues. To test whether VB treatment caused lipid accumulation in vivo, we performed short-term VB treatment experiments in conventional mice (Fig. 4a). VB treatment increased circulating and hepatic VB (Extended data 3a, b). Similarly, as observed in cells, the carnitine shuttle was the top metabolic pathway associated with VB treatment in mice (Extended data 3c,d). VB treatment decreased circulating (Fig. 4b), hepatic (Fig. 4c), heart, and brain carnitine (Supplementary figure 3). Decreases in systemic carnitine were accompanied by increased carnitine in the urine (Extended data 3f). Furthermore, VB treatment altered circulating and systemic acylcarnitine and acyl-CoA profiles (Fig. 4d, Supplementary figure 3). In whole tissue, VB increased hepatic (Fig. 4d) and cardiac palmitoyl-CoA (Supplementary figure 3) and decreased other short, medium, and long-chain acylcarnitines and CoAs under fasted conditions. In mitochondria, VB decreased the abundance of long-chain fatty acyl-CoAs and carnitines (Fig. 4e, Supplementary figure 3), consistent with accumulation of long-chain acyl-CoAs accumulating in cytoplasm and decreased carnitine-dependent transport of long-chain acyl groups into mitochondria for long-chain fatty acid β-oxidation. There was no difference in circulating or hepatic VB between the fasted or fed state (Extended data 3g). VB also decreased circulating and hepatic β-hydroxybutyrate, a product of mitochondrial β-fatty acid oxidation (Extended data 4). Additionally, Oil Red O staining of liver showed VB treatment increased macrosteatotic lipid deposits, especially under fasted conditions (Fig. 4f), and liver triglycerides, the storage form of excess lipids, increased after fasting in both male and female mice (Fig. 4g),. Finally, lipid profiling showed that VB treatment increases triacylglycerol and diacylglycerol species in liver, heart, and brain (Extended data 5). Taken together, these data show VB causes systemic carnitine insufficiency, resulting in a decrease in mitochondrial long-chain fatty acid β-oxidation and tissue fat accumulation.
Fig. 4. VB increases lipid accumulation in host tissues.
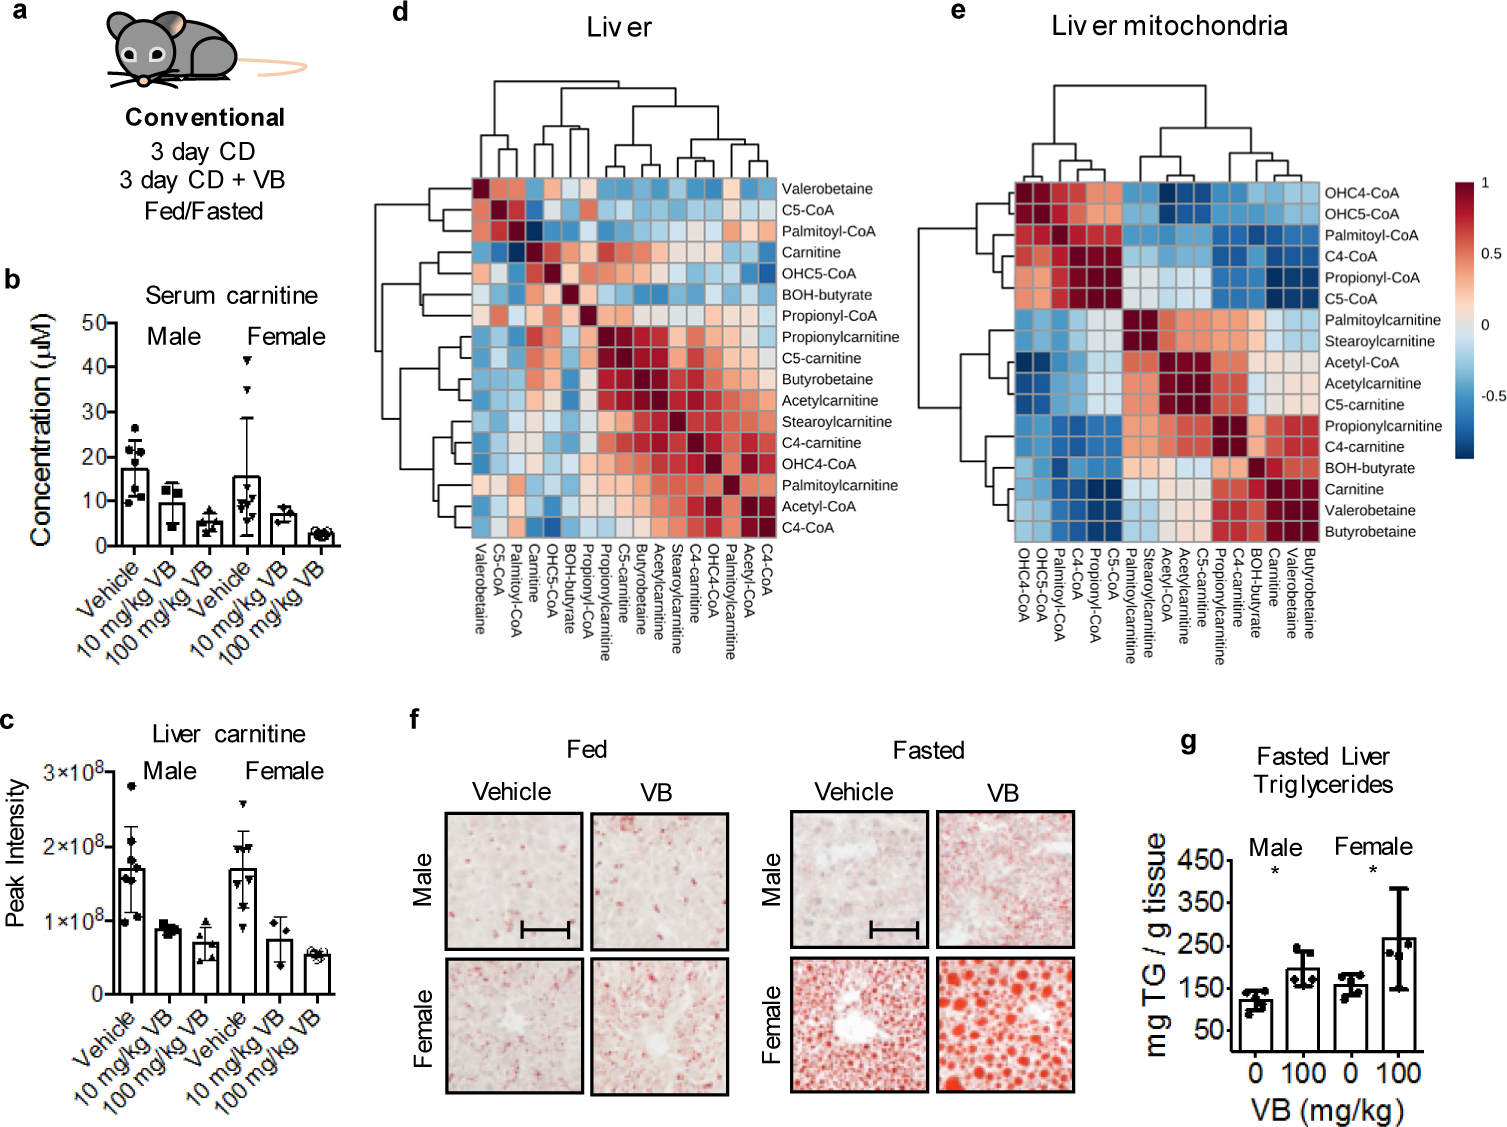
a) Experimental in vivo characterization of VB activity in mice. Mice of each sex were given daily intraperitoneal injection with saline (n = 5), VB at 10 mg/kg (n = 3), or VB at 100 mg/kg (n = 8) for 1 week. b, c) VB decreases circulating and hepatic carnitine in mice. Mice of each sex were given daily intraperitoneal injection with saline (n = 5), VB at 10 mg/kg (n = 3) or VB at 100 mg/kg (n = 8) for 1 week. Kruskal-Wallis test with Dunn’s multiple comparisons test to identify pairwise differences. Serum male (KW statistic – 9.02, p = 0.0029); female serum carnitine (KW statistic 10.98, p = 0.0004); male liver carnitine (KW statistic 11, p = 0.0003); female liver carnitine (KW statistic 10.83, p = 0.0004). d) VB is correlated with increased hepatic palmitoyl-CoA and palmitoylcarnitine in the fasted state. Spearman correlations for selected metabolites in carnitine shuttle metabolism and VB. e) VB is correlated with decreased mitochondrial long chain acylcarnitine and CoAs. f, g) VB exacerbates hepatic steatosis in male and female mice under fasted conditions as measured by Oil Red O staining (Males p = 0.0457, 1-tailed t-test; Females p = 0.0184, 1-tailed t-test) and triglyceride analysis (Males p = 0.0039, 1-tailed t-test; Females p = 0.0278, One-tailed Mann-Whitney). Mice of each sex were given daily intraperitoneal injection with saline (n = 5) or VB at 100 mg/kg (n = 5) for 3 days ± fasting. Scale bar represents 100 μm.
VB treatment worsens Western Diet induced adiposity in mice
VB effects in fasting are particularly intriguing as a mechanism causing obesity because decreasing mitochondrial β-oxidation of lipids mobilized from adipose tissue during fasting could cause a long-term increase in fat deposition. Therefore, we tested whether long-term VB treatment could increase weight gain and adiposity in mice. We tested this in both GF and conventional mice, with or without a high fat/sugar Western diet (WD), since previous studies showed that GF-mice were protected from WD induced obesity22. In GF mice, VB was dosed parenterally to achieve concentrations similar to VB concentrations observed in untreated conventional mice which also resulted in carnitine concentrations equivalent to conventional mice (Extended data 6a, b). Six weeks of VB treatment increased weight gain in GF mice fed a WD (Fig. 5a), characterized by increased adipose tissue fat mass (Fig. 5b–d), with substantial increases in perigonadal visceral (VAT), posterior subcutaneous (SubQ), and interscapular brown adipose (BAT) compartments compared to GF mice administered a WD alone. Furthermore, VB treatment exacerbated the development of hepatic steatosis in these mice (Fig. 5e, f). Similarly, we found that VB increased adipose tissue fat mass (VAT, SubQ, BAT) in conventional mice after 8-weeks (Fig. 5h–j, Extended data 7a) with the WD. The relative increases were most pronounced in white adipose compartments (VAT, SubQ) where fat mass in VB-treated GF and conventional mice on a WD was increased over 80% compared to WD alone. We observed trends for increase in severity of hepatic steatosis and total body mass in VB-treated conventional mice with the WD, and while there was a significant increase in body mass observed in the first ten days of the experiment, these did not reach a significant difference after 8 weeks (Fig. 5g, k, l). Although WD fed mice gained more weight than control fed mice, no differences in circulating VB were observed between WD or control diet-fed conventional mice (Extended data 7b). These effects were not observed in GF or conventional mice fed the control diet, and were not associated with increased inflammatory markers (IL-6, TNF-α, MCP-1) changes to insulin signaling (insulin, glucagon, resistin) either with the WD or the addition of VB to the WD in conventional mice (Extended data 8a,b). Thus, the long term consequences of VB inhibition of mitochondrial β-oxidation of fatty acids in conjunction with a WD causes pronounced effects on increasing visceral adipose tissue mass in both GF and conventional mice.
Figure 5. Long-term valerobetaine (VB) treatment in GF and conventional mice.
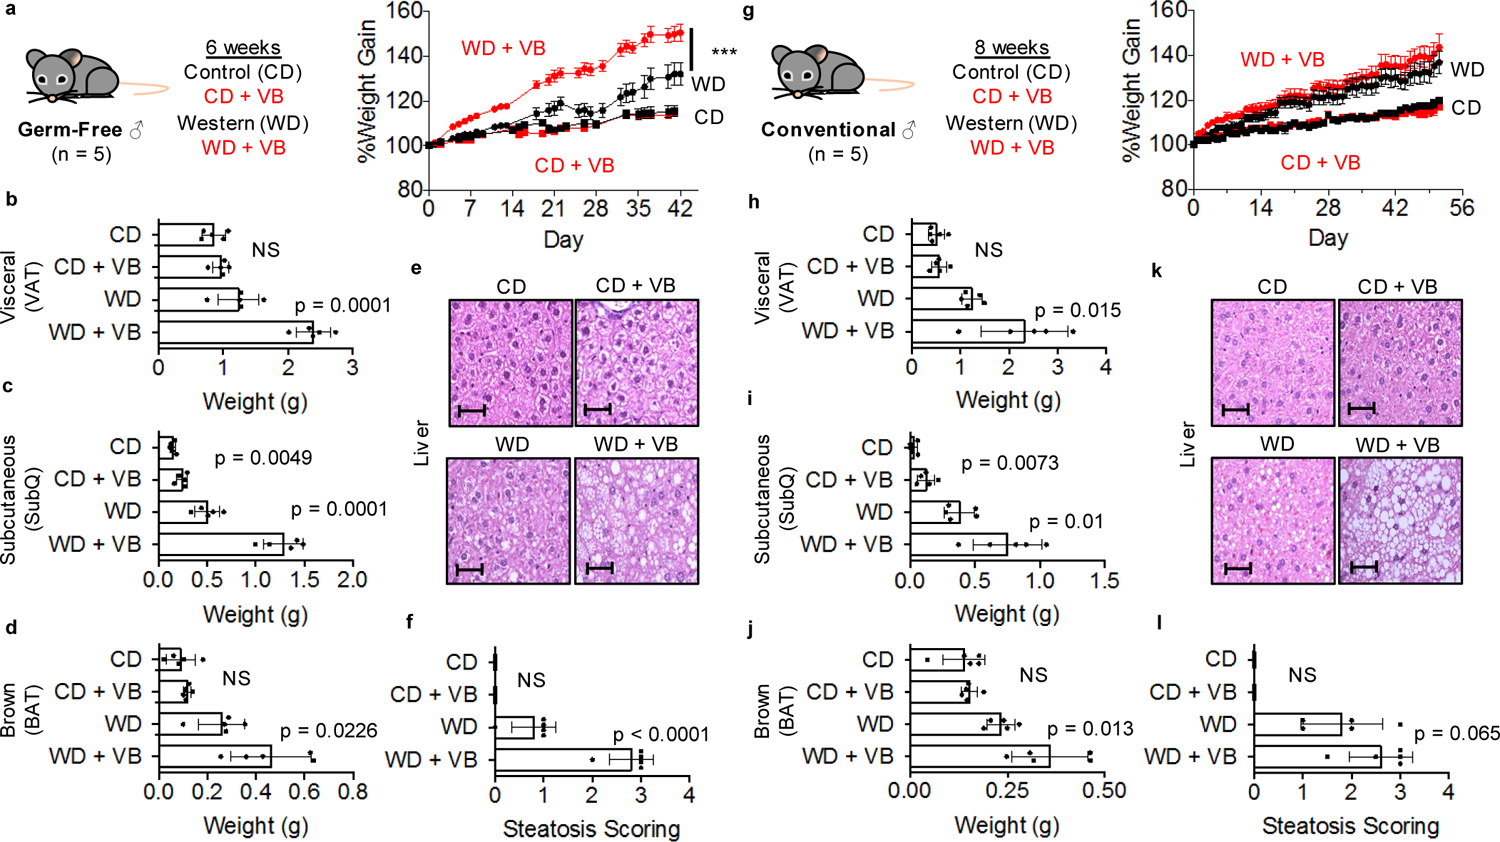
a) Male GF mice were administered PBS or VB in conjunction with a control diet (CD) or western diet (WD) for 6 weeks with body weight recorded as percent weight gain. (2-way repeat measures ANOVA with multiple comparisons per day, VB treatment with WD F = 17.19, p = 0.0032, AUC p-value = 0.0028; VB treatment with CD F = 0.4609, p = 0.5164, AUC p-value = 0.5164) Weight of b) visceral adipose tissue (VAT), c) Subcutaneous white adipose tissue (SubQ), d) brown-adipose tissue (BAT) in GF mice after 6 weeks. e) Representative liver hematoxylin and eosin (H&E) stains for each GF group under 40x magnification. Scale bar represents 50 μm. f) Scoring of hepatic steatosis from H&E from GF mice. g) Male conventional mice were administered PBS or VB in conjunction with a CD or WD for 8 weeks with body weight recorded as percent weight gain. Weight of h) VAT, i) SubQ, j) BAT in conventional mice after 8 weeks. (2-way repeat measures ANOVA with multiple comparisons per day, VB treatment with WD F = 1.218, p = 0.3019, AUC p-value = 0.1462; VB treatment with CD F = 0.4609, p = 0.5164, AUC p-value = 0.4917) k) Representative liver H&E stains for each conventional group under 40x magnification. Scale bar represents 50 μm. l) Scoring of hepatic steatosis from H&E from conventional mice. One-way student’s t-test (n = 5, p < 0.05) used for comparisons unless otherwise noted.
VB reprograms hepatic lipid and mitochondrial metabolism
Population-wide shifts in diet represent an evolutionary pressure on the interaction between the microbiome and host metabolism. To test whether transcriptional responses impacting mitochondrial function occurred following acquisition of a microbiome, we studied transcriptional responses in GF mice to microbiome acquisition (CV). RNA-seq analysis showed that microbiome acquisition in GF mice upregulated mitochondria and lipid metabolism/transport pathways linked to activation of Ppar-α (Fig. 6a, Extended data 9a). More specifically, genes encoding mitochondrial energy production and fatty acid oxidation [Sdh (Sdha, Sdhb, Sdhd), Nduf (multiple Ndufs), Atp5 (Atp5f1, Atp5d, Atp5g3, Atp5b, Atp5a1, Atp5c1), Cyc1, Cox5a, Vdac (Vdac1, Vdac2, Vdac3), Hadh (Hadh, Hadha, Ehhadh), Acsl5, Eci1, Acaa1b], TAG biosynthesis [Agpat (Agpat2, Agpat3), Dgat2, Gpat3], and lipoprotein export [Apoa (Apoa1, Apoa4, Apoa5), Apob, Apoc (Apoc2, Apoc3), Apoe, Mttp, Pdia (Pdia3, Pdia4, Pdia6] were increased in CV mice (Fig. 6b). Upregulation of many of these genes in CV mice was linked to transcriptional activation of Ppar-α (Agpat2, Apoc2, Acot1, Acsl5, Sdhd, Hmgcl, Crat, Cyp4a14). As VB elicited a dose-dependent increase in PPAR-α response element-linked luciferase activity in cultured cells (Fig. 6c), we predicted that some transcriptional responses observed in conventionalized mouse liver could be directly attributed to the introduction of VB into GF mice. Indeed, VB-treatment in control diet fed GF mice altered the expression of mitochondria associated genes, and increased expression of genes related to lipid metabolism linked to activation of Ppar-α (Fig. 6d, e). More specifically, genes encoding for transcription factors important for regulation of fatty acid metabolism [Ppara, Pparg, Rxra, Crebbp, Fxr, Sirt1, Ppargc1b], mitochondrial energy production and fatty acid metabolism [Sdha, Hadha, Hadhb, Slc27a5, Cpt1a, Acox1, Acadl, Eci2, Fads, Acadl], TAG biosynthesis [Agpat3, Dgat2], and lipoprotein export [Apob, Apoa5] were upregulated by VB treatment with the control diet. Furthermore, many of these changes were linked to activation of Ppar-α regulated genes [Cyp4a14, Ncoa2, Cpt1a, Crebbp, Chd9, Nr1d1, Apoa5, Med17, Rxra, Pparg, Hmgcs2, Ppara, Ppgargc1b, Tead3] (Fig. 6e). Conversely, VB treatment in WD-fed GF mice downregulated mitochondria, lipid, and Ppar-α related genes (Fig. 6f, Extended data 9a, b) – illustrating how diet quality impacts transcriptional responses to VB. Taken together, these data show how microbially-derived VB interacts with dietary factors to drive transcriptional regulation of lipid processing and mitochondrial energy metabolism in the liver.
Fig. 6. VB participates in microbiome-mitochondria communication to reprogram host lipid metabolism.
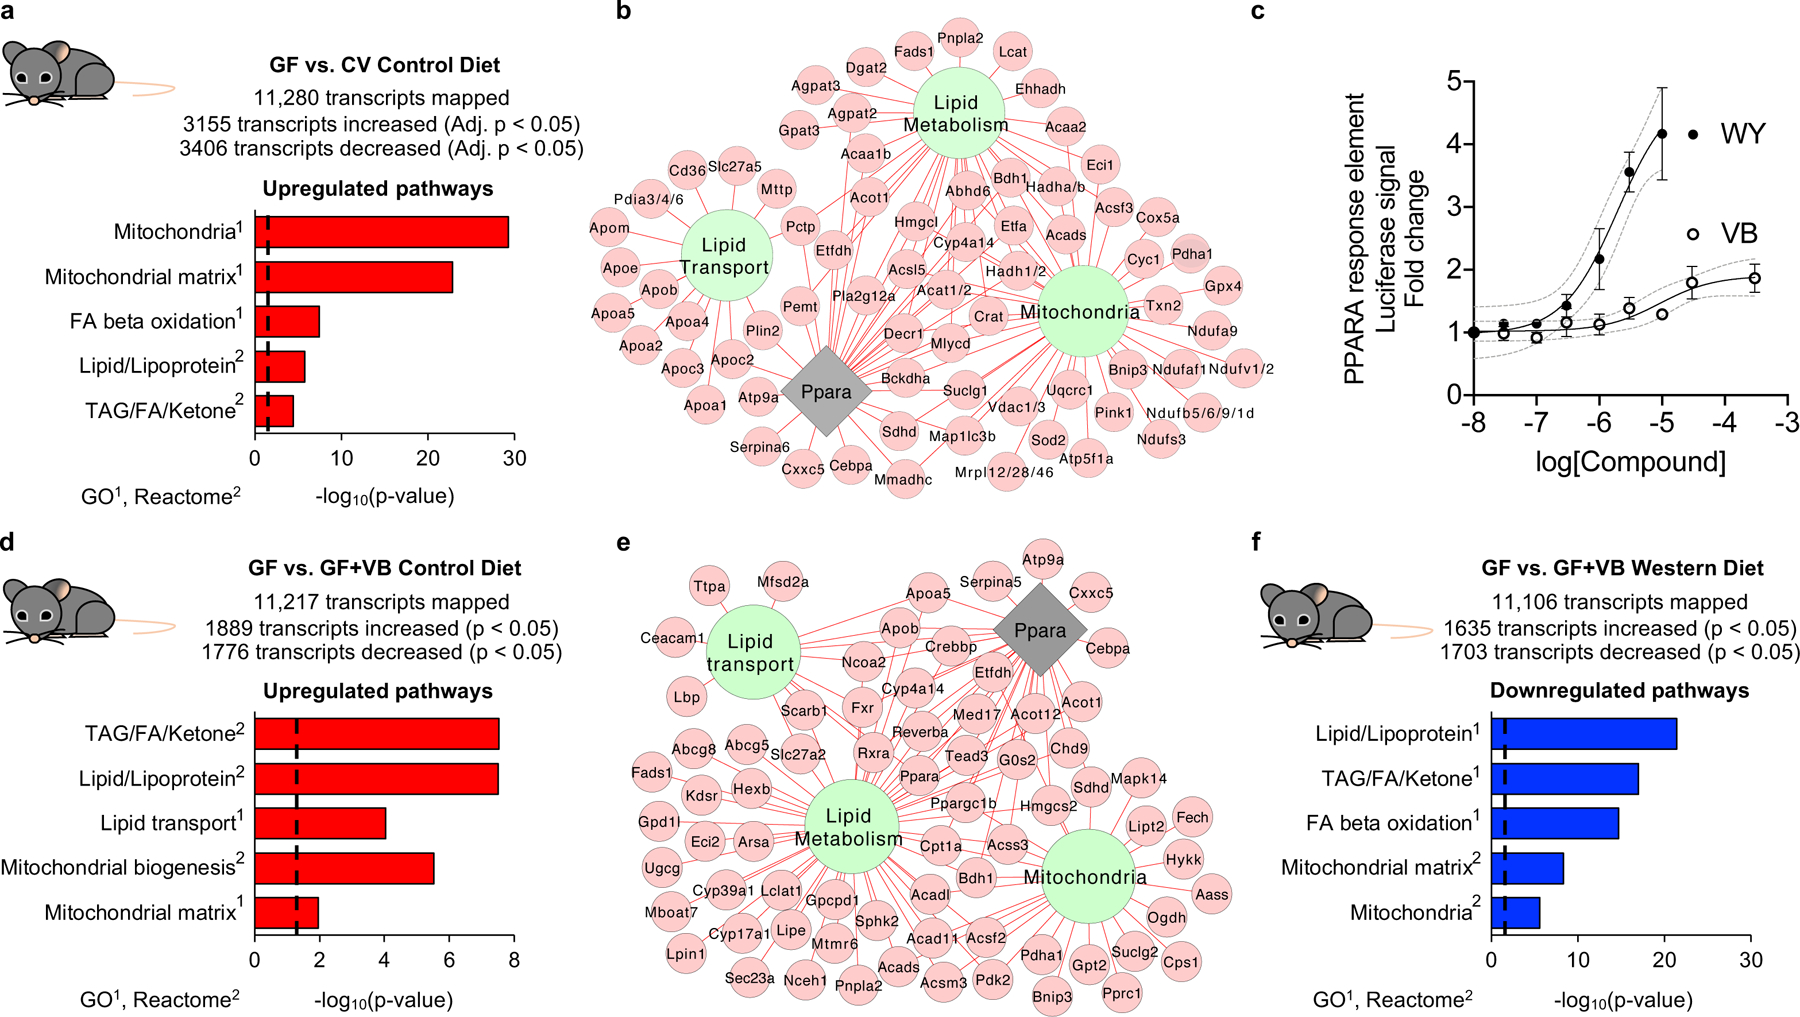
a) Mitochondria and lipid pathways are the top transcriptome pathways upregulated in mouse liver following microbiome acquisition [conventionalized mice (CV)] (n = 6 per group). Results from differential expression analysis were filtered with a Benjamini-Hochberg FDR < 0.05 and increased by 2-fold in CV mice over GF mice samples for pathway enrichment analysis. b) Gene expression for mitochondrial energy metabolism, FA uptake, FA oxidation, TAG biosynthesis, and lipoprotein assembly and export are increased (Benjamini-Hochberg FDR < 0.05, FC > 2) in CV mice. Many of these changes were linked to activation of Ppar-α. c) VB treatment elicits a dose-dependent increase in PPAR-response element linked luciferase activity in HepG2 cells. The calculated EC50 for VB is 14 μM, similar to concentrations observed in the portal circulation of conventional mice. Data for Wy14643, a synthetic PPAR-alpha agonist (EC50 = 1.9 μM), shown for comparison. Data are displayed as the mean ± S.D. of 3 biological replicates. d) Mitochondria and lipid pathways are upregulated in GF mice treated with VB (n = 5 per group). Transcripts increased (raw p-value < 0.005, FC > 1.2) in VB-treated control diet fed GF mice were used for pathway enrichment analysis. e) Gene expression for mitochondria and lipid pathways linked to Ppar-α activation are upregulated (raw p-value < 0.005, FC > 1.2) by VB treatment in GF mice with the control diet. f) Mitochondria and lipid pathways were downregulated by VB treatment in GF mice with the Western diet. Transcripts decreased (raw p-value < 0.005, FC < 0.8) in VB-treated Western diet fed GF mice were used for pathway enrichment analysis. For b and e, green nodes indicate Reactome pathways or gene ontologies, the grey node represents transcription factor enrichment, red edges/nodes indicate increased transcript abundance.
Clinical associations of plasma VB
To test whether changes in the microbiome could impact circulating VB in humans, we measured circulating VB in participants of a clinical trial of fecal microbiome transplantation (FMT). Participants were randomized to initial bowel purge with polyethylene glycol (prep) or prep plus fecal enema (FMT) (Fig. 7a), with longitudinal follow-up. In both randomization groups, circulating VB increased in 11 out of 15 individuals (χ2 = 11.2, DF 2, p = 0.0037) after the procedure (Fig. 7b). We also observed increases in plasma short-chain acylcarnitines (Fig. 7c) and decreases in long-chain acylcarnitines (Fig. 7d).
Figure 7. Clinical associations of plasma VB with microbiome manipulation and obesity-related phenotypes in people.
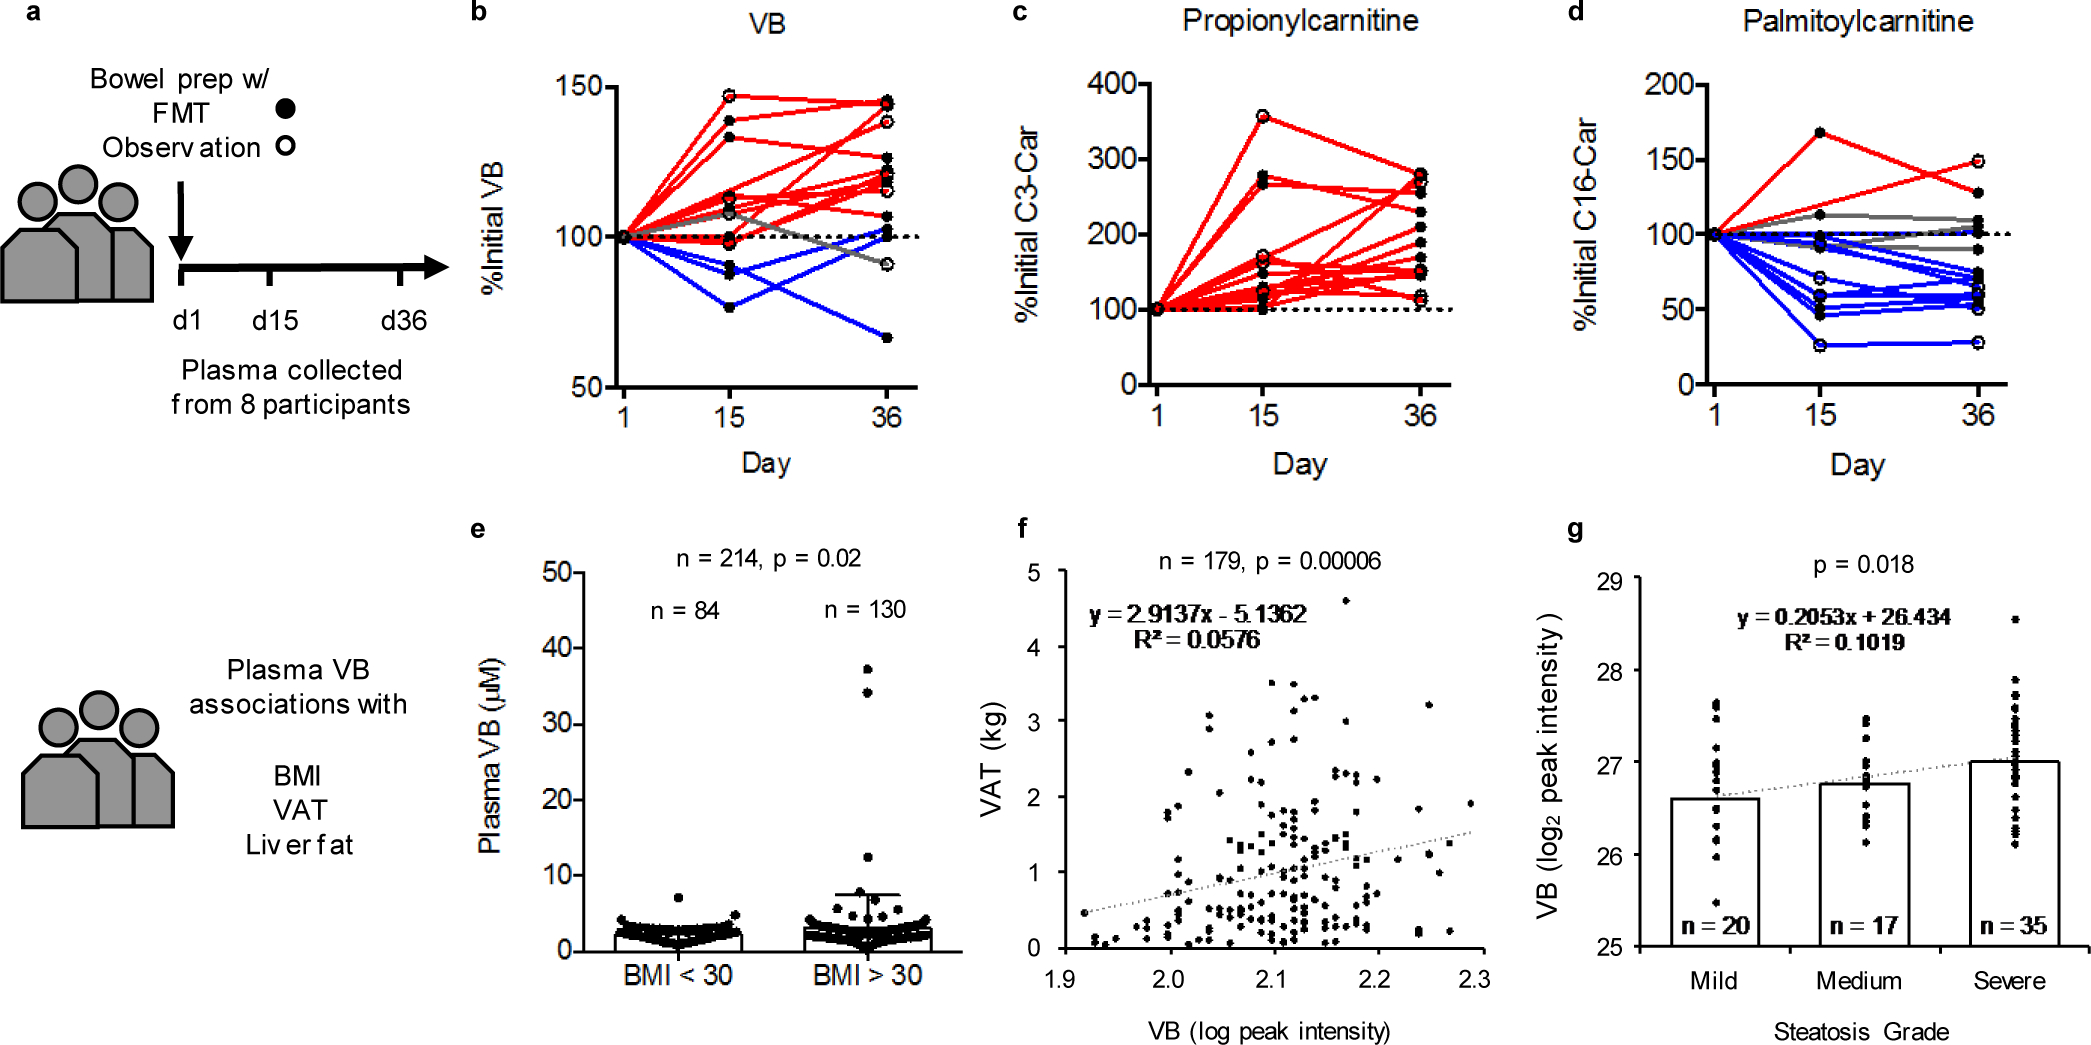
a) Fecal microbiota transplantation (FMT) clinical trial design at Emory University Hospital. b) Circulating VB increases in 11 out of 15 cycles following treatment (χ2 = 11.2, DF 2, p = 0.0037). c) Circulating propionycarnitine increases in all cycles following treatment (χ2 = 30, DF 2, p < 0.0001). d) Circulating palmitoylcarnitine decreases in 10 out of 15 cycles following treatment (χ2 = 7.6, DF 2, p = 0.0224). e) In a subclinical population of individuals without diagnosis of disease, individuals with BMI > 30 (n = 130) have higher VB concentration than individuals with BMI < 30 (n=84) (One-tailed t-test (p = 0.0213) with Welch’s correction, F, DFn, Dfd: 20.79, 129, 83, p < 0.0001). f) Plasma VB is correlated with increased central adiposity in adults (Visceral Adipose Tissue mass, n = 179, p = 0.00006). g) Plasma VB is positively associated with severity of hepatic steatosis in adolescents (n = 74, β = 0.345, p < 0.02).
To test whether VB was associated with obesity-related phenotypes, we measured plasma VB in 130 individuals with Body Mass Index (BMI) > 30 without overt disease compared to 84 individuals from the same cohort with BMI < 30. The results show that average VB concentrations in the individuals with BMI > 30 is approximately 40% higher than individuals with BMI < 30 (Fig. 7e). Additionally, in a subset of these individuals (n = 143), we observed a positive association between urinary carnitine and urinary VB (Extended data 10). Reanalysis of plasma VB measures from a previously published dataset23 of adults (n = 179, mean age 50 years, males = 63, females = 116) with measures of visceral adipose tissue mass (VAT) shows a positive correlation of plasma VB with VAT (β = 3.7E+04 ± 1.1E+04, p = 0.0006), independent of age, race, and sex (Fig. 7f). Similarly, a study of serum VB in youth with biopsy-proven NAFLD (n = 74, mean age 14 y, males = 54, females = 20)24 shows an association of plasma VB with hepatic steatosis (Fig. 7g). Circulating VB levels were 40% higher with severe steatosis (>66% steatosis) compared to mild steatosis (<33% steatosis; β = 0.328, p = 0.03, linear regression adjusted for age, sex, and race).
Discussion
Here, we show that delta-valerobetaine (VB) is a microbially-derived diet-dependent obesogen that decreases systemic carnitine and inhibits mitochondrial fatty acid oxidation. GF and conventional mice treated with VB were more susceptible to diet-induced obesity, as they gained more weight and had increased adipose tissue mass when fed a WD. VB treatment in control diet fed GF and conventional mice did not result in these changes. With the control diet, VB treatment caused upregulation of genes related to mitochondrial function, lipid metabolism and transport. However, with the WD, VB treatment led to downregulation of genes related to mitochondrial function, lipid metabolism and fatty acid oxidation. Circulating VB increased in people following microbial replacement (FMT following bowel prep) or spontaneous repopulation (bowel prep only) procedures that recolonized the microbiota, and increased circulating VB was positively associated with obesity-related phenotypes in humans (BMI, central adiposity, and severe fatty liver). Taken together, the results of this present study shows that VB is a microbially-derived molecule that causes diet-dependent obesity in mice and may be a causal factor driving obesogenic mechanisms in humans.
The possible dependence of the relationships upon diet, as found in mice, cannot be directly tested in these retrospective human studies. Evidence for common mechanisms is provided, however, by correlations between urinary VB and urinary carnitine as well as increases in circulating VB following microbiome manipulation in humans. There was a positive correlation between urinary VB and carnitine in human populations, consistent with our data showing that VB treatment increased urinary carnitine elimination in mice. Previous studies showed that VB is a substrate for the carnitine transporter (OCTN2)25, which is highly expressed in the kidney. Therefore, VB could be decreasing the efficiency of renal carnitine reuptake and individuals with elevated VB could have increased rates of urinary carnitine elimination. Additionally, patterns observed in VB-treated mice were mirrored in humans undergoing microbiome manipulation with FMT. Circulating VB increased following FMT with associated changes to circulating acylcarnitine profiles. These data show that clinical procedures which decrease microbial colonization to allow for natural repopulation or fecal transplantation (e.g. bowel purge)26, can alter circulating VB concentrations with potential downstream effects on lipid metabolism.
The mechanistic basis for VB effects through the carnitine shuttle has widespread implications for human health. Carnitine regulates glucose and lipid metabolism27,28, and declines in free carnitine are accompanied by an accumulation of medium and long-chain acylcarnitines in muscle and obesity in aging29. Carnitine supplementation is beneficial for obesity, fatty liver and glucose utilization30–33. Accumulation of incompletely oxidized acylcarnitines is associated with obesity and insulin resistance34, potentially exacerbated by chemicals that decrease cellular carnitine, cause mitochondrial dysfunction and decrease hepatic fatty acid oxidation35. Therefore, assessment of interactions of VB with the carnitine system may provide a way to simplify use of VB measures for management of obesity.
Use of clinical VB measures to guide diet and health management will require consideration of complex interactions between diet and microbiome composition. VB from dietary sources has both positive and negative health implications36,37. VB from ruminant microbes is relatively high in ruminants and improves nutritional value of milk by increasing acylcarnitine content37,38. Whole grain diets, which do not contain VB but increase circulating VB in humans36, are associated with decreased risk of cardiometabolic disorders, type 2 diabetes, and weight gain39. Conversely, trimethyllysine, a precursor to VB, is high in foods (e.g. red meat) associated with poor metabolic health40 and increased in people at risk for cardiovascular diseases41. VB (along with trimethyllysine, carnitine, choline, butyrobetaine) is also a precursor for trimethylamine (TMA), generated by intestinal microbes, which is then converted to trimethylamine oxide (TMAO) by hepatic flavin monooxygenases, with well described deleterious effects on cardiovascular health13,14,42. However, while VB could also be a significant contributor to microbial TMA production, the effects of VB on bioenergetics and body composition were observed in GF mice where no microbial production of TMA occurs. Additionally, obesity is not simply a consequence of the presence or absence of the microbiome or the presence or absence of VB because both GF and conventional mice did not develop excess adiposity with standard mouse food and VB. Use of antibiotics may not necessarily deplete all microbiota or their associated enzymatic activity, but rather elicit shifts in gut microbial composition which have been associated with weight gain in mice43, livestock44, and children45. Furthermore, antibiotic treatment would not completely deplete circulating concentrations of VB if it is still present in the diet. Thus, we recognize that effective use of VB measures in management of obesity will require evaluation in the context of diet and microbiome, with an emphasis on identification of specific diets that contain VB (which would increase VB independent of the microbiota) or VB precursors or microbial profiles and genes that are responsible for production of VB (which would increase VB in a microbiota-dependent manner). For example, previous studies have shown that bacteria belonging to the Gammaproteobacteria class, which include VB producers E. coli and Salmonella typhimurium, are associated with obesity in humans46. This interpretation is consistent with potential use for NAFLD, where circulating VB is increased and hepatosteatosis is potentiated by a high-fat diet with associated shifts in gut microbial composition47.
There is increasing recognition that the eukaryotic host and its associated microbiome function as a biological unit, termed holobiont, and are subject to evolutionary pressures, which include agricultural shifts and changes in dietary patterns. Phylogenetic and evolutionary evidence show eukaryotic mitochondria are descendent from an ancient bacterial endosymbiont48. Thus, VB modulation of carnitine-dependent fatty acid oxidation may reflect an evolutionarily conserved phenomenon linking the microbiome to mitochondrial function. The results of our study show that VB may participate in mitohormesis49, a process by which a minor impairment increases gene expression of mitochondrial systems which improve metabolic function of mitochondria. Comparative analysis of GF/CV mouse liver transcriptomes shows that the microbiome increases expression of many genes for mitochondrial bioenergetics and lipid homeostasis. With this interpretation, lipid accumulation caused by the presence of VB in CV animals drives activity of Ppar-α pathways50, which control mitochondrial bioenergetics and lipid metabolism51. Indeed, in control diet fed GF mice, VB treatment increased expression of Ppar-α linked genes regulating mitochondrial function and lipid processes. This can explain why VB did not augment body composition phenotypes with the control diet (and even decreased weight gain in control diet female mice (Extended data 7a). However, in the context of excess fats and sugars characteristic of a WD, this microbiome-mitochondria axis is overwhelmed with the addition of VB. As a result, VB worsens the effects of a WD on body composition (increased weight gain and adiposity), with associated downregulation downregulation of Ppar-α linked genes regulating mitochondrial bioenergetics and lipid metabolism. Since the addition of VB to WD-fed GF mice caused GF mice to gain more weight than WD alone, our data show that the lack of microbially-derived VB in GF mice could be a factor that protects them from WD-induced obesity. This is further supported by our observation that circulating and hepatic carnitine is increased in GF mice compared to conventional mice, and the addition of VB to GF mice caused serum and liver carnitine to be equivalent to carnitine levels observed in conventional mice. We speculate that the effects on body weight are more pronounced in GF mice since conventional mice could be adapted to the presence of VB either from their diet (Extended data 1c) or microbial production (as evidenced by comparative transcriptome analysis of GF and CV liver), compensatory shifts in the microbiota, or potential effects of other microbial metabolites (such as butyrate) on host bioenergetics. In recognition of this, it cannot pass without notice that improved quality of maize with high lysine content, which is helping to erase global malnutrition52, may have contributed to the global obesity epidemic through increased content of the VB precursor, trimethyllysine, which could further shift the intricate balance between microbially derived VB and mitochondrial bioenergetics beyond what homeostatic mechanisms can compensate for.
In conclusion, δ-valerobetaine (VB), a gut microbe-derived molecule, orchestrates microbiome-mitochondrial communication to control energy metabolism and augment visceral adiposity in the context of a Western diet. Measures of VB, along with carnitine, may provide a key approach to guide use of prebiotic and probiotic interventions and dietary management for excessive adiposity. Such an approach may be unavoidable if the obesity epidemic is a consequence of an evolved microbiome-human symbiotic relationship that is shifting due to global agricultural or environmental change.
Methods
Animals.
All animal experiments were performed under approved Emory University IACUC animal protocol ID 201700320 and complied with all relevant regulations regarding the use of research animals. Experiments with Germ-Free (GF) Swiss Webster (Taconic), ex-GF conventionalized Swiss Webster mice, and GF C57BL6 (Taconic) mice were performed at the Emory University Gnotobiotic Animal Core (EGAC). Experiments with conventional C57BL6J mice (jax.org/strain/000664, Jackson laboratories) were performed at the Emory Whitehead Biomedical Research Building Animal Research Facility. All mice were maintained on 12 hour light/dark cycles (7 am light/7 pm dark), with the ambient temperature set between 69–72°F and a relative humidity of 30–70%. Diets used for specific experiments are described below and diet compositions are provided in supplementary figures and supplementary information. Mice were monitored for general health, weight loss and anemia during treatments to ensure they did not reach IACUC endpoints. At the end of each experimental treatment protocol as described below, animal tissues were collected for characterization.
GF mouse conventionalization.
GF male (n = 6) and female (n = 6) Swiss-Webster mice were raised in GF isolators and fed sterilized mouse chow (Envigo 2019S Teklad Global 19% Protein Extruded Rodent Diet) and sterilized water ad libitum. At 3 weeks of age, 3 mice of each sex were randomly selected for conventionalization (microbiome acquisition). Conventionalized (CV) mice were transferred to bedding from conventional Swiss-Webster mice at three weeks of age and maintained at the EGAC for 3 weeks with the same sterilized mouse chow while counterpart GF mice were maintained in germ-free isolators.
GF mouse treatment with VB.
At 6 weeks of age, 20 GF male C57BL6 mice were randomized into four treatment groups (n = 5 each) in hermetically sealed IsoCage bioexclusion systems (Techniplast). The mice were either fed a sterilized Western Diet (Research Diets D12079b) or sterilized chow (Envigo 2019S Teklad Global 19% Protein Extruded Rodent Diet) ad libitum and injected intraperitoneally once each morning (Monday-Friday between 8–10 am) with sterile filtered 25 mg/kg VB or PBS vehicle for 6 weeks. The diets were doubly irradiated and vacuum sealed to prevent contamination. All manipulation of mice were performed under BSL-2 conditions in a sterile laminar flow hood. GF status of mice was confirmed by bacterial 16S rDNA PCR assay paired with anaerobic culture testing, undertaken by IDEXX BioAnalytics (Columbia, MO), as well as Gram staining and plating of fecal pellets on Blood agar petri dishes before incubation in aerobic and anaerobic conditions. Routine analysis of fecal pellets from mice housed in IsoCage P - Bioexclusion System cages by the aforementioned assays confirmed germ-free status. None of the diets used for GF mouse experiments (Envigo 2019S Teklad, Research Diets D12097b) contained VB.
Conventional mouse treatment with VB.
For experiments with fed mice, 6 week old male or female C57BL6J mice were injected intraperitoneally with 100 μL saline vehicle, 100 μL 10 mM VB (10 mg/kg), or 100 μL 100 mM VB (100 mg/kg) once a day for one week. For experiments in fasted conventional mice, animals were treated with the same doses for three days and then fasted for 12 hours prior to sample collection. For the 8-week study in conventional mice, 8-week old mice (20 male and 20 female) were randomized into four groups (n = 5 per group) and given a Western Diet (Research diets D12079b) or standard chow (Labdiet Rodent 5001) ad libitum and injected intraperitoneally once each morning (Monday-Friday between 8–10 am) with 50 mg/kg VB or PBS vehicle.
RNA-Sequencing.
Analyses were conducted at the Yerkes NHP Genomics Core. Liver mRNA was collected and extracted from PAXgene tubes using on-column DNase digestion and assessed for integrity and quantity using an Agilent Bioanalyzer (Agilent Technologies) and a NanoDrop 2000 spectrophotometer (Thermo Fisher Scientific). Libraries were prepared using the Illumina TruSeq mRNA stranded kit. Briefly, 500–1,000 ng of globin-depleted RNA was used for library preparation. ERCC synthetic spike-in controls 1 or 2 (Ambion) were added to each total RNA sample and processed in parallel. Amplified libraries were validated using the Agilent 4200 TapeStation and quantified using a Qubit fluorometer. Libraries were normalized and pooled, followed by clustering on a HiSeq 3000/4000 flowcell using the Illumina cBot. The clustered flowcell was then sequenced on the Illumina HiSeq 3000 system employing a single-end 101-cycle run, with multiplexing to achieve approximately 20 million reads per sample. FasQ files were uploaded to the BioJupies53 RNAseq cloud pipeline where differential expression analysis and downstream pathway and transcription factor enrichment analyses were performed. RNA-sequencing data are publicly available at the Gene Expression Omnibus: GSE145012 (GF/CV comparison) and GSE185525 (VB treatment to GF mice).
High-resolution metabolomics (HRM) sample preparation.
Mitochondrial fractions from GF (n = 6) or CV (n = 6) liver were prepared by differential centrifugation54. Mouse serum, human plasma, urine and fractionated mitochondria were mixed with 2x volume of ice-cold acetonitrile-internal standard solution. Tissue samples (liver, brain, lung, cecal and colonic contents, luminal contents, cultured cells) were prepared by the addition of 10 μL of ice-cold 20% water/80% acetonitrile-internal standard solution per milligram of sample, followed by homogenization using a handheld pellet pestle. Samples were vortexed, and placed on ice for 30 minutes prior to centrifugation at 14,000g for 10 minutes at 4°C to precipitate proteins. Supernatants were transferred to autosampler vials and stored at −70°C prior to instrumental analysis.
HRM instrumental analysis.
Untargeted high-resolution mass spectrometric profiling was performed using a Dionex Ultimate 3000 UHPLC system coupled to a Thermo Scientific Velos LTQ-Orbitrap, Thermo Scientific High-Field Q-Exactive (HFQE) or Thermo Scientific Fusion55. Samples were analyzed in a randomized run order. On the Fusion and HFQE, an LC column switching method using a reversed phase C18 column (Higgins Targa C18 2.1 mm × 50 mm, 3 μM particle size) and a HILIC column (Waters XBridge BEH Amide XP HILIC column 2.1 mm × 50 mm, 2.6 μM particle size) were used for the analytical separation of extracts prior to high-resolution mass spectrometry analysis with HILIC/ESI+ and C18/ESI- at 120k resolution while of ions between 85–1,275 m/z56. Additional LC column switching methods using scaled 10 minute and 20-minute HILIC separation methods using 10 cm columns were used for further confirmation of chemical identity.
HRM data processing, statistics, and feature selection.
Peak detection, noise removal, alignment, and quantification was performed using apLCMS version 6.3.357,58, with downstream quality control performed by xMSanalyzer version 2.0.859. Each metabolic feature was characterized by its m/z ratio, retention time, and peak intensity. Statistical analysis was performed using R-packages limma60 for differential expression analysis and diffexp for linear regression implemented in lm() function in R 3.4.0. Benjamini-Hochberg FDR-corrections were applied for limma and lmreg analyses. For pathway enrichment analysis, differentially expressed metabolites with a raw p-value of less than 0.05 were used with mummichog 2.0 software61. Pathway enrichment significance in mummichog is based on permutation testing with a p < 0.05. Spearman correlations and heatmaps were performed and prepared using Metaboanalyst 4.0.
HRM metabolite identification and quantification.
Detected metabolites were annotated using xMSannotator62 and referenced against an in-house reference library established with authentic chemical standards and matched within 5 ppm of the confirmed mass and within 10s of the confirmed retention time56. When no standard was available, MS isotopic ratios and MS/MS spectra (CID or HCD fragmentation as noted) were referenced against online spectral libraries mzCloud and METLIN63. Standards were purchased when commercially available or synthesized as described below. Processed data with annotations and confidence scores are provided in source data. Reference standardization56 was used for quantification of identified metabolites.
Synthesis of δ-valerobetaine and valine betaine.
δ-Valerobetaine (VB) was synthesized by the addition of 1 molar equivalent trimethylamine (20% EtOH) with 5-bromovaleric acid (Sigma-Aldrich) and stirred for 24h under vacuum at room temperature. The precipitate containing trimethylamine HBr salt was removed by filtration and the filtrate was evaporated under vacuum and recrystallized with cold isopropanol and acetonitrile64. MS: 160.1332 m/z ESI+ (MS2: 101.0597, 60.0809). 1H NMR (Extended data 3) (400 MHz, D2O) δ 3.15 (multiplet, 2H), δ 2.91 (singlet, 9H), δ 2.27 (triplet, 2H), δ 1.64 (quintuplet, 2H), δ 1.46 (quintuplet, 2H). Elemental analysis (as VB-HBr salt) was C 37%, H 8%, N 5%, Br 31%. Valine betaine was synthesized by the addition of methyl iodide to L-valine (1 molar equivalent) and stirred for 48h in anhydrous methanol in the presence of excess potassium bicarbonate. The precipitate was dried and washed with ice-cold methanol. MS: 160.1332 m/z ESI+ (MS2: 60.0809)65.
Ex-vivo fermentation.
Cecal contents from conventional or GF mice were collected and immediately placed in De Man, Rogosa, and Sharpe media (MRS broth – Oxoid, CM0359) in oxygen evacuated headspace vials. The control mouse diet was placed in MRS broth. Samples were incubated at 37°C and were collected over a 24h time period and prepared for metabolomics analysis as above.
Ex-vivo microbial metabolism assays.
Bacteria were purchased from ATCC and/or isolated in our laboratory and were cultured in specified liquid media. Samples were collected at baseline and again at 18 hours after incubation at 37°C. Lactococcus lactis Subsp. cremoris (LC, ATCC 19257), Lactobacillus rhamnosus GG (LGG, ATCC 53103), Lactobacillus paracasei (HA274, HA196), and Lactobacillus rhamnosus (HA-114, HA-111, R0011) were grown in MRS broth (Oxoid, CM0359). Bacillus cereus, Listeria monocytogenes (LM), and Streptococcus salivarius (ATCC13419) were grown in brain heart infusion (BHI) media. E. coli (K12) and Salmonella typhimurium (SL1344) were grown in Luria Broth (LB). Bifidobacterium longum (BL, ATCC15707) was grown anaerobically using Oxyrase for Broth (Sigma, SAE0013) in reinforced clostridial media.
VB dose response experiments in HepG2 cells: metabolomics analysis.
HepG2 cells (ATCC HB-8065) were used between passages 8–15 and grown in EMEM (ATCC) supplemented with 10% FBS and 0.5% Penicillin/Streptomycin (P/S). Cells were grown to 90% confluence in 3.5 cm cell culture dishes and treated with experimental compounds (VB, meldonium, propionylcholine, carnitine) in EMEM supplemented with 0.5% FBS and 0.5% penicillin/streptomycin. Cells were washed with ice cold Hank’s Buffered Salt Solution (HBSS) and harvested by scraping on ice using 200 μL of ice-cold 20:80 water:acetonitrile and centrifuged at 14,000g for 10 minutes at 4°C. Supernatants were transferred to autosampler vials and maintained at 4°C until instrumental analysis.
VB dose response experiments in HepG2 cells: Stable Isotope Palmitate Tracer Assay.
13C16-palmitic acid (Sigma-Aldrich 605573) was dissolved in 150 mM NaCl after heating to 70°C and slowly mixed with prewarmed (37°C) FFA-free BSA (Sigma-Aldrich A4602) solution in 150 mM NaCl with stirring to produce a 1 mM palmitate to 0.17 mM BSA ratio. HepG2 cells were grown in 12-well cell culture plates to 80% confluence. Cell media was replaced with EMEM containing 0.5% FBS for 12 h ± VB prior to treatment with labeled palmitic acid. Cells were washed twice with pre-warmed HBSS and media was replaced with EMEM containing 0.5% FBS, 200 μM labeled palmitate, and either vehicle, 50 μM VB, 40 μM etomoxir, or 50 μM carnitine. At each time point, cells were washed once with ice cold HBSS and harvested by scraping on ice using 200 μL of ice-cold 20:80 water:acetonitrile and centrifuged at 14,000g for 10 min at 4°C. Supernatants were transferred to autosampler vials and maintained at 4°C until analysis. Data were analyzed using xCalibur (v4.2) QuanBrowser for carnitine and labeled palmitate, palmitoyl-CoA, palmitoylcarnitine, acetyl-CoA, and acetylcarnitine.
VB dose response experiments in HepG2 cells: Mitochondrial Respiration Assays.
Oxygen consumption (OCR) was measured in the human hepatoma HepG2 cell line using a Seahorse XFe96 analyzer (Agilent Technologies). For assessments of respiration linked to oxidation of glucose and glutamine, cells were cultured on 96-well cell culture microplates and treated overnight with 0, 1, 3, 10, 30, 100 μM VB in DMEM with 0.5% FBS. Cells were then washed 1x with 100 μM pH 7.4 Seahorse XF DMEM (Agilent Technologies) in 0.5% FBS and media was replaced with XF DMEM supplemented with fuel substrates and VB or vehicle. The media was supplemented with 10 mM glucose, 2 mM GlutaMAX, and 1 mM pyruvate ± VB. For assessments of fatty acid oxidation, cells were serum-starved overnight with or without VB. After washing, media was replaced with Krebs Heinseleit Buffer (KHB) containing 200 μM BSA-conjugated palmitate (Agilent Technologies) in the absence of supplemental glucose, GlutaMAX, pyruvate, or carnitine. KHB was prepared from pH 7.4 sterile filtered water containing 111 mM NaCl, 4.7 mM KCl, 2 mM MgSO4, and 1.2 mM NaH2PO4. VB (0, 10, 50 μM final concentration) or etomoxir (40 μM final concentration) were added to the assay medium prior to assessments of oxygen consumption (OCR) and extracellular acidification rate (ECAR). To evaluate mitochondrial function, a MitoStress test kit (Agilent Technologies) was used with respiration assays. Three consecutive respiration measurements were acquired every 10 minutes for every experimental condition prior to and after injections of Oligomycin (1.5 μM final concentration), FCCP (1 μM final concentration), and Rotenone/Antimycin A (0.5 μM final concentration). Basal respiration (OCR prior to injection of mitochondrial inhibitors), ATP production (difference in OCR after addition of oligomycin), maximal respiration (OCR after addition of FCCP) and spare capacity (difference in OCR between basal and maximal respiration) were calculated using the Seahorse XF Cell Mito Stress Test Report Generator (https://www.agilent.com/en/products/cell-analysis/cell-analysis-software/data-analysis/seahorse-xf-cell-mito-stress-test-report-generators).
Histology (Oil Red O, Hematoxylin and Eosin) analysis.
Oil red O staining for neutral lipids was performed on 8–10-micron mouse liver sections prepared using a Cryostat. Images were taken on a Nikon Eclipse 50i at 20x magnification and red density was quantified in ImageJ software (version 1.52). Liver samples were removed upon sacrifice and fixed in 10% formalin overnight followed by transfer to 70% ethanol with subsequent processing and embedding into paraffin. 5-micron sections were cut and underwent H&E staining as performed by the Emory University Cancer Tissue and Pathology core. Stained slides with a minimum of 3 sections were examined in a blinded fashion by a board-certified pathologist for hepatic steatosis. Scoring was as follows: 0 = 0–5% steatosis, 1 = 5–33% steatosis, 2 = 33–66% steatosis, 3 = >66% steatosis. Average scores were taken from multiple sections per sample.
Triglyceride quantification.
Triglycerides were quantified in tissues using a triglyceride assay kit (Abcam 65336). 50 mg of liver tissue was homogenized in 1 mL of assay buffer and diluted 100x prior to addition of lipase. After 20 minutes, the triglyceride probe was added. After incubation for 30 minutes, the plate was read fluorometrically (535/587 nm) and quantified using the provided standard calibration curve.
Lipidomics analysis.
Chemical reagents and HPLC grade organic solvents (methanol, chloroform, acetonitrile, isopropanol, butylated hydroxytoluene, ammonium formate, and formic acid) were purchased from Sigma Aldrich (St. Louis, MO, USA). A mixture of deuterated synthetic lipid standards, SplashMix (Avanti Polar Lipids, Alabaster, AL, USA) was used as an internal calibrant. Lipids were extracted according to a modified Bligh and Dyer lipid extraction protocol. 100 mg tissue sample was homogenized in 1 mL methanol:chloroform (2:1). 10 μl of each sample was reserved and used to create a tissue specific pooled quality control (QC) sample. To the remaining homogenate, 10 μL internal standard was added. Samples were vortexed for 30 minutes and subsequently centrifuged for 10 minutes at 14,000g to pellet any precipitated protein. The supernatant was collected and phases were separated by the addition of 500 μL 100 mM sodium chloride solution. Addition of sodium chloride in lieu of water was used to aid the complete partition of amphiphilic lipids to the organic phase. The organic phase was retained, dried under nitrogen gas, and the weight of recovered lipids was recorded. The extracted lipids were reconstituted in 500 μL methanol:chloroform (1:1) prior to injection into the mass spectrometer. Blank samples were prepared by diluting SplashMix 1:100 (Avanti Polar Lipids Inc. Alabaster, AL, USA) in 1:1 v/v methanol:chloroform. QC samples were prepared in the same manner as samples. 10 μL of reconstituted lipid extract was injected into a Thermo ID-X (Waltham, MA, USA) equipped with a Vanquish Duo UHPLC System (Thermo; Waltham, MA) for LC/MS analysis. Chromatographic separation of lipids was achieved using a Thermo Accucore C18 (100 × 4.6mm; 2.6 μm) using a 10 minute linear gradient of the following binary solvent system: Solvent A water: acetonitrile (40:60 v/v; mobile phase A) and Solvent B isopropanol: acetonitrile (90:10 v/v; mobile phase B) containing 10 mM ammonium formate and 0.1% formic acid. Full MS scans were collected at 120,000 resolution while data-dependent MS/MS data was collected using 30,000 resolution.
Lipidomics data were processed using LipidSearch (Tokyo, Japan), a software for alignment and identification of lipid species from the data-dependent MS/MS fragmentation data. First, full scan MS data was searched for monoisotopic precursor ions. Second, MS/MS fragment ion data were queried against the LipidSearch fragmentation database for identification of lipids. Finally, MS/MS quality filters were used to provide headgroup specificity and fatty acyl chain information to identify specific lipid classes and species.
VB dose response experiments in HepG2 cells: Luciferase Reporter.
HepG2 cells, grown in DMEM containing 10 % stripped-FBS, were passed into 96- well clear bottom TC-treated microplates. Cells were transfected at ~60 % confluence per manufacturer instruction. 1 ng well−1 of pSG5 vector containing full-length human PPARa receptor, 100 ng well−1 PPAR-response element-driven firefly luciferase reporter (PPAR-response element X3-TK-luc), and 50 ng well−1 constitutive Renilla luciferase reporter (phRLtk) were mixed with Optimem and Fugene. Twenty-four hours following transfection, media was changed to DMEM containing 0.5% FBS in the absence of glutamine, glucose or pyruvate. Cells were treated with either VB or PPARa agonist WY14643. One day post-treatment, firefly and Renilla luciferase activity was detected using the Dual-Glo Luciferase Assay system (Promega) and read on a BioTek Synergy 4. Data were plotted as bioluminescence generated from firefly luciferase divided by bioluminescence generated from Renilla luciferase, normalized to vehicle treatment for each well, and plotted using GraphPad Prism (v8).
Cytokine analysis.
Fasting plasma insulin, resistin, glucagon, IL-6, TNF-alpha, and MCP-1 was measured via Milliplex Mouse metabolic hormone panel (Millipore, Burlington, MA) on the Luminex 200 instrument (Millipore).
Human samples.
Three sample sets were used for this study (Emory Pediatric Liver Biopsy Data Repository, Centers for Health Discovery and Well-Being (CHDWB), and PREMIX Fecal Microbiota Transplantation Clinical Trial Cohort). Human samples were obtained with written informed consent under IRB00090101 (PREMIX) and IRB00007243 (CHDWB), and with parental written consent was obtained for IRB00091260 (Pediatric Liver Biopsy). Study protocols were approved by the Emory University Institutional Review Board. All study designs comply with all relevant regulations regarding the use of human study participants and were conducted according to criteria set by the Declaration of Helsinki. None of the participants from these three cohorts were compensated monetarily.
Emory Pediatric Liver Biopsy Data Repository.
The Emory Pediatric Liver Biopsy Data Biorepository is an ongoing cross-sectional cohort study of children who provided data and biospecimens prior to undergoing a clinically-indicated liver biopsy for suspected liver disease or monitoring of a liver disease24. Exclusion criteria were fever with in the past two weeks, renal disease or insufficiency, or pregnancy. The analytical sample was a sub-group of 74 participants ages 7–19 years old who were enrolled between 2007 to 2015, had a clinical diagnosis of NAFLD after exclusion of other liver diseases. A physical examination and fasting blood collection were performed prior to liver biopsy. Liver biopsies were reviewed by pathologists in a blinded manner, and were scored based on grade of steatosis (<5% = 0, 5–33% = 1, 34–66% = 2, >66% = 3), steatosis location (Zone 1, Zone 3, azonal, panacinar), lobular inflammation (0 = No foci, 1 = < 2 foci per 200 × field, 2 = 2–4 foci per 200 × field, 3 = > 4 foci per 200 × field), portal inflammation (0 = none, 1 = mild, 2 = more than mild), hepatocyte ballooning (0 = none, 1 = few, 2 = many), and fibrosis stage (0 = none, 1 = periportal or perisinusoidal, 2 = perisinusoidal and portal/periportal, 3 = bridging fibrosis, 4 = cirrhosis). Multiple linear regression adjusted for age (years), sex, and race/ethnicity were used to examine associations of steatosis grade, based on liver biopsy scores, with plasma VB levels. This was done with steatosis grade as a continuous variable (1, 2, or 3) to assess the dose response, and as a categorical variable to compare VB levels in those with moderate and severe steatosis compared to mild steatosis. VB was log-transformed for analysis. Regression analysis was conducted in R Statistical Software (v3.5.3).66
Center for Health Discovery and Well-Being (CHDWB) Cohort.
This cohort includes adults who were primarily employed by Emory University or Emory Healthcare systems at the time of enrollment. Individuals employed for greater than two years were invited to join the study from an alphabetized list and underwent extensive phenotyping67. General exclusion criteria were presence of a poorly controlled chronic disease, an acute illness within 12 weeks of study visit, currently pregnant or breastfeeding, or a history of malignancy within the previous five years 68. Two subsets of the cohort (n = 179 and 214) with high-resolution metabolomics data were included in this study 69. Body composition and visceral adipose tissue (VAT) were determined using a Lunar iDXA densitometer and CoreScan™ software (GE Healthcare, Madison, WI, USA), which automatically quantifies VAT and has been validated against computed tomography70. Multiple linear regression analyses, adjusting for age, race, and sex, were used to test for associations between VB with VAT. VAT was log-transformed for analyses. Analyses were conducted in JMP Pro (version 14, SAS Inc, Cary, NC).
PREMIX Fecal Microbiota Transplantation Clinical Trial Cohort.
All participants enrolled in PREMIX (ClinicalTrials.gov identifier: NCT02922816) had at least one clinical infection with a target multi-drug resistant organism (MDRO) as well as demonstration of persistent post-infection colonization by MDRO positive stool culture on differential and selective media. To minimize potential variability in donor-specific effects, all FMT doses were sourced from a single stool donor, who was well known to the investigators. The donor was thoroughly screened with questionnaires, blood, urine, and stool testing for behavioral risk factors and potentially transmissible pathogens including MDROs and E. coli pathotypes. Study visits were conducted in 36-day cycles with visits on Days 1, 15, and 36, with additional stool sample collection on Day 2. Participants were randomized 1:1 to an observation cycle (Cycle 0) with administration of polyethylene glycol prep alone or an FMT cycle (Cycle 1) with prep followed by FMT delivered as retention enema (Fig. 5a). Most participant characteristics were balanced by randomization with exception of sex. Participants with growth of any MDRO in stool culture at Day 36 of Cycle 0 or Cycle 1 proceeded to Cycle 1 or Cycle 2 respectively, with intent to allow all participants to be treated with up to two FMTs and half of participants to serve as their own controls. Of the 16 participants enrolled, 11 completed at least one full visit cycle. Ten participants received at least one FMT and were evaluated for response. Of these ten, eight individuals had samples available for plasma metabolomics with samples collected at day 1, 15, and 36. Of these eight individuals, 6/8 (75%) were female, 7/8 (88%) were white, 3/8 (38%) were Hispanic and their median age was 62 years old (IQR 53–70). VB measurements obtained from plasma were not related to the outcomes of the clinical trial.
Statistics and Reproducibility.
All statistical tests and p-value thresholds used for hypothesis testing are provided with figure captions. No statistical methods were used to predetermine sample size. No data were excluded from the analyses, unless they were statistical outliers as noted using Robust Regression and Outlier Analysis (ROUT). Mice were randomized into treatment groups and the order of treatments was randomized every morning. The individual(s) that performed the treatments were blinded to the nature of the treatments and the expected outcomes. The sample run order on the mass spectrometer were performed in a randomized fashion. For histology analyses, the investigators were blinded to sample allocation. For all other experiments, the investigators were not blinded to sample allocation and outcome assessment because they designed and performed the experiments and needed this information to test hypotheses and analyze the data.
Data availability:
Source data for figures are provided. RNAsequencing data are available at the NCBI Gene Expression Omnibus (GEO) GSE185525 and GSE145012. Other data that support the findings of this study are available on request from the corresponding authors. 9VB)
Extended Data
Extended Data Fig. 1. Additional mass spectrometry analysis of VB.
Mass spectrometric analysis of VB in a) lung and brain of conventional (C) and germ-free (GF) mice and b) Ion dissociation spectra (MS/MS) analysis of 160.1332 m/z (hcd 30) in cecal contents and mouse diet. VB was not present in GF cecal contents, or the control chow (Teklad) diet used for GF mouse experiments. The fragmentation of 160.1332 m/z in GF cecal contents and GF control diet is consistent with valine betaine (Supplementary Information). c) Ion fragmentation spectra of 160.1332 m/z in GF control diet and extracted ion chromatograms of 160.1332 m/z in all diets used in this study. There was no peak for 160.1332 m/z observed in the Western diet. c) Extracted ion chromatograms of 160.1332 m/z from mouse diets used for this study. VB is not present in the sterilized chow (Teklad) used as the control diet for GF and conventionalization experiments. The conventional chow (Labdiet), which was not autoclavable, was used as the control for conventional mouse experiments. This diet contained a minor peak for VB (red brackets), but the later eluting major peak (0.8m) had a fragmentation pattern observed for 160.1332 m/z (valine betaine) in the GF diet. The small amount of VB present in the Labdiet chow is not the major source of VB in conventional mice since serum VB was equivalent between WD-fed (which does not contain VB) and Labdiet chow-fed conventional mice (Extended data 6c). d) (Nε, Nε, Nε)-trimethyllysine (TML) is a precursor to δ-valerobetaine (VB). (Nε, Nε, Nε)-trimethyllysine (100 mg/kg) or (13C Nε, 13C Nε, 13C Nε)-trimethyllysine (25 mg/kg) was gavaged into conventional mice for 3 days. The formation of unlabeled VB (160.1332 m/z) from TML and labeled VB (163.1431 m/z) from isotopically labeled TML is shown here along with accurate mass MS1 and ion fragmentation spectra consistent with VB and labeled VB.
Extended Data Fig. 2. VB inhibits mitochondrial fatty acid oxidation.
a) Tracing the oxidation of 13C16 palmitic acid in HepG2 cells to examine the effect of VB treatment on cellular mitochondrial fatty acid oxidation. 12 hour pretreatment with VB (green) decreased (p = 0.0015 (AUC - Area under the curve), two-tailed student’s t-test) the formation of labeled acetyl-CoA (bottom middle) by approximately 75% compared to vehicle (blue). Addition of carnitine back to cells pretreated with VB for 12 hours (purple) restored the carnitine-dependent formation of mitochondrial acetyl-CoA (p = 0.49 (AUC), two-tailed student’s t-test). Co-treatment of VB with the addition of stable isotope-labeled palmitate (red) decreased the formation of labeled acetyl-CoA by approximately 25% compared to vehicle (p = 0.04 (AUC), two-tailed student’s t-test). Data for VB, carnitine, and other metabolites are shown to illustrate VB treatment does not affect uptake of labeled 13C16 palmitate (middle left), or the conjugation of labeled palmitate to CoA (middle middle). VB treatment decreased carnitine approximately 20% after one hour (top middle) and these changes drive decreased formation of labeled palmitoylcarnitine (middle right), labeled acetyl-CoA (bottom middle), labeled acetylcarnitine (bottom left), and labeled citrate (bottom right). Each data point represents the average of 3 biological replicates ± standard deviation. b) The effects of VB on mitochondrial respiration is dependent on the availability of fuel substrates. In the presence of glucose and glutamine, VB does not decrease basal respiration (ANOVA (F = 6.239, p = 0.0014) with post-hoc test for linear trend (R2 = 0.0078, p = 0.50)) or maximum respiratory capacity after addition of FCCP (ANOVA (F = 2.223, p = 0.10). VB does not influence basal respiration with culture conditions with palmitate but without glucose and glutamine (ANOVA (F = 9.729, p = 0.001) with post-hoc test for linear trend (R2 = 0.075, p < 0.096). Each data point represents at least 8 biological replicates.
Extended Data Fig. 3. VB alters carnitine metabolism in mice.
VB treatment increased a) circulating and b) hepatic VB in conventional mice [Kruskal-Wallis analysis to determine group-wise differences with Dunn’s multiple comparisons test (serum VB males (n = 3 per treatment) – KW statistic 7.2, p = 0.0036; serum VB females (Vehicle n = 5, 10 mg/kg n = 6, 100 mg/kg n = 6) – KW statistic 10.84, p = 0.0008; liver VB males – KW statistic 6.489, p = 0.0107; liver VB females – KW statistic 12.94, p < 0.0001)]. c, d) Pathway enrichment analysis of serum metabolites correlated with VB treatment shows VB alters carnitine shuttle metabolism in male and female mice (p < 0.05, mummichog p-value based on permutation analysis). e) VB decreases circulating carnitines in mice. Correlation heatmaps are based on Spearman’s correlation values with red corresponding to Spearman’s rho = 1 and blue Spearmen’s rho = −1. f) VB treatment increases urinary carnitine in mice (n = 3, time 0 p = 0.126, time 2h p = 0.001, time 6h p = 5.86e-005, two-tailed student’s t-test). g) Fasting does not change circulating (n = 6, p = 0.95, two-tailed student’s t-test) or hepatic (n = 5, p = 0.24, two-tailed student’s t-test) VB compared to fed mice.
Extended Data Fig. 4. VB decreases circulating and hepatic beta-hydroxybutyrate.
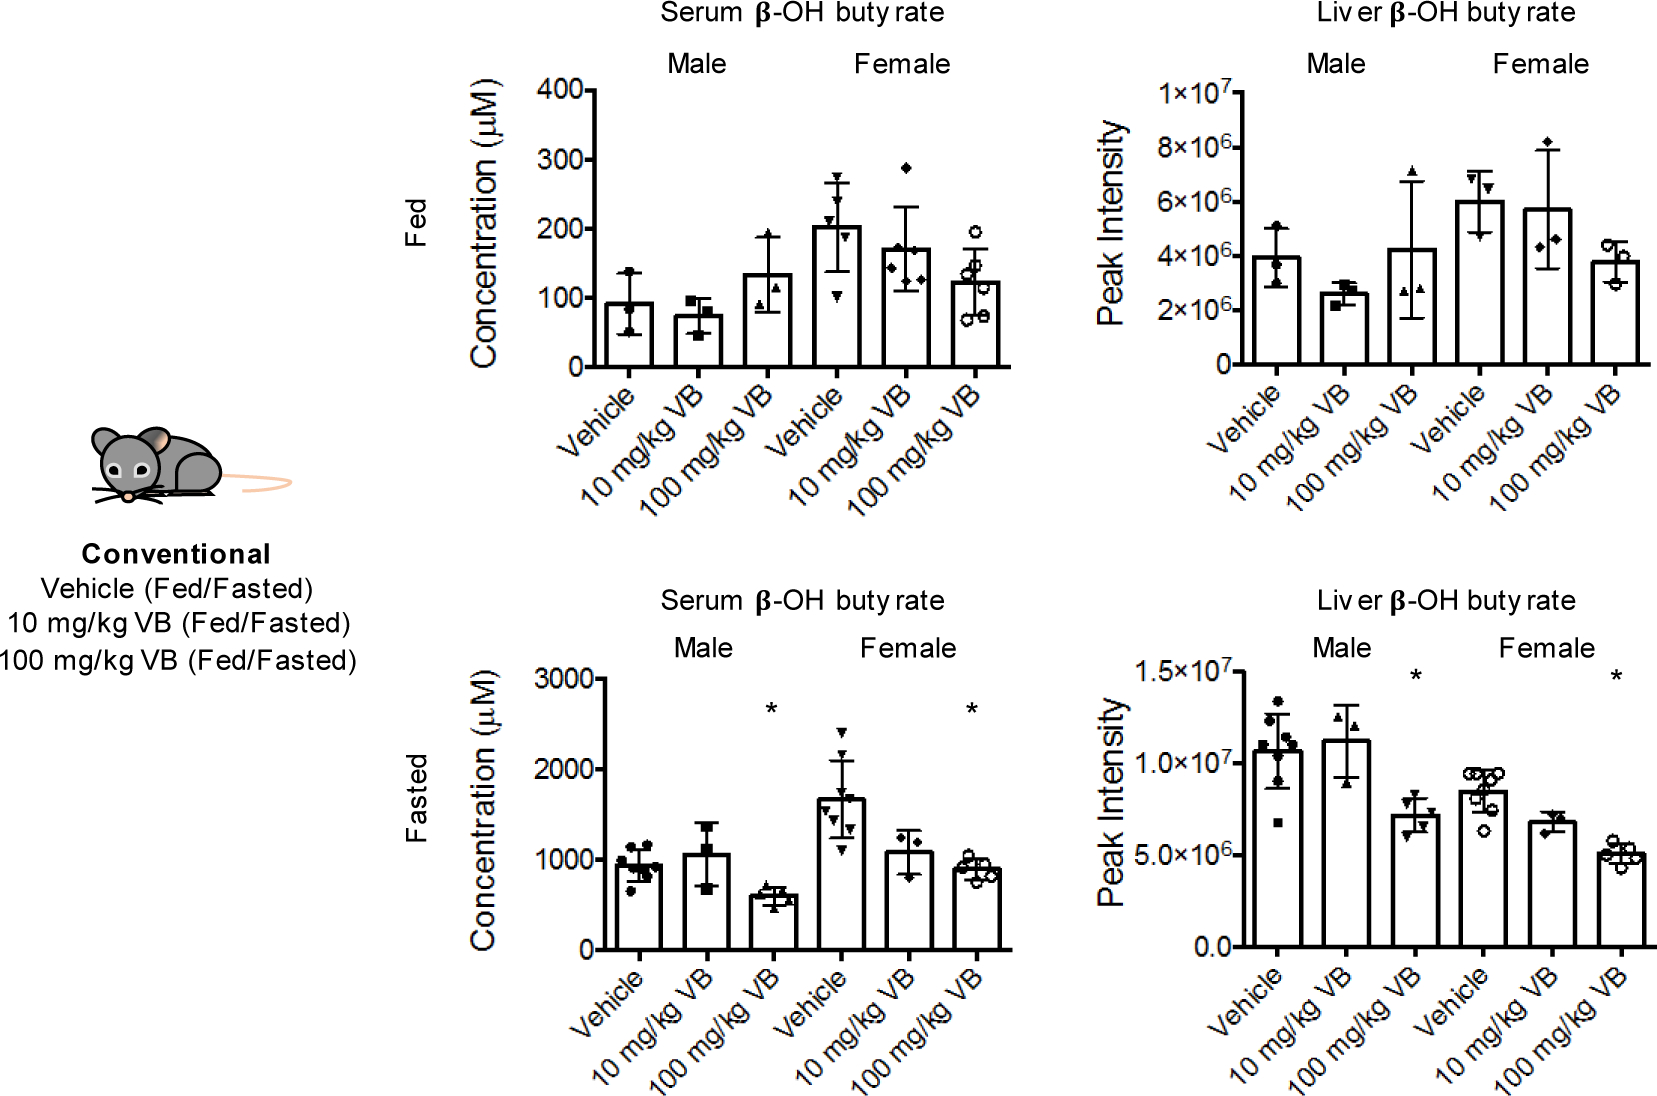
VB decreases circulating and hepatic beta-hydroxybutyrate, produced from mitochondrial fatty acid oxidation during fasting. Kruskal-Wallis with Dunn’s multiple comparisons test was used for fasted serum and liver analyses (n = 8 vehicle, n = 3 10 mg/kg, n = 5 100 mg/kg for male and female). Male serum KW statistic 7.864, p = 0.0085; female serum KW statistic 10.46, p = 0.0006. Male liver KW statistic 7.864, p = 0.0085; female liver KW statistic 11.73, p = 0.0001. Control vs. 100 mg/kg was significantly different for all comparisons in fasted mice. For fed mice, (n = 3 vehicle, n = 3 10 mg/kg, n = 3 100 mg/kg for male and female), one-way ANOVA with Dunnett’s multiple comparison tests was used. Male serum (ANOVA F = 0.9472, p = 0.4390); Female serum (ANOVA F = 6.8, p = 0.028, vehicle vs. 100 mg/kg significant); Male liver (ANOVA F = 0.9032, p = 0.454); Female liver (ANOVA F = 4.295, p = 0.0695).
Extended Data Fig. 5. Untargeted lipidomics of VB treated mice.
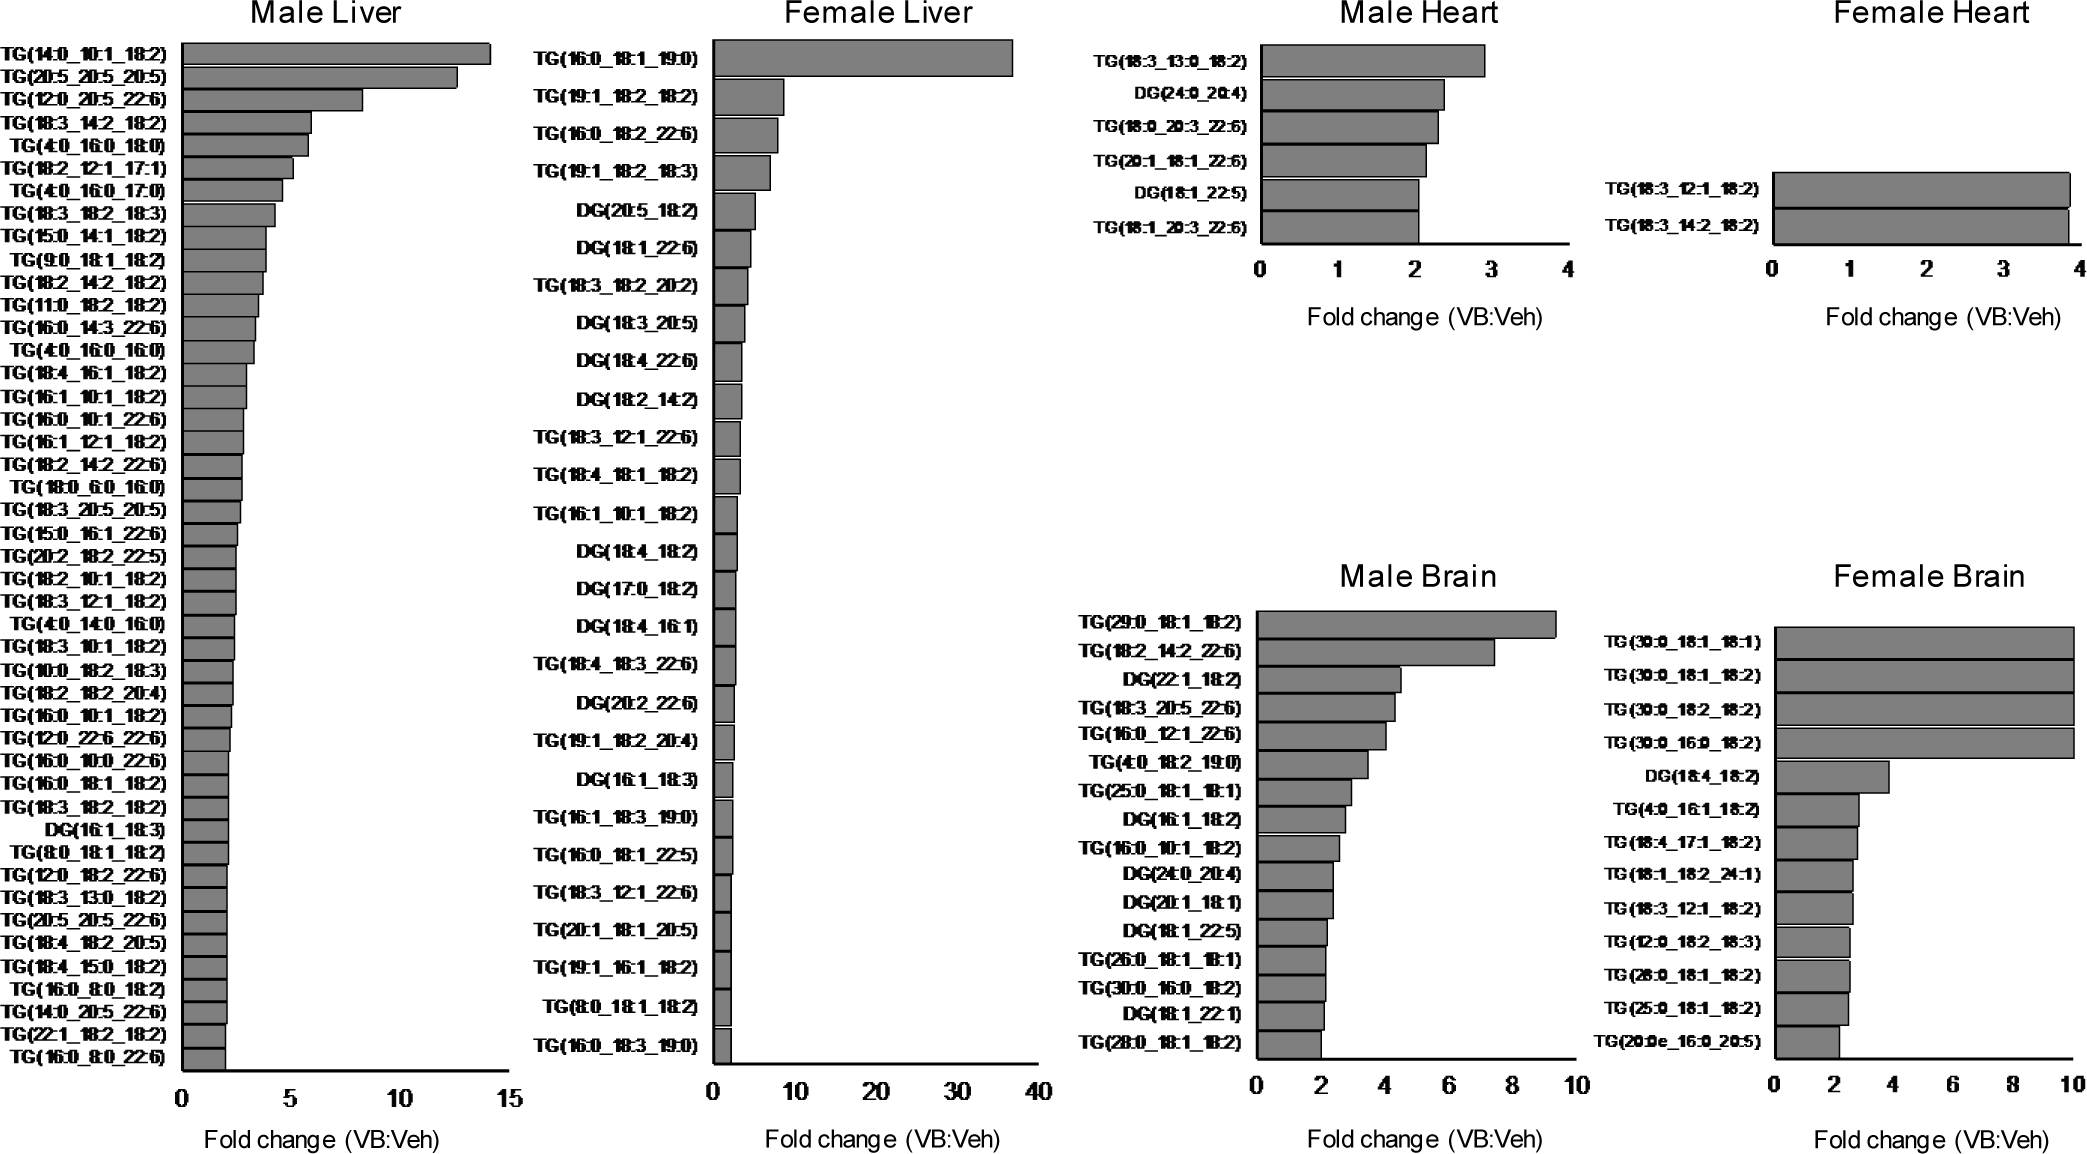
VB alters neutral lipid profiles liver, heart, and brain of male and female mice. Neutral lipids from untargeted lipidomic profiling with average fold-change greater than 2 in 100 mg/kg VB-treated mice (n = 5 male, n = 5 female) versus control (n = 5 male, n = 5 female).
Extended Data Fig. 6. Baseline data for long-term mouse experiments with VB.

a) Comparison of VB in GF mouse serum and liver after treatment with 25 mg/kg VB with conventional mice on respective control diets. Samples were analyzed after 6 week treatment with VB and normal conventional mice. GF mice control diet was Teklad 2019S chow and conventional mice control diet was LabDiets 5001 chow. Serum GF+VB (n = 5) and conventional (n = 5) comparison (p = 0.01, two-tailed t-test with conventional mice having approximately 1.7x circulating VB compared to GF mice treated with VB. Liver GF+VB (n = 5) and conventional (n = 5) comparison (p = 0.0004, two-tailed t-test with conventional mice having approximately 0.74x liver VB compared to GF mice treated with VB. b) Comparison of carnitine in mouse serum and liver after treatment with 25 mg/kg in GF mice with conventional mouse (control diet) data for comparison. Carnitine is decreased in conventional mice compared to GF mice. VB treatment to GF mice led to serum and liver carnitine concentrations equivalent to conventional mice. (Two-tailed unpaired student t-tests: Serum GFCD vs. GFCD+VB p = 0.0001, GFCD vs. Conventional CD p < 0.0001, GFCD+VB vs. Conventional CD p = 0.395; Liver GFCD vs. GFCD+VB p < 0.0001, GFCD vs. Conventional CD p < 0.0001, GFCD+VB vs. Conventional CD p = 0.6559) c) Comparison of circulating VB in conventional mice (male M, female F) between Western diet (WD) and control chow (Two-tailed unpaired student t-tests: CD male vs. WD male p = 0.4982; CD female vs. WD female p = 0.1653).
Extended Data Fig. 7. Effects of 8-week VB treatment on weight gain and adipose tissue mass in control or Western diet in conventional female mice.
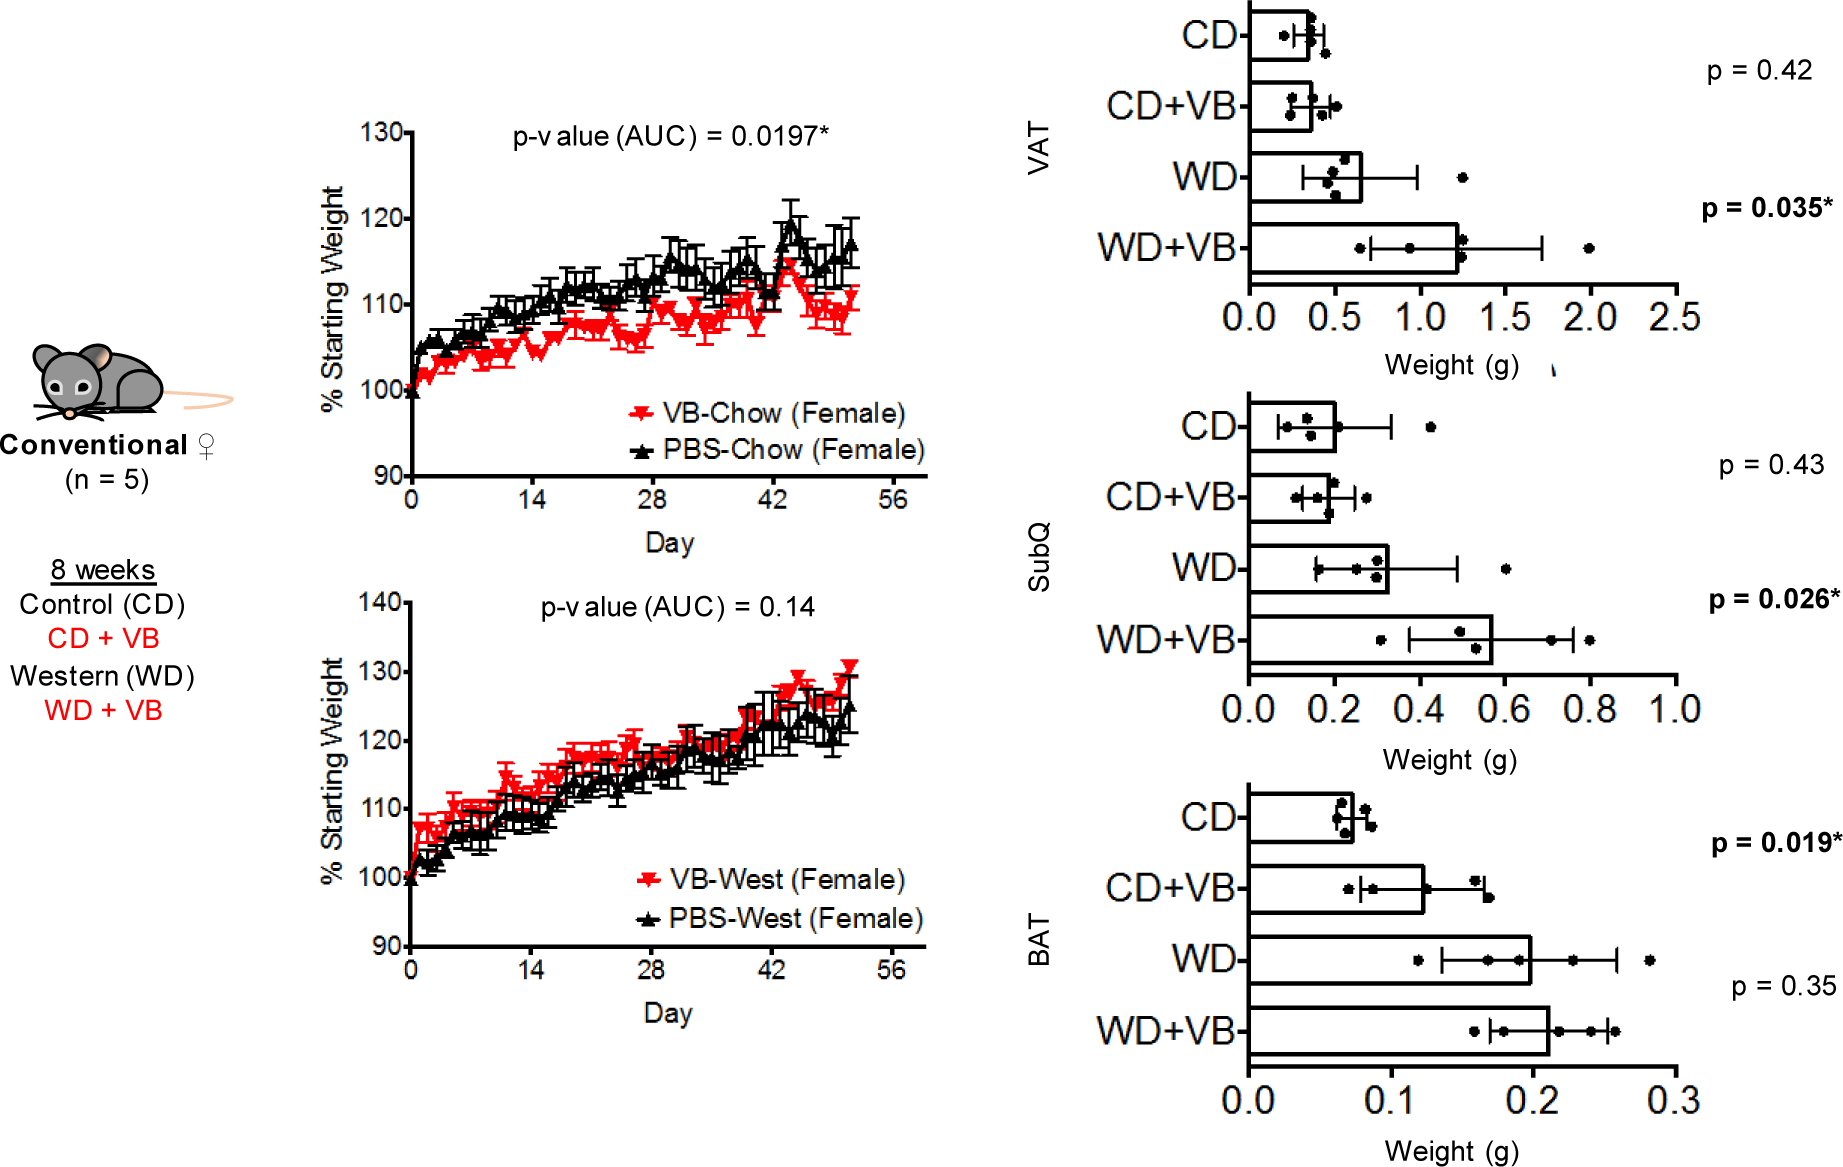
Effects of 8-week VB treatment on weight gain and adipose tissue mass in control or Western diet in conventional female mice (n = 5 per treatment). The combination of Western Diet with VB led to approximately a 3–6% increase in body weight compared to Western Diet alone in female mice, however these results were not statistically significant at a p-value threshold of 0.05 (p = 0.14, one-tailed t-test). In control-diet fed female conventional mice (n = 5 per treatment), VB did not increase weight gain (p-value for increase in weight = 0.9803 (1 – 0.0197), one-tailed t-test). VB treatment increased perigonadal visceral adipose tissue (VAT) and posterior subcutaneous adipose (SubQ) tissue mass in conventional female mice fed a Western diet. VB treatment increased interscapular brown adipose tissue (BAT) mass on a control diet but did not increase BAT mass with the Western diet in conventional female mice. One-tailed t-tests with p < 0.05 used to test for an increase in adipose tissue mass following VB treatment.
Extended Data Fig. 8. Cytokine panel following long-term VB treatment to male and female conventional mice.
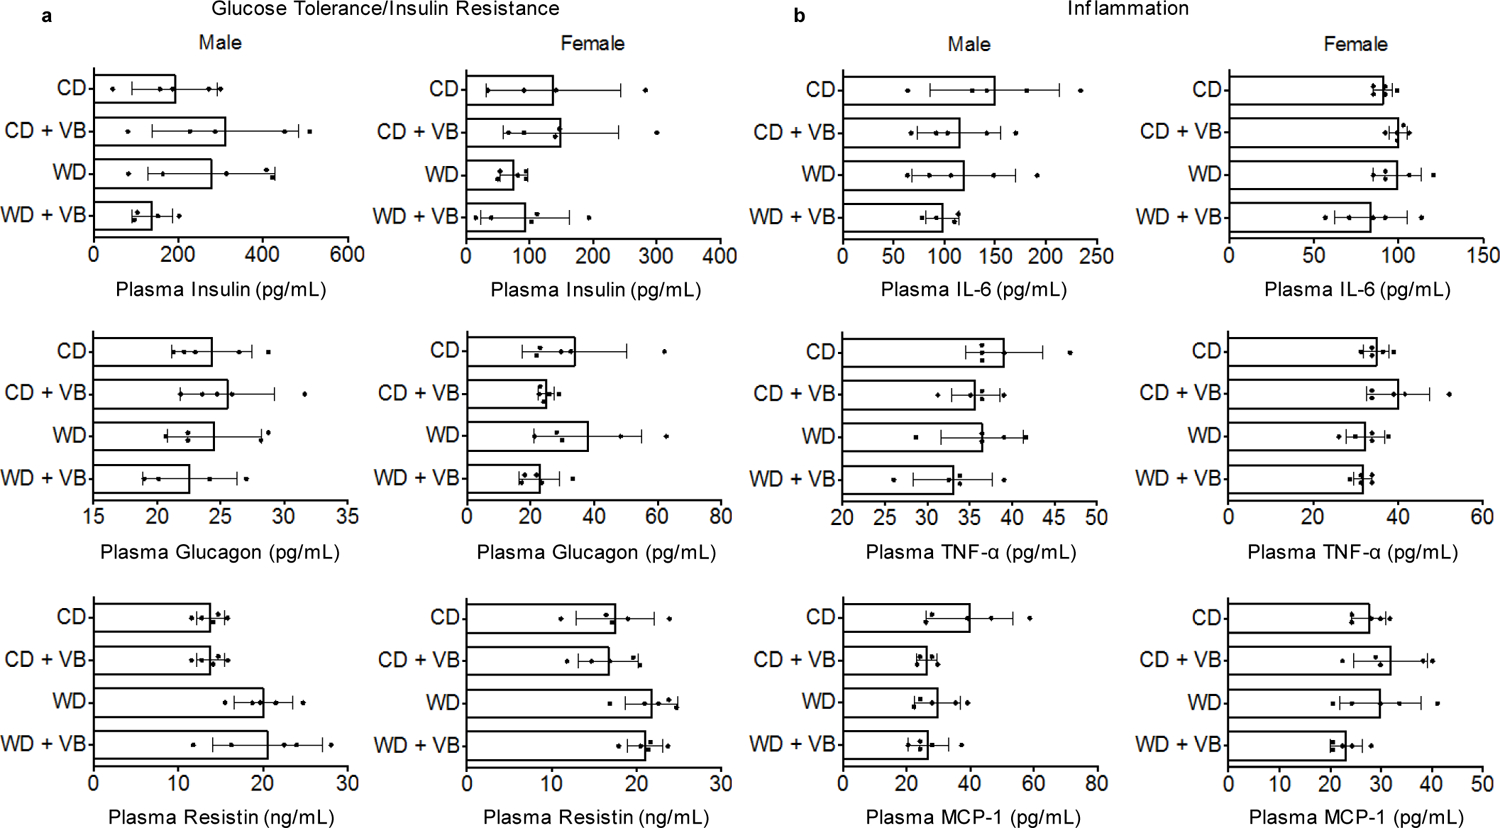
a) Plasma biomarkers of glucose tolerance/insulin resistance (insulin, glucagon, resistin) in conventional mice after 8 weeks of VB treatment (n = 5 per treatment, outliers removed by Robust regression and Outlier removal (ROUT) in Prism 6.0). (One-way ANOVA with Sidak’s multiple comparisons: Insulin male F = 1.648, p = 0.2205; Insulin female F = 1.034, p = 0.4059; Glucagon male F = 0.5165, p = 0.6772; Glucagon female F = 1.723, p = 0.2025; Resistin male F = 4.747, p = 0.0149 [CD vs. CDVB not significant, WD vs. WDVB not significant]; Resistin female F = 2.687, p = 0.0814) b) Plasma biomarkers of inflammation (IL-6, TNF-alpha, MCP-1) in conventional mice after 8 weeks of VB treatment. (One-way ANOVA with Sidak’s multiple comparisons: IL-6 male F = 0.9316, p = 0.4497; IL-6 female F = 1.646, p = 0.2185; TNF-alpha male F = 1.645, p = 0.2186; TNF-alpha female F = 3.241, p = 0.0499 [CD vs. CDVB not significant, WD vs. WDVB not significant]; MCP-1 male F = 2.467, p = 0.1021; MCP-1 female F = 2.048, p = 0.1477).
Extended Data Fig. 9. Transcription factor analysis for Western Diet-fed conventional mice.
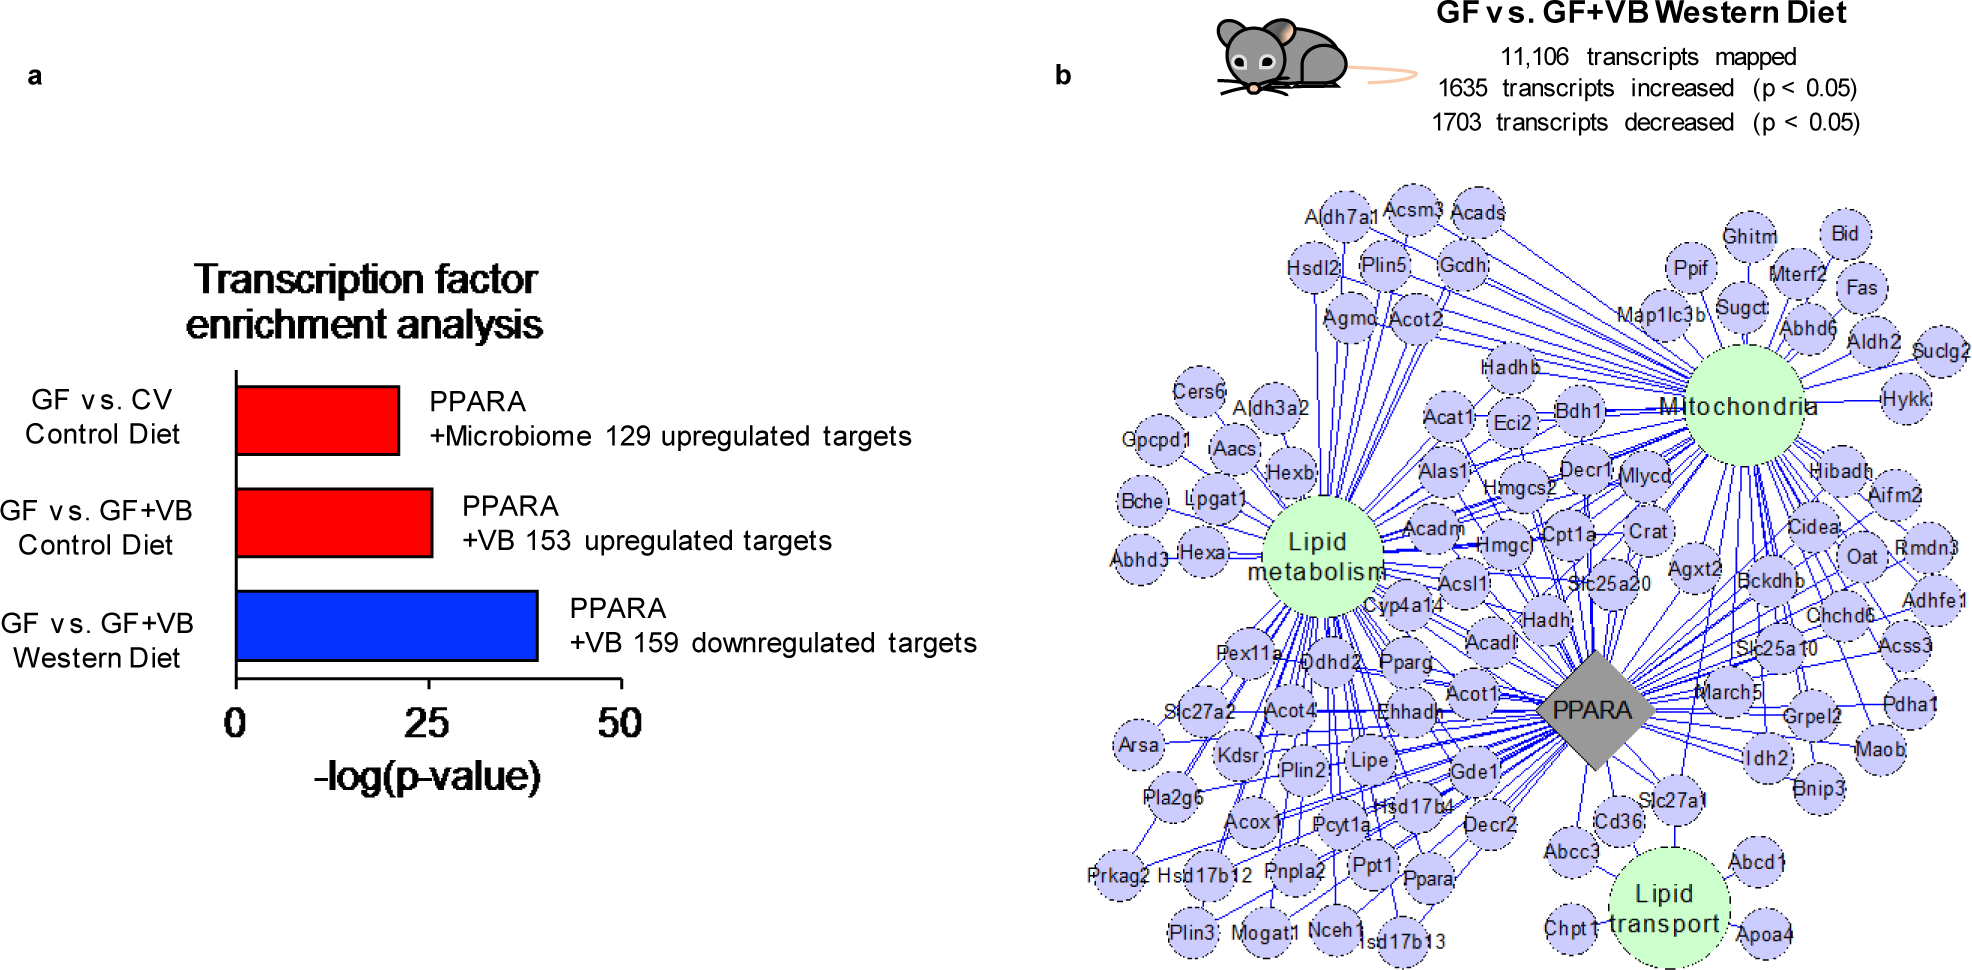
Transcription factor enrichment analysis shows that Ppara target genes are upregulated by a) microbiome acquisition and VB treatment in control diet fed GF mice. Ppara target genes are downregulated by VB treatment in Western diet (WD) fed GF mice. b) VB treatment in WD fed mice downregulates genes linked to Ppara which function in mitochondria and lipid processing pathways (p-value < 0.005, FC < 0.8)
Extended Data Fig. 10. Urinary carnitine correlations with urinary VB.
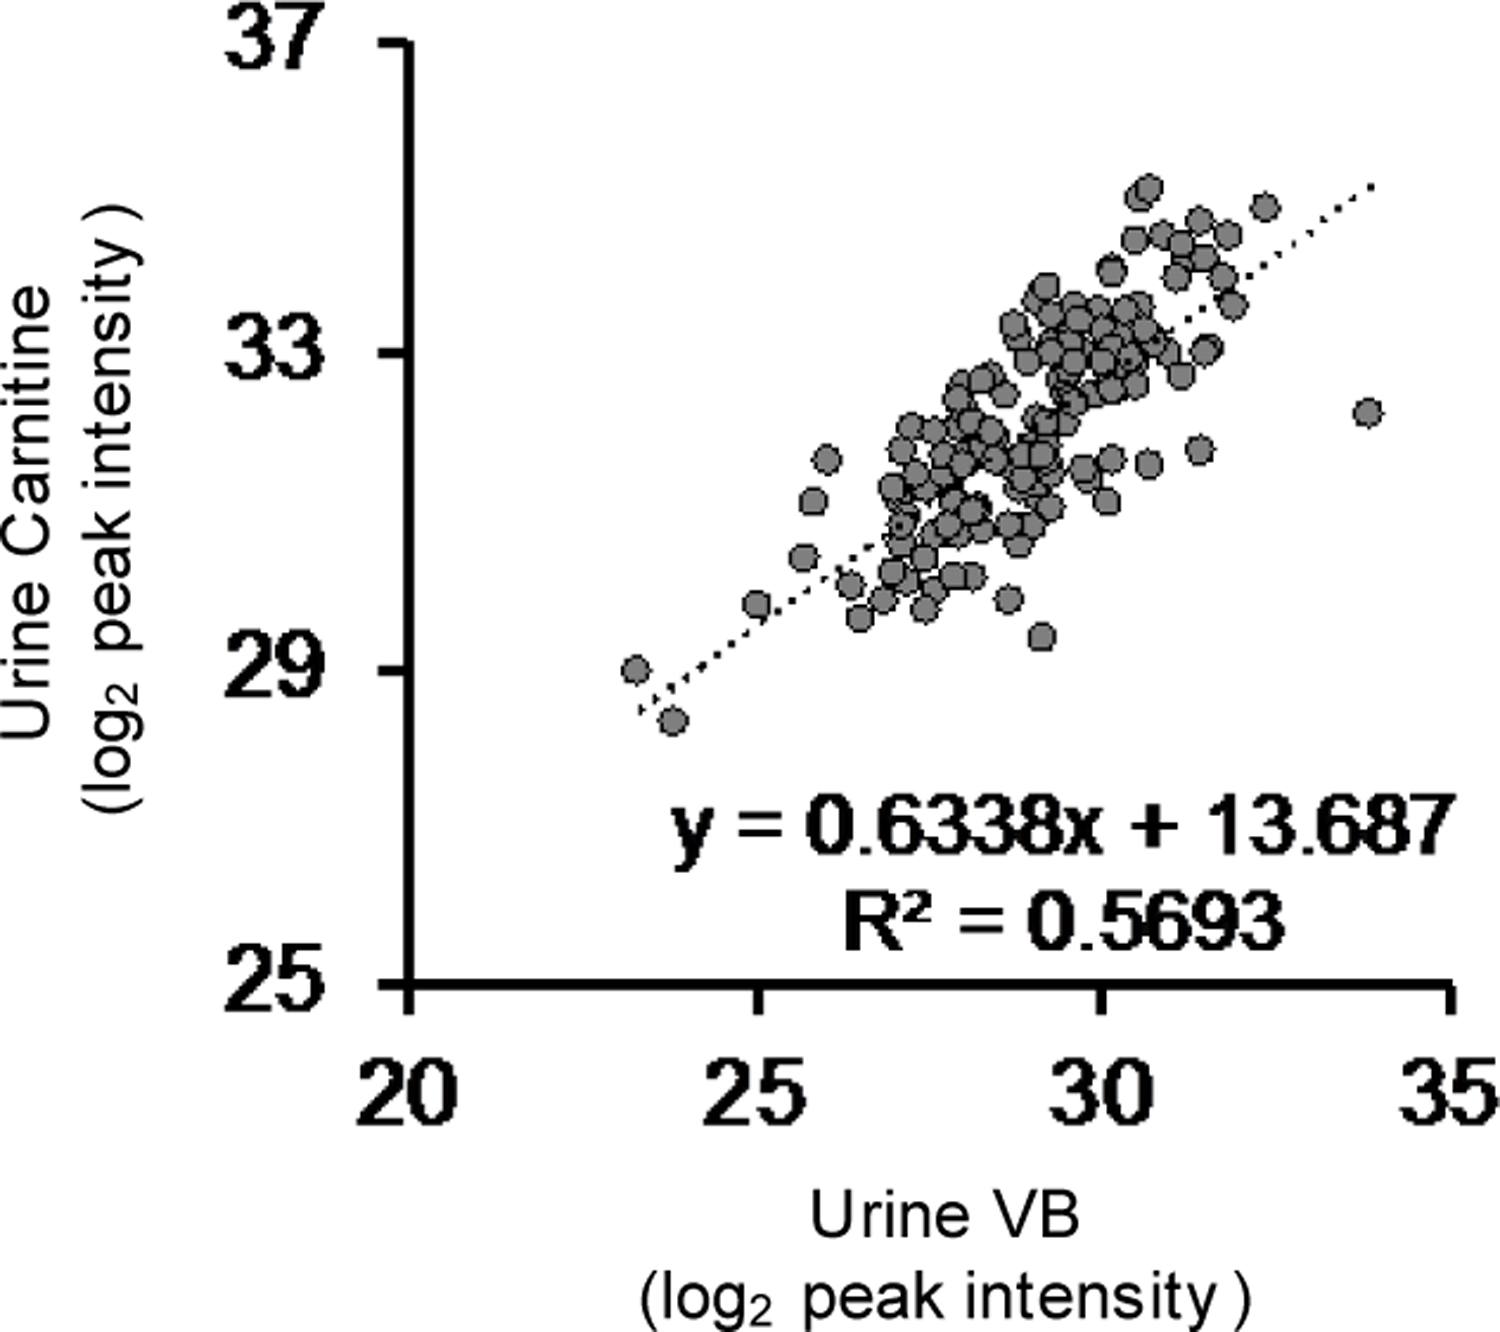
Urinary carnitine is correlated with urinary VB in humans (n = 143, Pearson’s R = 0.754, p < 0.00001).
Supplementary Material
Acknowledgments
This work was supported by T32 GM008602 (KHL), P30 ES019776 (DPJ), R01 ES023485 (DPJ, YG), U2C ES030163 (DPJ), R2C DK118619 (DPJ), S10 OD018006 (DPJ), K01 DK102851 (JAA), R03 DK117246 (JAA), K24 DK096574 (TRZ, JAA), R21HD089056 (MV), R00AA021803 (SY), R01AA026086 (SY), and R01AI064462 (ASN). Additionally, the authors would like to acknowledge support from the Georgia Clinical and Translational Science Alliance UL1 TR002378 and the Emory-Georgia Tech Predictive Health Institute and Center for Health Discovery and Well Being. The funders had no role in study design, data collection, and analysis, decision to publish or preparation of the manuscript.
Footnotes
Competing interests
Authors have no conflict of interest.
References
- 1.Miranda JJ et al. Understanding the rise of cardiometabolic diseases in low- and middle-income countries. Nature medicine 25, 1667–1679, doi: 10.1038/s41591-019-0644-7 (2019). [DOI] [PubMed] [Google Scholar]
- 2.Wang Y et al. Has the prevalence of overweight, obesity and central obesity levelled off in the United States? Trends, patterns, disparities, and future projections for the obesity epidemic. LID - dyz273 [pii] LID - 10.1093/ije/dyz273 [doi]. [DOI] [PMC free article] [PubMed]
- 3.Carding S, Verbeke K, Vipond DT, Corfe BM & Owen LJ Dysbiosis of the gut microbiota in disease. [DOI] [PMC free article] [PubMed]
- 4.Rosenbaum M, Knight R & Leibel RL The gut microbiota in human energy homeostasis and obesity. Trends Endocrinol Metab 26, 493–501, doi: 10.1016/j.tem.2015.07.002 (2015). [DOI] [PMC free article] [PubMed] [Google Scholar]
- 5.Ignacio A et al. Correlation between body mass index and faecal microbiota from children. Clin Microbiol Infect 22, 258 e251–258, doi: 10.1016/j.cmi.2015.10.031 (2016). [DOI] [PubMed] [Google Scholar]
- 6.Gonzalez FJ, Jiang C & Patterson AD An Intestinal Microbiota-Farnesoid X Receptor Axis Modulates Metabolic Disease. Gastroenterology 151, 845–859, doi: 10.1053/j.gastro.2016.08.057 (2016). [DOI] [PMC free article] [PubMed] [Google Scholar]
- 7.San-Cristobal R. A.-O. h. o. o., Navas-Carretero S. A.-O. h. o. o., Martinez-Gonzalez M. A. A.-O. h. o. o., Ordovas J. M. A.-O. h. o. o. & Martinez JA Contribution of macronutrients to obesity: implications for precision nutrition. LID - 10.1038/s41574-020-0346-8 [doi]. [DOI] [PubMed] [Google Scholar]
- 8.Holmes E, Li JV, Athanasiou T, Ashrafian H & Nicholson JK Understanding the role of gut microbiome-host metabolic signal disruption in health and disease. Trends Microbiol 19, 349–359, doi: 10.1016/j.tim.2011.05.006 (2011). [DOI] [PubMed] [Google Scholar]
- 9.Spanogiannopoulos P, Bess EN, Carmody RN & Turnbaugh PJ The microbial pharmacists within us: a metagenomic view of xenobiotic metabolism. Nat Rev Microbiol 14, 273–287, doi: 10.1038/nrmicro.2016.17 (2016). [DOI] [PMC free article] [PubMed] [Google Scholar]
- 10.Cani PD et al. Metabolic Endotoxemia Initiates Obesity and Insulin Resistance. Diabetes 56, 1761–1772, doi: 10.2337/db06-1491 (2007). [DOI] [PubMed] [Google Scholar]
- 11.Cani PD et al. Changes in Gut Microbiota Control Metabolic Endotoxemia-Induced Inflammation in High-Fat Diet–Induced Obesity and Diabetes in Mice. Diabetes 57, 1470–1481, doi: 10.2337/db07-1403 (2008). [DOI] [PubMed] [Google Scholar]
- 12.Hoyles L et al. Molecular phenomics and metagenomics of hepatic steatosis in non-diabetic obese women. Nat Med 24, 1070–1080, doi: 10.1038/s41591-018-0061-3 (2018). [DOI] [PMC free article] [PubMed] [Google Scholar]
- 13.Wang Z et al. Gut flora metabolism of phosphatidylcholine promotes cardiovascular disease. Nature 472, 57–63, doi: 10.1038/nature09922 (2011). [DOI] [PMC free article] [PubMed] [Google Scholar]
- 14.Koeth RA et al. Intestinal microbiota metabolism of L-carnitine, a nutrient in red meat, promotes atherosclerosis. Nat Med 19, 576–585, doi: 10.1038/nm.3145 (2013). [DOI] [PMC free article] [PubMed] [Google Scholar]
- 15.Wikoff WRA, A. T.; Liu J; Schultz PG; Lesley SA; Peters EC; Siuzdak G Metabolomics analysis reveals large effects of gut microflora on mammalian blood metabolites. PNAS 106, 3698–3703 (2009). [DOI] [PMC free article] [PubMed] [Google Scholar]
- 16.Peisl BYL, Schymanski EL & Wilmes P Dark matter in host-microbiome metabolomics: Tackling the unknowns-A review. Anal Chim Acta 1037, 13–27, doi: 10.1016/j.aca.2017.12.034 (2018). [DOI] [PubMed] [Google Scholar]
- 17.Goo E, An JH, Kang Y & Hwang I Control of bacterial metabolism by quorum sensing. [DOI] [PubMed]
- 18.Bajpai P, Darra A & Agrawal A Microbe-mitochondrion crosstalk and health: An emerging paradigm. Mitochondrion 39, 20–25, doi: 10.1016/j.mito.2017.08.008 (2018). [DOI] [PubMed] [Google Scholar]
- 19.Donohoe DR et al. The microbiome and butyrate regulate energy metabolism and autophagy in the mammalian colon. Cell Metab 13, 517–526, doi: 10.1016/j.cmet.2011.02.018 (2011). [DOI] [PMC free article] [PubMed] [Google Scholar]
- 20.Mollica MP et al. Butyrate Regulates Liver Mitochondrial Function, Efficiency, and Dynamics in Insulin-Resistant Obese Mice. Diabetes 66, 1405–1418, doi: 10.2337/db16-0924 (2017). [DOI] [PubMed] [Google Scholar]
- 21.Yardeni T et al. Host mitochondria influence gut microbiome diversity: A role for ROS. Science Signaling 12, eaaw3159, doi: 10.1126/scisignal.aaw3159 (2019). [DOI] [PubMed] [Google Scholar]
- 22.Bäckhed FM, J. K.; Semenkovich CF; Gordon JI Mechanisms underlying the resistance to diet-induced obesity in germ-free mice. PNAS 104, 979–984 (2007). [DOI] [PMC free article] [PubMed] [Google Scholar]
- 23.Bellissimo MP et al. Plasma High-Resolution Metabolomics Differentiates Adults with Normal Weight Obesity from Lean Individuals. Obesity 27, 1729–1737, doi: 10.1002/oby.22654 (2019). [DOI] [PMC free article] [PubMed] [Google Scholar]
- 24.Cioffi C & Vos MB Su1506 - Comparison of Plasma Metabolomics Profiles of Pediatric NASH vs. NAFLD. Gastroenterology 154, S-1161, doi: 10.1016/S0016-5085(18)33847-2 (2018). [DOI] [Google Scholar]
- 25.Mølstad P The Efflux of L-carnitine from Cells in Culture (CCL27). Biochim Biophys Acta 597, 166–173 (1980). [DOI] [PubMed] [Google Scholar]
- 26.Nagata N et al. Effects of bowel preparation on the human gut microbiome and metabolome. Sci Rep 9, 4042, doi: 10.1038/s41598-019-40182-9 (2019). [DOI] [PMC free article] [PubMed] [Google Scholar]
- 27.Ringseis R, Keller J & Eder K Role of carnitine in the regulation of glucose homeostasis and insulin sensitivity: evidence from in vivo and in vitro studies with carnitine supplementation and carnitine deficiency. Eur J Nutr 51, 1–18, doi: 10.1007/s00394-011-0284-2 (2012). [DOI] [PubMed] [Google Scholar]
- 28.Fritz IB Action of carnitine on long chain fatty acid oxidation by liver. Am. J. Physiol 197, 297–304 (1959). [DOI] [PubMed] [Google Scholar]
- 29.Noland RC et al. Carnitine insufficiency caused by aging and overnutrition compromises mitochondrial performance and metabolic control. [DOI] [PMC free article] [PubMed]
- 30.Bianchi PBL, D. C.; Davis AT Carnitine Supplementation Ameliorates the Steatosis and Ketosis Induced by Pivalate in Rats. J Nutr 126, 2873–2879 (1996). [DOI] [PubMed] [Google Scholar]
- 31.Asai T et al. Combined therapy with PPARalpha agonist and L-carnitine rescues lipotoxic cardiomyopathy due to systemic carnitine deficiency. Cardiovasc Res 70, 566–577, doi: 10.1016/j.cardiores.2006.02.005 (2006). [DOI] [PubMed] [Google Scholar]
- 32.Jiang F et al. L-carnitine ameliorates the liver inflammatory response by regulating carnitine palmitoyltransferase I-dependent PPARγ signaling. Molecular Medicine Reports 13, 1320–1328, doi: 10.3892/mmr.2015.4639 (2016). [DOI] [PubMed] [Google Scholar]
- 33.Libert DM, Nowacki AS & Natowicz MR Metabolomic analysis of obesity, metabolic syndrome, and type 2 diabetes: amino acid and acylcarnitine levels change along a spectrum of metabolic wellness. PeerJ 6, doi: 10.7717/peerj.5410 (2018). [DOI] [PMC free article] [PubMed] [Google Scholar]
- 34.Koves TR et al. Mitochondrial overload and incomplete fatty acid oxidation contribute to skeletal muscle insulin resistance. Cell Metab 7, 45–56, doi: 10.1016/j.cmet.2007.10.013 (2008). [DOI] [PubMed] [Google Scholar]
- 35.Spaniol M et al. Mechanisms of liver steatosis in rats with systemic carnitine deficiency due to treatment with trimethylhydraziniumpropionate. Journal of Lipid Research 44, 144–153, doi: 10.1194/jlr.M200200-JLR200 (2003). [DOI] [PubMed] [Google Scholar]
- 36.Karkkainen O et al. Diets rich in whole grains increase betainized compounds associated with glucose metabolism. [DOI] [PubMed]
- 37.Servillo L et al. Ruminant meat and milk contain delta-valerobetaine, another precursor of trimethylamine N-oxide (TMAO) like gamma-butyrobetaine. Food Chem 260, 193–199, doi: 10.1016/j.foodchem.2018.03.114 (2018). [DOI] [PubMed] [Google Scholar]
- 38.Servillo L et al. Carnitine Precursors and Short-Chain Acylcarnitines in Water Buffalo Milk. J Agric Food Chem 66, 8142–8149, doi: 10.1021/acs.jafc.8b02963 (2018). [DOI] [PubMed] [Google Scholar]
- 39.Ye EQ, Chacko Sa Fau - Chou EL, Chou El Fau - Kugizaki M, Kugizaki M, Fau - Liu S & Liu S Greater whole-grain intake is associated with lower risk of type 2 diabetes, cardiovascular disease, and weight gain. [DOI] [PMC free article] [PubMed]
- 40.Wang Y & Beydoun MA Meat consumption is associated with obesity and central obesity among US adults. Int J Obes (Lond) 33, 621–628, doi: 10.1038/ijo.2009.45 (2009). [DOI] [PMC free article] [PubMed] [Google Scholar]
- 41.Li XS et al. Untargeted metabolomics identifies trimethyllysine, a TMAO-producing nutrient precursor, as a predictor of incident cardiovascular disease risk. JCI Insight 3, doi: 10.1172/jci.insight.99096 (2018). [DOI] [PMC free article] [PubMed] [Google Scholar]
- 42.Koeth RA et al. gamma-Butyrobetaine is a proatherogenic intermediate in gut microbial metabolism of L-carnitine to TMAO. Cell Metab 20, 799–812, doi: 10.1016/j.cmet.2014.10.006 (2014). [DOI] [PMC free article] [PubMed] [Google Scholar]
- 43.Cho I et al. Antibiotics in early life alter the murine colonic microbiome and adiposity. Nature 488, 621–626, doi: 10.1038/nature11400 (2012). [DOI] [PMC free article] [PubMed] [Google Scholar]
- 44.Cox LM Antibiotics shape microbiota and weight gain across the animal kingdom. Animal Frontiers 6, 8–14, doi: 10.2527/af.2016-0028 (2016). [DOI] [Google Scholar]
- 45.Stark CM, Susi A, Emerick J & Nylund CM Antibiotic and acid-suppression medications during early childhood are associated with obesity. Gut 68, 62–69, doi: 10.1136/gutjnl-2017-314971 (2019). [DOI] [PubMed] [Google Scholar]
- 46.Peters BA et al. A taxonomic signature of obesity in a large study of American adults. Sci Rep 8, 9749, doi: 10.1038/s41598-018-28126-1 (2018). [DOI] [PMC free article] [PubMed] [Google Scholar]
- 47.Zhao M et al. TMAVA, a Metabolite of Intestinal Microbes, Is Increased in Plasma From Patients With Liver Steatosis, Inhibits gamma-butyrobetaine Hydroxylase, and Exacerbates Fatty Liver in Mice. LID - S0016–5085(20)30244–4 [pii] LID - 10.1053/j.gastro.2020.02.033 [doi]. [DOI] [PubMed]
- 48.Sagan L On the Origin of Mitosing Cells. J. Theoret. Biol 14, 225–274 (1967). [DOI] [PubMed] [Google Scholar]
- 49.Ristow M Unraveling the truth about antioxidants: mitohormesis explains ROS-induced health benefits. Nat Med 20, 709–711, doi: 10.1038/nm.3624 (2014). [DOI] [PubMed] [Google Scholar]
- 50.Khan SA et al. ATGL-Catalyzed Lipolysis Regulates SIRT1 to Control PGC-1α/PPAR-α Signaling. Diabetes 64, 418, doi: 10.2337/db14-0325 (2015). [DOI] [PMC free article] [PubMed] [Google Scholar]
- 51.Montagner A et al. Liver PPARalpha is crucial for whole-body fatty acid homeostasis and is protective against NAFLD. [DOI] [PMC free article] [PubMed]
- 52.Azevedo RA & Arruda P High-lysine maize: the key discoveries that have made it possible. [DOI] [PubMed]
- 53.Torre D, Lachmann A & Ma’ayan A BioJupies: Automated Generation of Interactive Notebooks for RNA-Seq Data Analysis in the Cloud. Cell Systems 7, 556–561.e553, doi: 10.1016/j.cels.2018.10.007 (2018). [DOI] [PMC free article] [PubMed] [Google Scholar]
- 54.Go YM et al. Mitochondrial metabolomics using high-resolution Fourier-transform mass spectrometry. Methods in molecular biology 1198, 43–73, doi: 10.1007/978-1-4939-1258-2_4 (2014). [DOI] [PMC free article] [PubMed] [Google Scholar]
- 55.Liu KH et al. High-Resolution Metabolomics Assessment of Military Personnel: Evaluating Analytical Strategies for Chemical Detection. J Occup Environ Med 58, S53–61, doi: 10.1097/JOM.0000000000000773 (2016). [DOI] [PMC free article] [PubMed] [Google Scholar]
- 56.Liu KH et al. Reference Standardization for Quantification and Harmonization of Large-Scale Metabolomics. Analytical Chemistry, doi: 10.1021/acs.analchem.0c00338 (2020). [DOI] [PMC free article] [PubMed] [Google Scholar]
- 57.Yu T & Jones DP Improving peak detection in high-resolution LC/MS metabolomics data using preexisting knowledge and machine learning approach. Bioinformatics 30, 2941–2948, doi: 10.1093/bioinformatics/btu430 (2014). [DOI] [PMC free article] [PubMed] [Google Scholar]
- 58.Yu T, Park Y, Johnson JM & Jones DP apLCMS--adaptive processing of high-resolution LC/MS data. Bioinformatics 25, 1930–1936, doi: 10.1093/bioinformatics/btp291 (2009). [DOI] [PMC free article] [PubMed] [Google Scholar]
- 59.Uppal K et al. xMSanalyzer: automated pipeline for improved feature detection and downstream analysis of large-scale, non-targeted metabolomics data. BMC bioinformatics 14, 15, doi: 10.1186/1471-2105-14-15 (2013). [DOI] [PMC free article] [PubMed] [Google Scholar]
- 60.Ritchie ME et al. limma powers differential expression analyses for RNA-sequencing and microarray studies. Nucleic Acids Research 43, e47–e47, doi: 10.1093/nar/gkv007 (2015). [DOI] [PMC free article] [PubMed] [Google Scholar]
- 61.Li S et al. Predicting network activity from high throughput metabolomics. PLoS Comput Biol 9, e1003123, doi: 10.1371/journal.pcbi.1003123 (2013). [DOI] [PMC free article] [PubMed] [Google Scholar]
- 62.Uppal K, Walker DI & Jones DP xMSannotator: An R Package for Network-Based Annotation of High-Resolution Metabolomics Data. Anal Chem 89, 1063–1067, doi: 10.1021/acs.analchem.6b01214 (2017). [DOI] [PMC free article] [PubMed] [Google Scholar]
- 63.Smith CA et al. METLIN: a metabolite mass spectral database. [DOI] [PubMed]
- 64.Tars K et al. Targeting Carnitine Biosynthesis: Discovery of New Inhibitors against γ-Butyrobetaine Hydroxylase. Journal of Medicinal Chemistry 57, 2213–2236, doi: 10.1021/jm401603e (2014). [DOI] [PubMed] [Google Scholar]
- 65.Chen CM, F. & Leo Benoiton N A new method of quaternizing amines and its use in amino acid and peptide chemistry. Vol. 54 (2011). [Google Scholar]
- 66.R: A language environment for statistical computing (R Foundation for Statistical Computing, Vienna Austria: ). [Google Scholar]
- 67.Rask KJ, Brigham Kl Fau - Johns MME & Johns MM Integrating comparative effectiveness research programs into predictive health: a unique role for academic health centers. [DOI] [PubMed]
- 68.Brigham KL Predictive health: the imminent revolution in health care. [DOI] [PMC free article] [PubMed]
- 69.Soltow QA et al. High-performance metabolic profiling with dual chromatography-Fourier-transform mass spectrometry (DC-FTMS) for study of the exposome. Metabolomics 9, 132–143, doi: 10.1007/s11306-011-0332-1 (2011). [DOI] [PMC free article] [PubMed] [Google Scholar]
- 70.Kaul S et al. Dual-energy X-ray absorptiometry for quantification of visceral fat. [DOI] [PMC free article] [PubMed]
Associated Data
This section collects any data citations, data availability statements, or supplementary materials included in this article.
Supplementary Materials
Data Availability Statement
Source data for figures are provided. RNAsequencing data are available at the NCBI Gene Expression Omnibus (GEO) GSE185525 and GSE145012. Other data that support the findings of this study are available on request from the corresponding authors. 9VB)