

Abstract
Imaging mass spectrometry (IMS) allows the location and abundance of lipids to be mapped across tissue sections of human retina. For reproducible and accurate information, sample preparation methods need to be optimized. Paraformaldehyde fixation of a delicate multilayer structure like human retina facilitates the preservation of tissue morphology by forming methylene bridge crosslinks between formaldehyde and amine/ thiols in biomolecules; however, retina sections analyzed by IMS are typically fresh-frozen. To determine if clinically significant inferences could be reliably based on fixed tissue, we evaluated the effect of fixation on analyte detection, spatial localization, and introduction of artefactual signals. Hence, we assessed the molecular identity of lipids generated by matrix-assisted laser desorption ionization (MALDI-IMS) and liquid chromatography coupled tandem mass spectrometry (LC-MS/MS) for fixed and fresh-frozen retina tissues in positive and negative ion modes. Based on MALDI-IMS analysis, more lipid signals were observed in fixed compared to fresh-frozen retina. More potassium adducts were observed in fresh-frozen tissues than fixed as the fixation process caused displacement of potassium adducts to protonated and sodiated species in ion positive ion mode. LC-MS/MS analysis revealed an overall decrease in lipid signals due to fixation that reduced glycerophospholipids and glycerolipids and conserved most sphingolipids and cholesteryl esters. The high quality and reproducible information from untargeted lipidomics analysis of fixed retina informs on all major lipid classes, similar to fresh-frozen retina, and serves as a steppingstone towards understanding of lipid alterations in retinal diseases.
Keywords: age-related macular degeneration, AMD, retina, fresh-frozen, fixed, lipids, LC-MS/MS, MALDI-IMS
1. INTRODUCTION
MALDI-IMS is an analytical tool capable of mapping the distribution of lipids at the single cell level with high spatial accuracy and chemical specificity.1 In a typical workflow, MALDI-IMS detects exact masses of unknown molecules.1–4 In contrast, LC-MS/MS facilitates structural elucidation by generating molecularly-specific fragmentation spectra.1–3,5,6 Combining analyte localization with accurate mass measurements from MALDI-IMS2,7,8 with structural characterization by LC-MS/MS7,9 greatly enhances the breadth and depth of analysis of a tissue lipidome.10–12 MALDI-IMS analysis is typically done directly on fresh-frozen tissue sections so as to avoid chemical alterations. 13–21 However, freezing can have deleterious effects on fine tissue morphology13. A few published studies investigated the effect of tissue fixation on lipid IMS22–28.
Paraformaldehyde-fixed paraffin-embedded fixation is the gold standard method for tissue preservation and histological examination.29–31 For MALDI-IMS analysis, fixed tissue sections are typically placed on poly-lysine coated indium-tin-oxide slides and deparaffinized with organic solvents, such as xylene, followed by matrix application32. A major limitation of fixed sections for MALDI-IMS is loss of sample lipids due to organic solvents not only at the deparaffinization step but also at the initial embedding steps. 32–34 An alternative approach is to fix tissue, followed by cryosectioning1, without embedding in paraffin. However, fixation introduces chemical modification by cross-linking formaldehyde to amine/thiols in tissue biomolecules.31 Thus, it remains to be determined if the same lipids are detected in fixed and fresh-frozen tissues.
The retina is part of the central nervous system that separates from the brain in development and has its own neural circuits and unique lipids. 35–37 The lipid composition of human retina and the role of polyunsaturated long chain fatty acids and lipoprotein-related lipids of intraocular and systemic origin in age related macular degeneration (AMD) and other diseases is under active investigation. 35,36,38,39,40,41 The retina offers both opportunities and challenges for MALDI-IMS. The retina has exquisite tissue architecture due to horizontally alligned and structurally distinct layers of cells that are visible in histology and in diagnostic clinical imaging.42 However, the cone and rod photoreceptors are particularly delicate and prone to detaching from their underlying support tissues post-mortem. Furthermore, the fovea, a tissue specialization for high acuity and color vision, is small (<1 mm), thin (~250 µm), and easily damaged. Hence, to investigate this complex tissue at the molecular level with spatial accuracy, fixation is preferred to retain morphology.23,43
Previous studies demonstrated that lipids in fixed tissue differed from those in fresh-frozen tissue based on UPLC-MS, GC-MS, and MALDI-IMS technologies. 22,32,34,44–50 Of these three technologies, MALDI-IMS exhibited the maximal overlap of ions observed in paraformaldehyde-fixed and fresh-frozen tissue.22–27 Regarding studies of retina, Ly et al23 developed and compared lipid imaging by applying MALDI-IMS in fresh-frozen vs fixed mammalian (porcine) retina. To date molecular identification and characterization of lipids in fresh-frozen compared to fixed human retina has not been reported using MALDI-IMS. Further, extraction conditions and separation efficiency of LC-MS/MS to maximize lipidome coverage have not been explored for human retina. Herein, we performed an in-depth investigation of human retina and its supporting tissue using two complementary analytical methods, MALDI-IMS and LC-MS/MS in fresh-frozen and fixed human retina in positive and negative ion modes to determine if fixation adversely affects analyte detection or introduces artifactual signals.
MATERIALS AND METHODS
2.1. Materials
HPLC grade chloroform, methanol, isopropanol, acetonitrile, and water were purchased from Fisher Scientific (Pittsburg, PA). Formic acid and ammonium formate were obtained from Sigma-Aldrich (St. Louis, MO). tert-Butyl methyl ether (MTBE) was purchased from Honeywell (Charlotte, NC). SPLASH® LIPIDOMIX® Mass Spec Standard (15:0–18:1(d7) PC, 15:0–18:1(d7), PE, 15:0–18:1(d7) PS (Na Salt), 15:0–18:1(d7) PG (Na Salt), 15:0–18:1(d7) PI (NH4 Salt), 15:0–18:1(d7) PA (Na Salt), 18:1(d7) Lyso PC, 18:1(d7) Lyso PE, 18:1(d7) Chol Ester, 18:1(d7) MAG, 15:0–18:1(d7) DAG, 15:0–18:1(d7)-15:0 TAG, d18:1–18:1(d9) SM, Cholesterol (d7)), CL 18: 2(d5) and C24 Cer(d18:1/24:0) were from Avanti Polar Lipids, Alabaster, AL, U.S.
2.2. Methods
2.2.1. Tissue preparation and MALDI-IMS procedure
Whole eyes were obtained from deceased human donors via Advancing Sight Network (Birmingham AL USA). As part of a study of AMD, donors were ≥ 80 years of age, white, and non-diabetic, and death-to-processing time was ≤6 hours. Tissues were prepared at the University of Alabama at Birmingham, and IMS data were acquired at Vanderbilt University. Methods were performed as described in Anderson et al. 4 In brief, the cornea was removed and the iris incised radially to allow fixative to infiltrate the globe. Globes were immersed in phosphate buffered 4% paraformaldehyde (PFA) for 24 hours, then in 1% PFA until processed. Fresh-frozen eyes were prepared without fixation and the cornea removed. The posterior part of the eye (sclera, choroid, retina) was dissected and embedded in carboxymethylcellulose (CMC) alongside the fixed eye so that the fresh-frozen and fixed eyes were in the same block, sectioned together, and sections placed on the same slide and processed for IMS together. CMC powder was mixed in deionized water, heated to 70°C, stirred until dissolved.51 Full-eye-wall thickness rectangular pieces of both fixed and fresh-frozen tissues were placed into cryomolds (Peel-A-Way 22 × 30 mm molds, Polysciences # 18646B) using a stereo microscope and oriented so the superior edge was sectioned first. Molds were filled with 15 ml of carboxymethyl cellulose, flash frozen with liquid nitrogen, and stored at −80°C until sectioned. For histopathologic evaluation, 12 µm cryosections were collected from both fresh-frozen and fixed tissues in the same tissue block. Sections were placed on pre-labeled 25 × 75 mm glass slides coated with a dilution of 0.01% poly-L-Lysine (Sigma Aldrich, St. Louis, MO, USA) and maintained at −20°C during sectioning. During this process, 10 sections at 20 µm thickness for LC-MS were collected and thaw-mounted and dried onto precleaned uncoated glass slides (Tanner Scientific, FL, USA). At pre-defined intervals in the glass slide series, sections for IMS analysis were captured on large, 45×45 mm indium-tin-oxide slides (Delta Technologies Loveland, CO, USA) that were coated in-house with poly-lysine. A slide box was vacuum-packed with an oxygen-absorbing packet to help prevent oxidation and deterioration of lipid signal and stored at −80°C in a Bitran freezer bag for transport to Vanderbilt.
Samples were brought to room temperature before the matrices, 2,5-dihydroxyacetophenone (DHA) for positive ion mode analysis and 1,5-diaminonaphalene (DAN) for negative ion mode analysis, were applied using an in-house sublimation device set at 130 ° C. Sublimation times were 8 minutes for DHA and 15 minutes for DAN. MALDI-IMS data were acquired in positive and negative ion mode with a 15–20 µm pixel size in full scan using a solariX 9.4T FTICR mass spectrometer (Bruker Daltonics). In order to obtain higher spatial resolution allowing for a 10 µm pixel size, the instrument source was modified to include an external desorption laser and associated optics.
2.2.2. Periodic acid Schiff stain (PASH)
Adjacent sections from the same donor tissue were initially rehydrated in deionized water (DI) (for 30 seconds) then placed in Periodic Acid 0.5% for 5 minutes. Sections were then rinsed with DI water 4 times using clean water each time. Sections were then added to Schiff reagent for 15 minutes before rinsing again with DI water for 10 minutes. Sections were then stained with Harris Hematoxylin for 5 minutes and again rinsed well with DI water. Sections then received a quick dip (20 seconds) in acid alcohol 0.5% and then washed for 5 minutes in DI water. Sections were then dipped in bluing solution with 1 % lithium carbonate 2 times for 40 seconds. Sections were then dehydrated in graded ethanol solutions (75, 85, 95, and 100%) for 10 minutes at each concentration followed by xylene for 10 minutes. Coverslips were mounted (Permount, Electron Microscopy Science, Hatfield, PA, USA) and dried overnight.
2.2.3. MALDI-IMS data processing
MALDI-IMS data were processed using the R package Cardinal52. Data were loaded from the peak picked Bruker .sqlite file with a mass resolution of ppm = 0.5. Using Cardinal, a mean spectrum was generated from across all spectra and peak picking (signal-to-noise ratio = 3) was performed to reduce the data to 618 and 329 features in positive and negative modes, respectively. The peaks from the mean spectra were sorted by signal abundance and signals with a high fold change were plotted in FlexImaging software. Exact masses of these features were searched in LIPIDMAPS, and tentative annotations were made from database hits using mMass53. Tentative annotations were then collated by lipid class for comparison across preparation methods. Differential analysis of frozen and fixed data was performed by comparing mean spectra after removal of off-tissue pixels. Noise and off-tissue IMS pixels were identified by using the spatial shrunken centroids algorithm in Cardinal (using parameters k = 10, r=1 and s=1)54 and removing segments with primarily matrix signal in the t-statistics plot.
2.2.4. Lipid extraction and LC-MS/MS procedure
Triplicate human donor eyes from three different donors were identified and processed as described above were used for lipid extraction. Ten samples of 20 µm thick sections of embedded fresh-frozen and fixed retina tissue were used for lipid extraction. Under a dissecting microscope, the sclera was carefully removed with a scalpel blade. The remaining retina-choroid tissue was scraped from the glass slide and placed in a 1.5 mL HPLC glass vial. One mL of MMC55 extraction mixture (1.3:1:1, methanol: tert-Butyl methyl ether (MTBE): chloroform) was spiked with 10 µL of lipid standard mixture (SPLASH® LIPIDOMIX® Mass Spec Standard from Avanti Polar Lipids, Alabaster, AL, U.S) in the glass vial, vortexed for 60 seconds and centrifuged at 3000 rpm for 10 minutes. The supernatant was transferred to a separate HPLC vial and was evaporated to dryness. The sample was then reconstituted with 30 µL methanol and 10 µL was subjected to LC-MS/MS analysis. Three biological replicates from fresh-frozen and fixed tissue were used to perform LC-MS/MS analysis in positive and negative ionization modes.
Chromatographic separation5 was achieved using an ACQUITY UPLC BEH C-18 column (2.1 X 150mm, 1.7 µm particle size) (Waters Corporation, Milford, MA, USA) held at 50°C coupled to a Vanquish binary pump (Thermo Fisher Scientific, San Jose, CA). A gradient mobile phase was generated over 55 minutes with a flow rate of 250 µL/min and was comprised of 10 mM ammonium formate in 40:60 (v/v) water: acetonitrile with 0.1% formic acid and 10 mM ammonium formate in 90:10 v/v) isopropanol: acetonitrile with 0.1% formic acid. The gradient elution profile was as follows: 32% B (0–1.5 min), 32–45% B(1.5–4 min), 45–52% B(4–6 min), 52–58% B(6–10 min), 58–66% B (10–16 min), 66–70% B (16–22 min), 70–75% B(22–30 min), 75–97% B(30–38 min), 97%B (38–48 min), 97–32% B(48–50 min), 32% B(50–55 min). Ten µL of sample was injected via the Vanquish autosampler maintained at 4°C, HPLC eluate flowed into a HESI heated ESI source, and ions were analyzed using a Q Exactive HF instrument (Thermo Scientific, San Jose, CA, USA). Data were acquired at both full (MS1) and data dependent MS2 (ddMS2) scan modes using positive and negative modes separately. The full scan mode had a mass resolution of 60000, mass range of m/z 400–1200 in positive polarity and m/z 240–1600 in negative polarity and a maximum trap fill time of 100 ms. ddMS2 data were acquired at 15,000 resolution with a maximum trap fill time of 160 ms. The isolation window of selected MS1 ions was ± 1.4 m/z with a normalized collision energy (NCE) of 20 and 25. LC-MS/MS data were acquired using Xcalibur version 4.0.
2.2.5. Data analysis
Raw LC-MS/MS data files (Thermo .raw files) were converted to mgf, mzXML files using the MSConvert function of ProteoWizard. Mgf, mzXML input files were searched using the spectrum searcher feature of LipiDex software v1.0.256 for lipid identifications using LipiDex_HCD_Formic and LipiDex_Splash_ISTD_Formic libraries. Precursor mass-to-charge (m/z), fragmentation spectra, chromatographic retention time and identification were integrated using LipiDex. Fragmentation patterns of individual lipid standards were manually interpreted and then matched against LipiDex library results. LipidMatch57 was also used for the lipid identification and the intensity analysis.
To ensure correct annotation of individual molecular ion species, accurate m/z values for the precursor ions and subsequent ddMS2 spectra were acquired from the SPLASH® LIPIDOMIX® mixture of lipids. Lipid species were identified based on their fragmentation pattern with a mass tolerance of 0.2 ppm in negative and positive ionization modes. Confirmed lipid identifications were made by examination of tandem mass spectra for head group and fatty acyl chains, mass error measurement, isotopic profile, extracted ion chromatogram, and the retention time for precursor ions. LC-MS/MS data were processed to separate each lipid identification into its distinct lipid class. For each replicate, the sum of unique IDs in each lipid class was determined and set unions were calculated in custom R scripts. For m/z vs retention time (rt) plotting, the earliest rt signal of each unique ID was used for visualization.
For quantitative analysis of individual lipids by LC-MS, the peak areas for specific lipids found in all biological replicates (three fixed and three fresh-frozen) were obtained using Qual Browser with Xcalibur 4.0 software. Each sample was processed identically and the mean and standard deviation for each measured intensity is reported.
RESULTS AND DISCUSSION
3.1. Comparison of fresh-frozen and fixed human retina lipid detection by MALDI-IMS
In MALDI-IMS (Figure 1), a total of 366 lipid signals were identified including 299 in fresh-frozen and 329 in fixed retina based on MS1 confirmation including negative and positive ionization modes. There was 10% more lipid signals were observed for fixed tissue than fresh-frozen. It is possible that lower abundant species signals no longer spilt between protonated, sodiated and potassiated species resulting in higher signal to noise in fixed tissue, allowing them to be selected in the peak picking process. Other potential explanations for this observation are that fixation helps preserve tissue morphology and degradation of molecular species during storage compared to fresh-frozen tissue58,59. Further studies are required to confirm these speculations.
Figure 1:
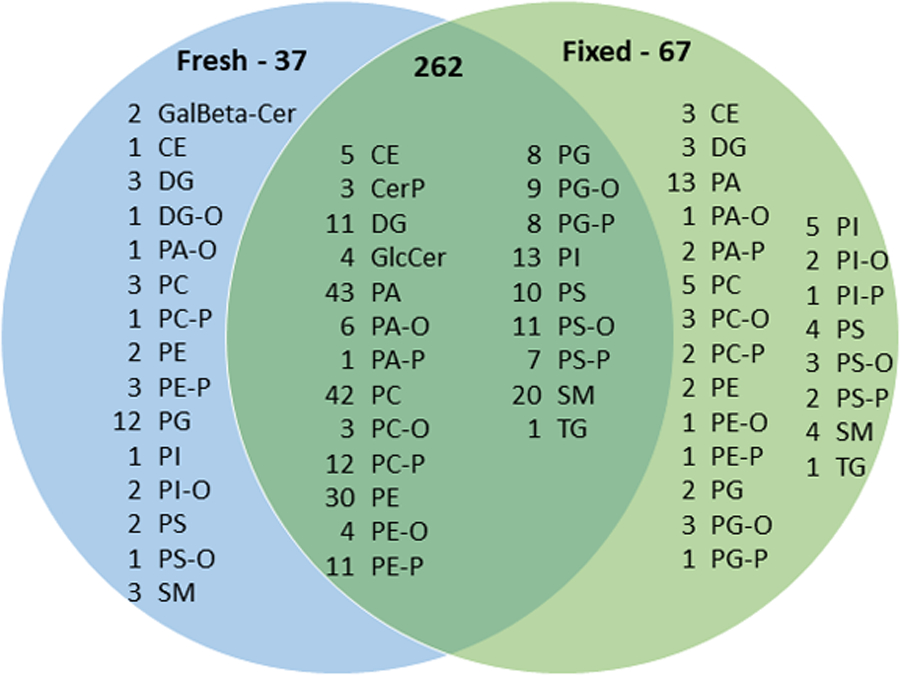
Venn diagram of lipid compositions of fresh-frozen and fixed human retina including both negative and positive ionization modes detected by MALDI-IMS.
Most lipid subclasses were conserved upon fixation including glycerolipids, sphingolipids and cholesteryl esters with the exception being glycerophospholipids (Figure 1). The major classes of lipids observed in IMS data include: glycerophospholipids; PC, PE, PG, PI, PS, PA, PC-O, PC-P, PE-O, PE-P, PG-O, PG-P, PS-P, PA-O, PA-P, PS-O, PS-P (217 common, 26 in fresh-frozen only and 51 in fixed only), glycerolipids; DG, DG-O, DGTS, MGDG, TG (14 in common, 2 in fresh-frozen only and 2 in fixed only), sphingolipids; SM, GalBeta-Cer, CerP, (32 common, 5 in fresh-frozen only and 3 in fixed only), cholesteryl esters (4 common, 1 in fresh-frozen only and 4 in fixed only). The variations in glycerophospholipid signals were mainly observed for PG/BMP species. More PA lipids were detected in fixed tissues
3.2. Lipid signal intensities for fresh-frozen and fixed retina in positive and negative ionization modes using MALDI-IMS
In this section and in Figure 2 and Supplementary Figures 1–4, “retina” includes “inner retina” and “outer retina”. Inner retina includes nerve fiber layer, ganglion cell layer, inner plexiform layer, and inner nuclear layer (NFL, GCL, IPL, INL). Panel 1 A and B displays a periodic acid-Schiff stained adjacent section with the multiple layers of the outer retina labelled, outer plexiform layer, outer nuclear layer, inner and outer segments of photoreceptors (bacillary layer), and retinal pigment epithelium (OPL, ONL, IS and OS, RPE). Choroid is a vascular bed behind the retina, and sclera is behind the choroid. It can be seen in both fixed and fresh tissues that the photoreceptor inner and outer segments display the most altered appearance. In this example, the fixed tissue looks less disrupted than the fresh.
Figure 2:
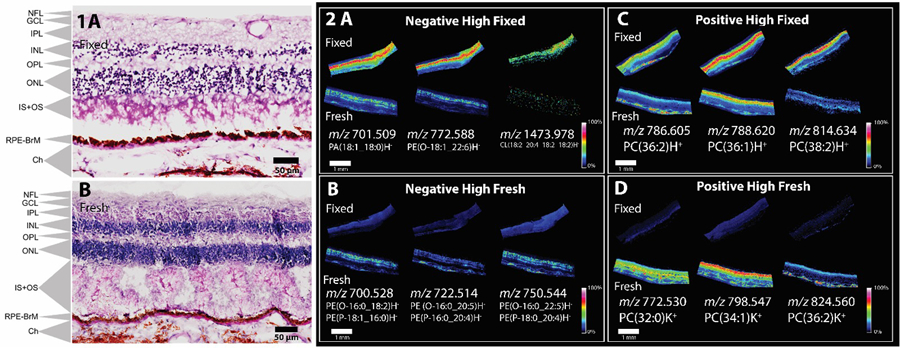
Panels 1A (fixed) and B (fresh-frozen) display zoomed PASH stained tissue from an adjacent section indicating cell layers, NFL nerve fiber layer, GCL ganglion cell layer, IPL inner plexiform layer, INL inner nuclear layer, HFL Henle fiber layer, ONL outer nuclear layer, IS+OS inner segment + outer segment, RPE-BrM retinal pigment epithelium-Bruch’s membrane, Ch choroid, Sc Sclera. MALDI-IMS analysis of 90-year-old human donor eye from fresh-frozen sample vs paraformaldehyde-fixed in peripheral sections from the same donor. Panels A-D display multiple lipid signals in both polarities in fixed and fresh-frozen tissue. Panel A and B displays negative ion mode analysis were three signals which were observed to have higher signal intensity in fixed tissue (A) and fresh-frozen tissue (B). Panel C and D displays positive ion mode analysis were three signals which were observed to have higher signal intensity in in fixed tissue (C) and fresh-frozen tissue (D).
Lipid signal variations in IMS analysis of fresh-frozen and fixed tissue are demonstrated in Figure 2. The negative ion data show the highest intensity for most lipid signals in fixed tissue. Three examples of these lipid signals are shown in Figure 2A. The investigated lipids PA, PE and CL were observed with similar distributions in the inner retina of the fixed tissue. Supplementary Figures 1 and 2 display the same signals from Figure 2 overlaid with optical images to clearly indicate signal localization in the tissue. Three examples of lipid signals that were slightly higher in negative ion mode for fresh-frozen tissue than for fixed tissue are shown in Figure 2B. These signals were comprised of plasmalogen and ether-linked PE lipids that have the same mass and cannot be distinguished from accurate mass alone; both were detected by LC-MS/MS. These signals were observed both in the retina and choroid.
In positive ionization mode the tentative identifications suggest a higher abundance of protonated species in fixed tissues as compared to fresh-frozen tissue, localized to the inner and outer retina for PC(36:2)H+ and PC(36:1)H+ and the inner retina for PC(38:2)H+ (Figure 2C). Variations in signal intensity for the positive ion mode analysis can be partially attributed to adduct formation in fresh-frozen tissue (Figure 2D). High abundance of potassium adducts can be seen in the fresh-frozen inner retina for PC(32:0)K+, PC(34:1)K+ and in the choroid, PC(36:2)K+. Very low signals for these adducts were observed in fixed tissue. A shift from potassium to sodium adduct formation has been previously observed by Carter et al 24 in fixed brain tissue. The distributions of abundant protonated, sodiated and potassiated PC lipids species are shown in Supplementary Figure 3 while highly localized TG lipid adducts in Supplementary Figure 4 show how variations in localization and intensity between fresh and fixed can have the potential to alter the number of lipids detected. These variations in intensity can also be observed in global averaged spectra exported from the imaging data using mMass in Supplementary figure 5. The negative ion spectrum shows higher intensities in the fixed tissues when compared to fresh while the positive ion data show higher intensity for the base peak at m/z 760 in the fixed tissue but the subtleties of adduct formation are not apparent at this scale. These variations are more clearly observed in the imaging data in Supplementary figure 3 and 4.
Replicate MALDI images of the signals seen in Figure 2 are shown in Supplementary Figure 6. This fresh-frozen tissue from a 83-year-old donor clearly demonstrates distorted morphology, with detachment of the photoreceptors and disruption of the outer nuclear layer. This finding underscores the value of chemical fixation for this delicate tissue. Images displaying the same signals as observed in Figure 2 from a 90-year-old donor indicates variations in CL signals were also observed in a biological replicates in Supplementary Figure 1. The CL with high intensity in the fixed tissue in the first replicate (Figure 2) did not generate a quality IMS image in second replicate (Supplementary Figure 1), although a peak was present in the spectra. A similar observation was also made with PC(38:2) at m/z 814.634. An increase in protonated signal was less apparent in these data yet a trend toward high potassium adducts in fresh-frozen tissues was observed as with Figure 2.
MALDI-IMS-investigated lipid signals based on accurate mass measurement in positive and negative ionization modes for fresh-frozen and fixed tissue are shown in Supplementary Figure 7. The protonated, sodiated and potassiated signals from individual lipid were counted as one signal. The LC-MS/MS spectra for all the IMS identified lipids in fresh-frozen and fixed retina tissue in figure 2 is shown in Supplementary figure 8.
3.3. Elution profile of lipid classes extracted using LC-MS/MS
To compare LC-MS/MS lipidomic elution profiles we aligned the common lipids found in fresh-frozen and fixed tissue based on retention time vs precursor mass as shown in Figure 3 from one of three biological replicates. Supplementary Figures 9 and 10 show consistent results from two additional biological replicates.
Figure 3:
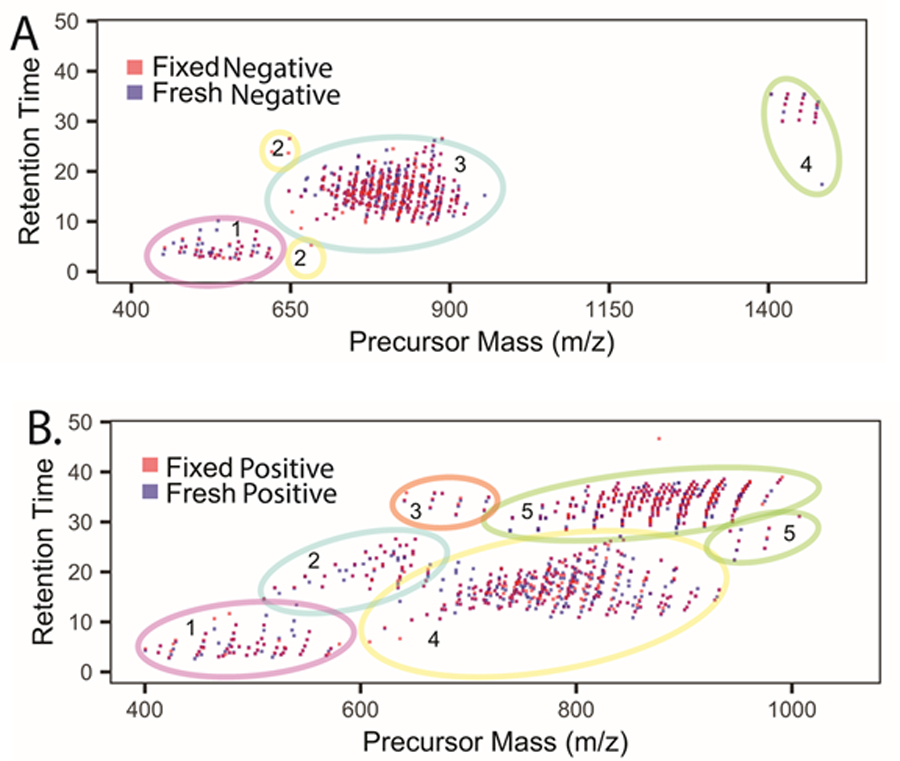
Summary of LC-MS/MS data of fresh-frozen (blue boxes) vs fixed (red boxes) human donor retinas. (A) m/z versus retention time summary of negative ion mode data where lipid classes were segregated (colored circles 1–4) based on their elution profiles. 1; lysoPC, lysoPE, lysoPG, lysoPI, lyso PS, 2; Cer, 3; PC,PE,PG,PS,PI,PA,PC-O, PE-O,SM, 4; CL. (B) M/z versus retention time summary of positive ion mode data where lipid classes were segregated (colored circles 1–5) based on their elution profiles. 1; AC, lyso PC, lyso PE, 2; Cer, PG, 3; CE, 4; PC, PE, PC-O, PC-P, PE-O, PE-P, PE-NMe; 5; TG.
Based on retention time vs precursor mass from all the three biological replicates, we observed a total of 340 ± 24.2 (mean ± SD) for fresh-frozen and 309 ± 39.8 (mean ± SD) lipids in number in fixed tissue in negative ionization mode. In positive ionization mode a total of 513 ± 14.8 (mean ± SD) and 378 ± 95.5 (mean ± SD) was observed for fresh-frozen and fixed tissue lipids respectively.
In negative ionization mode lipids were stratified by retention time vs precursor mass into four groups (Figure 3A). In group 1, we observed lipids in the range of m/z 450–620 with retention times of 2–10 minutes and comprised of lyso PC, lyso PE, lyso PG, lyso PI and lyso PS. There were some outliers, i.e., lipids that did not segregate with groups 1 or 3, comprised of 4 distinct ceramides out of which 3 were exclusively present in fixed retina and 1 was common for both fresh-frozen and fixed tissue. These lipids were placed in group 2. Lipids eluting between 10–30 minutes within a m/z range of 650–900 were placed in group 3 and consisted mostly of glycerophospholipids including PC, PE, PG, PS, PI, PA, plasmenyl-PC, plasmenyl-PE and sphingomyelins (SM). Cardiolipins (CL) eluted last from the column, after 30 minutes, with masses above m/z 1400; they formed group 4.
In positive ionization mode (Figure 3B) lipids were sorted into 5 groups based on m/z and retention time. AC, lyso PC, lyso PE eluted first from the column at 2.6–9.4 minutes within a range of m/z 400–600 and were marked as group 1. Within the retention time range from 10–30 minutes eluted lipids in group 2, including Cer[NS] and DG within a mass window of m/z 500–700. Group 3 lipids, between m/z 640–728, included cholesteryl esters (CE) that eluted between 30–40 minutes. Glycerophospholipids including PC, PE, plasmenyl-PC, plasmenyl-PE, plasmanyl-PC, PE-NMe and sphingomyelins have m/z values between 650–950 were combined in group 4 with elution times of 10–30 minutes. Group 5, comprised of triglycerides (TG), eluted from 28.1–38.4 minutes with m/z values between 738–990. Interestingly, a discrete pattern was observed for TG lipids showing an increase in retention time with a proportionate increase in the degree of unsaturation.
3.4. Comparison of lipid composition of fresh-frozen and fixed human retina-choroid in negative and positive ionization modes using LC-ESI-MS/MS
Overall, untargeted lipidomic analysis in positive and negative ionization modes from three biological replicates identified a total of 592 lipids covering 4 lipid classes and 17 lipid subclasses comprised of 568 lipids in fresh-frozen retina (201 fresh-frozen only) and 391 lipids in fixed retina (24 fixed only) representing a 31% loss of unique lipids upon fixation (Figure 4). Overall, there was 22%, 12% and 32% loss of lipids in fixed tissue as compared to fresh-frozen from three biological replicates, respectively. Most lipids discovered in both fresh-frozen and fixed tissues were glycerophospholipids, followed by glycerolipids, sphingolipids and cholesteryl esters. The highest number of detected lipid subclasses were diacylglycerophosphocholines (PC, 124), triacylglycerol (TG, 94), sphingomyelins (SM, 42), and cholesteryl esters (CE, 9). There were 352 glycerophospholipids in fresh-frozen and 250 in fixed tissue representing a 29% decrease, covering lipid subclasses including, PC, PI, PG, PE, PS, plasmalogen lipids and lyso phospholipids. A total of 114 glycerolipids, comprised of TGs and DG, were observed in fresh-frozen and 56 in fixed tissue; a 51% decrease. Sphingolipids were 94 in number for fresh-frozen and 79 for fixed tissue; a 16% decrease, including Cer, CL, SM, AC and HexCer. Upon fixation, lipid signals were preserved for most of the lipid classes. However lower signals were observed for PC, PE, PS, PI, PG, TG, AC and SM upon fixation (Figure 4).
Figure 4:
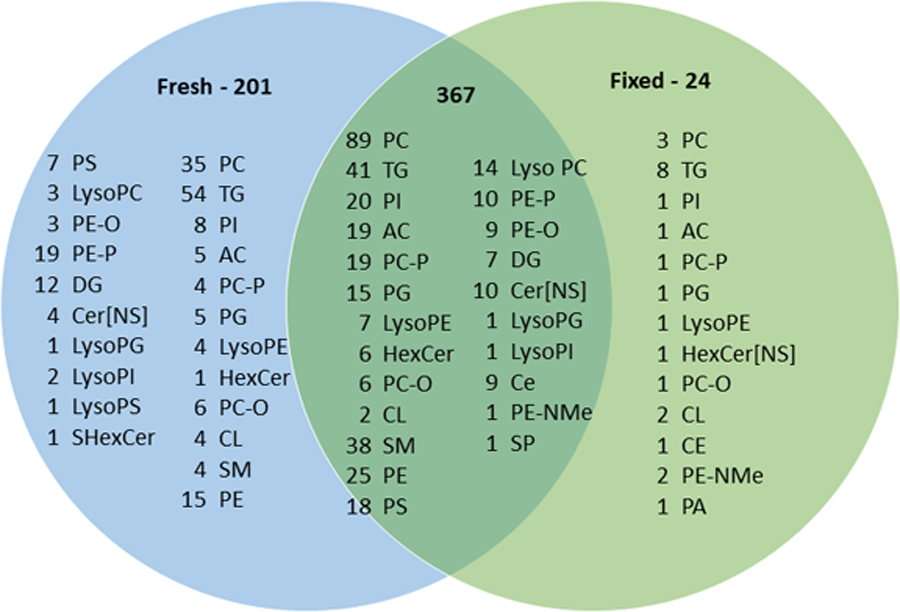
Venn diagram of lipid compositions of fresh-frozen and fixed human retina samples including both negative and positive ionization mode data identified by LC-MS/MS (only MS/MS confirmed lipids shown).
A comparison of overall differences in the lipid composition among three biological replicates of fresh-frozen and fixed tissue in negative ion mode (Figure 5) showed higher numbers of CL, PS, Lyso PLs, PE, PI and SM lipids were detected for fresh-frozen than for fixed samples. Fewer Cer, PA, PC, PG, and plasmenyl PC lipids were detected in fresh-frozen as compared to fixed tissue. In positive ionization mode AC, Cer, DG, lyso PL, PC, PE, PI, plasmenyl PE, SM and TG lipids were detected in higher numbers from fresh-frozen tissue compared to fixed tissue and CE, SHexCer were detected in lower numbers in fresh-frozen compared to fixed tissue (Figure 5).
Figure 5:
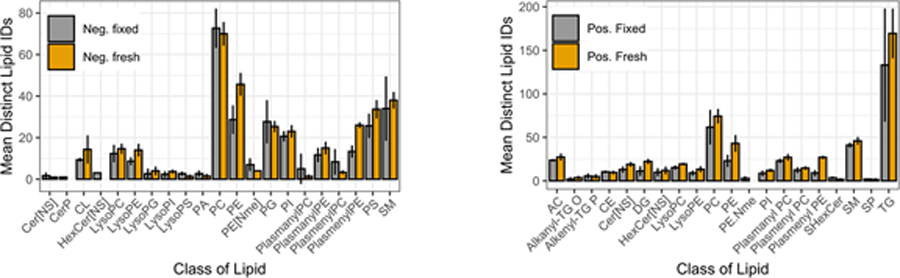
Differences in the lipid composition observed between fresh-frozen (orange) and fixed (gray) retina tissue samples detected by LC-MS/MS analysis in negative (A) and positive (B) ion modes (n=3).
Among glycerophospholipids, formalin reacts readily with the primary amine groups of PE and PS lipids to form a crosslink, thereby reducing the detection of free lipids in fixed tissue, as described.26,27,60 Similarly, we observed a decrease in lipid signals for PE and PS lipids in all three biological replicates of fixed retina (Supplementary Figure 10). Also, monomethylation and dimethylation of the amine head group of PE by the nucleophilic addition of formaldehyde on primary amines leads to increased expression of PE-NMe in fixed samples (Figure 4). PC lipids were most affected by fixation and this can be attributed to lipid peroxidation61 and hydrolysis of PC60, as observed for PE,PS and PG (Figure 4). Fixation caused a decrease in lipid signals for PG lipids in our study. This contrasts with one study that showed no effect on PG lipids, 27 but supports two other studies.26,60 The slight increase in free fatty acid PA in the biological replicates of fixed retina could be attributed to hydrolysis of the ester bond linking the fatty acyl chain. PI lipids showed decreased signals due to fixation which is consistent with other reports27. The reduction in PI levels may be due to either minor degradation of endogenous lipids during the fixation process and/or partial reaction of the hydroxyl groups of PI with formalin27. Plasmalogen lipids originating from PC, PE, PI and PS had decrease signals in fixed tissue which is attributed to degradation of vinyl ether linkage at the sn-1 position of these species.
Glycerolipids, including TG and DG were also decreased due to fixation as shown in Figure 4. Comparing fresh-frozen and fixed tissue from biological triplicates, a large increase in number of lipids for TG and DG in fresh-frozen tissue was observed in one sample (Supplementary Figure 11), while the other two samples showed a slight decrease. A previous study using tissue of one representative human brain showed a decrease in DG lipids in fixed tissue that was attributed to chemical hydrolysis of phosphodiesterase bonds60.
Sphingolipid signals were mostly preserved after fixation (Figure 4). A comparison of three biological replicates indicated there were fewer CL observed in fixed tissue (Supplementary Figure 11). Among sterols, cholesteryl esters (CE) are very stable and unlikely to be affected by fixation. CE signals were conserved throughout the samples of fresh-frozen and fixed retina in all the three biological replicates. Previous studies found that longer chain CE lipids became less detectable in fixed tissue.62,63
Further, we compared the IMS observed molecular ions shown in Figure 2 to their intensities observed in LC-MS/MS data (Supplementary Table 1). In negative ion mode, four of the six signals shown in Figure 2 show similar trends in LC-MS/MS as seen in MALDI-IMS data. In positive ion mode, two signals show the same trend in LC-MS/MS data as seen in Figure 2 while three signals show no difference between fixed and fresh-frozen data. It is important to note that the LC-MS/MS data are based exclusively on protonated ion signals while the MALDI-IMS data can show different signal intensities for protonated, sodiated, and potassiated ions. We also determined the fold changes in the signal intensity of lipids observed in LC-MS/MS data from both fresh-frozen and fixed retina samples (Supplementary Table 2). We observed a trend towards increased signals for all the selected lipids in fresh-frozen compared to fixed tissue except for six lipid subclasses including PA, HexCer, CE, PC, PC-O and LPC.
CONCLUSIONS
Fixation to preserve tissue morphology for MALDI-IMS analysis, in conjunction with LC-MS/MS to identify molecular species observed with MALDI-IMS, together can elucidate lipid localization in healthy and diseased retina. Extensive untargeted lipidomics analysis using the analytical discovery tools of LC-MS/MS and MALDI-IMS revealed that molecular signatures for most lipid classes in human retina tissue were preserved after fixation. However, fixation causes lipid crosslinks, oxidation, hydrolysis, and head group modifications for certain lipids. There was a 31% overall decrease in lipid signals for fixed tissue based on LC-MS/MS analysis. Fixation, compared to fresh-frozen tissue results, caused decreased lipid signals for most of glycerophospholipids and glycerolipids, and increased lipid signals for PG, PE-NMe and plasmalogen PC lipids. Most sphingolipids and cholesteryl esters were unaltered as detected by LC-MS/MS. Based on MALDI-IMS, fixation caused an increase in the numbers of lipids observed for most of the lipid classes in negative ionization mode while an increase in number of observed lipids was seen for PG/BMP and PS classes in positive ionization mode. The morphology of the retina was distorted in fresh-frozen tissue sections and this suggests caution should be used for this sample type. Formation of abundant potassium adducts in fresh-frozen tissue and displacement of these adducts in fixed tissue increased the number of signals detected in fresh-frozen tissue but did not increase the number of unique lipids identified. Overall, our results suggest that fixed tissue, typically used to maintain tissue morphology, conserves lipid classes as seen in fresh-frozen tissue and can be used to investigate retina lipids in various retinal disease settings.
Supplementary Material
Supplementary Figure 1 and 2: MALDI-IMS analysis of 90-year-old human donor eye from fresh-frozen sample vs paraformaldehyde-fixed in peripheral sections from the same donor. Panels A-D display multiple lipid signals in both polarities in fixed and fresh-frozen tissue overlaid with an optical image of the tissues imaged. Varying signal intensities from the selected species can be seen for both fresh-frozen and fixed tissue in both polarities, Supplementary Figure 1 for negative ion and Supplementary Figure 2 for positive ion.
Supplementary Figure 3: Positive ion mode MALDI-IMS of fresh-frozen vs fixed tissue displaying A PC(32:0), B PC(34:1) and C PC(34:2) from Figure 2D displaying the protonated, sodiated and potassiated ions which show the same localization but varying intensities.
Supplementary Figure 4: Positive ion mode MALDI-IMS of fresh-frozen vs fixed tissue displaying A TG(52:2) and B TG(52:3) displaying the protonated, sodiated and potassiated ions in fixed and fresh-frozen tissue overlaid with an optical image of the tissues imaged and MALDI IMS alone. These lipids show a high degree of localization in the choroid region with varying intensities.
Supplementary Figure 5: Global averaged mass spectra from negative and positive ion mode analysis of fixed and fresh tissues exported from imaging data. Panel 1A displays the negative ion mode mass spectrum from fixed tissue. Panel 1B displays the negative ion mode mass spectrum from fresh tissue. Panel 2A shows the positive ion mode mass spectrum from fixed tissue. Panel 2B shows the positive ion mode mass spectrum from fresh tissue.
Supplementary Figure 6: Replicate imaging mass spectrometry (IMS) data analysis of 84 year old human donor eye from fresh-frozen sample vs paraformaldehyde-fixed in peripheral sections from the same donor. Panels 1A (top, fixed) and B (bottom, fresh-frozen) display zoomed PASH stained tissue from an adjacent section indicating cell layers, NFL nerve fiber layer, GCL ganglion cell layer, IPL inner plexiform layer, INL inner nuclear layer, HFL Henle fiber layer, ONL outer nuclear layer, IS+OS inner segment + outer segment, RPE-BrM retinal pigment epithelium-Bruch’s membrane, Ch choroid. Panels 2A-D display multiple lipid signals in both polarities in fixed and fresh-frozen tissue. Panel A and B display negative ion mode analysis were three signals which were observed to have higher signal intensity in in fixed tissue (A) and fresh-frozen tissue (B). Panel C and D display negative ion mode analysis were three signals which were observed to have higher signal intensity in in fixed tissue (C) and fresh-frozen tissue (D). The poor morphology of the fresh-frozen tissue if reflected in the image quality in this example.
Supplementary Figure 7: Panel A and B show the differences in lipid composition from fixed (gray bars) and fresh-frozen (yellow bars) tissues analyzed using MALDI-IMS displaying multiple lipid classes observed in negative (Panel A) and positive (Panel B) ion mode analysis.
Supplementary Figure 8 A: Molecular ion spectra and fragmentation pattern in negative ionization mode of fixed tissue using LC-ESI-MS/MS. Calculated monoisotopic mass A1. 701.5121; PA (18:1_18:0); ppm error: 1.0, A2. 772.5281; PE(O-18:1_22:6); ppm error: 0.6 and A3. 1473.981; CL (18:2_20:3_18:2_18:2); ppm error: 1.3. B: Molecular ion spectra and fragmentation pattern in negative ionization mode of fresh-frozen tissue using LC-ESI-MS/MS. Calculated monoisotopic mass B1. 700.5281; (a) PE(O-16:0_18:2) and (b) PE(P-18:1_16:0) ; ppm error: 0.1, B2. 722.5125; (a) PE(O-16:0_20:5) and (b) PE(P-16:0_20:4); ppm error: 0.8, B3. 750.5443; (a) PE(O-16:0_22:5) and (b) PE(P-18:0_20:4); ppm error: 0.3. C: Molecular ion spectra and fragmentation pattern in positive ionization mode of fixed tissue using LC-ESI-MS/MS. Calculated monoisotopic mass C1. [M+H]+ 786.6013; PC(36:2); ppm error:2.6, C2. [M+H]+ 788.6169; PC(36:1); ppm error:0.6, C3. [M+H]+ 814.6326; PC(38:2); ppm error: 5.6. D; Molecular ion spectra and fragmentation pattern in positive ionization mode of fixed tissue using LC-ESI-MS/MS. Calculated monoisotopic mass D1. [M+H]+ 734.5694; PC(32:0); ppm error: 1.9, D2. [M+H]+ 760.5851; PC(34:1); ppm error: 2.2, D3. [M+H]+ 786.6007; PC(36:2); ppm error: 1.9.
Supplementary Figure 9: LC-MS/MS data of fresh-frozen (blue boxes) vs fixed (red boxes) human donor retina (biological replicate 2). M/z versus retention time summary of (a) negative ion mode data and m/z versus retention time summary of (b) positive ion mode data where lipid classes.
Supplementary Figure 10: LC-MS/MS data of fresh-frozen (blue boxes) vs fixed (red boxes) human donor retina (biological replicate 3). M/z versus retention time summary of (a) negative ion mode data and m/z versus retention time summary of (b) positive ion mode data where lipid classes.
Supplementary Figure 11: Lipid composition identified (MS2 confirmations) in fresh-frozen and fixed human retina from LC-MS/MS using LipiDex.
ACKNOWLEDGEMENTS
The authors acknowledge financial support from NIH grants R01EY027948 (CAC), P41 GM103391, S10 OD023514 (KLS), Heidelberg Engineering, (UAB institutional support), Research to Prevent Blindness (CAC & KLS), and EyeSight Foundation of Alabama.
Financial disclosures:
(CAC) research funding from Heidelberg Engineering, Hoffman La Roche, and Regeneron.
References
- 1.Anderson DMG, Messinger JD, Patterson NH, et al. Lipid Landscape of the Human Retina and Supporting Tissues Revealed by High-Resolution Imaging Mass Spectrometry. J Am Soc Mass Spectrom 2020. [DOI] [PMC free article] [PubMed]
- 2.Caprioli RM, Farmer TB, Gile J. Molecular imaging of biological samples: localization of peptides and proteins using MALDI-TOF MS. Anal Chem 1997;69(23):4751–4760. [DOI] [PubMed] [Google Scholar]
- 3.Berry KA, Hankin JA, Barkley RM, Spraggins JM, Caprioli RM, Murphy RC. MALDI imaging of lipid biochemistry in tissues by mass spectrometry. Chem Rev 2011;111(10):6491–6512. [DOI] [PMC free article] [PubMed] [Google Scholar]
- 4.Anderson DMG, Messinger JD, Patterson NH, et al. Lipid Landscape of the Human Retina and Supporting Tissues Revealed by High Resolution Imaging Mass Spectrometry. bioRxiv 2020:2020.2004.2008.029538. [DOI] [PMC free article] [PubMed]
- 5.Breitkopf SB, Ricoult SJH, Yuan M, et al. A relative quantitative positive/negative ion switching method for untargeted lipidomics via high resolution LC-MS/MS from any biological source. Metabolomics 2017;13(3). [DOI] [PMC free article] [PubMed] [Google Scholar]
- 6.Maganti RJ, Hronowski XL, Dunstan RW, et al. Defining Changes in the Spatial Distribution and Composition of Brain Lipids in the Shiverer and Cuprizone Mouse Models of Myelin Disease. J Histochem Cytochem 2019;67(3):203–219. [DOI] [PMC free article] [PubMed] [Google Scholar]
- 7.Wildburger NC, Wood PL, Gumin J, et al. ESI-MS/MS and MALDI-IMS Localization Reveal Alterations in Phosphatidic Acid, Diacylglycerol, and DHA in Glioma Stem Cell Xenografts. J Proteome Res 2015;14(6):2511–2519. [DOI] [PMC free article] [PubMed] [Google Scholar]
- 8.Pereiro X, Fernández R, Barreda-Gómez G, et al. Comparative lipidomic analysis of mammalian retinal ganglion cells and Müller glia in situ and in vitro using High-Resolution Imaging Mass Spectrometry. Sci Rep 2020;10(1):20053. [DOI] [PMC free article] [PubMed] [Google Scholar]
- 9.Muranishi Y, Sato T, Ito S, et al. The Ratios of monounsaturated to saturated phosphatidylcholines in lung adenocarcinoma microenvironment analyzed by Liquid Chromatography-Mass spectrometry and imaging Mass spectrometry. Sci Rep 2019;9(1):8916. [DOI] [PMC free article] [PubMed] [Google Scholar]
- 10.Kadesch P, Quack T, Gerbig S, Grevelding CG, Spengler B. Tissue- and sex-specific lipidomic analysis of Schistosoma mansoni using high-resolution atmospheric pressure scanning microprobe matrix-assisted laser desorption/ionization mass spectrometry imaging. PLoS Negl Trop Dis 2020;14(5):e0008145. [DOI] [PMC free article] [PubMed] [Google Scholar]
- 11.Ghaste M, Mistrik R, Shulaev V. Applications of Fourier Transform Ion Cyclotron Resonance (FT-ICR) and Orbitrap Based High Resolution Mass Spectrometry in Metabolomics and Lipidomics. Int J Mol Sci 2016;17(6). [DOI] [PMC free article] [PubMed] [Google Scholar]
- 12.Schrader W, Klein HW. Liquid chromatography/Fourier transform ion cyclotron resonance mass spectrometry (LC-FTICR MS): an early overview. Anal Bioanal Chem 2004;379(7–8):1013–1024. [DOI] [PubMed] [Google Scholar]
- 13.Schwartz SA, Reyzer ML, Caprioli RM. Direct tissue analysis using matrix-assisted laser desorption/ionization mass spectrometry: practical aspects of sample preparation. J Mass Spectrom 2003;38(7):699–708. [DOI] [PubMed] [Google Scholar]
- 14.Rujoi M, Estrada R, Yappert MC. In situ MALDI-TOF MS regional analysis of neutral phospholipids in lens tissue. Anal Chem 2004;76(6):1657–1663. [DOI] [PubMed] [Google Scholar]
- 15.Woods AS, Jackson SN. Brain tissue lipidomics: direct probing using matrix-assisted laser desorption/ionization mass spectrometry. Aaps j 2006;8(2):E391–395. [DOI] [PMC free article] [PubMed] [Google Scholar]
- 16.Jackson SN, Woods AS. Direct profiling of tissue lipids by MALDI-TOFMS. J Chromatogr B Analyt Technol Biomed Life Sci 2009;877(26):2822–2829. [DOI] [PMC free article] [PubMed] [Google Scholar]
- 17.Mohammadi AS, Phan NT, Fletcher JS, Ewing AG. Intact lipid imaging of mouse brain samples: MALDI, nanoparticle-laser desorption ionization, and 40 keV argon cluster secondary ion mass spectrometry. Anal Bioanal Chem 2016;408(24):6857–6868. [DOI] [PMC free article] [PubMed] [Google Scholar]
- 18.Bowman AP, Bogie JFJ, Hendriks JJA, et al. Evaluation of lipid coverage and high spatial resolution MALDI-imaging capabilities of oversampling combined with laser post-ionisation. Anal Bioanal Chem 2020;412(10):2277–2289. [DOI] [PMC free article] [PubMed] [Google Scholar]
- 19.Mikawa S, Suzuki M, Fujimoto C, Sato K. Imaging of phosphatidylcholines in the adult rat brain using MALDI-TOF MS. Neurosci Lett 2009;451(1):45–49. [DOI] [PubMed] [Google Scholar]
- 20.Astigarraga E, Barreda-Gómez G, Lombardero L, et al. Profiling and imaging of lipids on brain and liver tissue by matrix-assisted laser desorption/ ionization mass spectrometry using 2-mercaptobenzothiazole as a matrix. Anal Chem 2008;80(23):9105–9114. [DOI] [PubMed] [Google Scholar]
- 21.Murphy RC, Hankin JA, Barkley RM. Imaging of lipid species by MALDI mass spectrometry. J Lipid Res 2009;50 Suppl(Suppl):S317–322. [DOI] [PMC free article] [PubMed] [Google Scholar]
- 22.Pietrowska M, Gawin M, Polańska J, Widłak P. Tissue fixed with formalin and processed without paraffin embedding is suitable for imaging of both peptides and lipids by MALDI-IMS. Proteomics 2016;16(11–12):1670–1677. [DOI] [PubMed] [Google Scholar]
- 23.Ly A, Schone C, Becker M, et al. High-resolution MALDI mass spectrometric imaging of lipids in the mammalian retina. Histochem Cell Biol 2015;143(5):453–462. [DOI] [PubMed] [Google Scholar]
- 24.Carter CL, McLeod CW, Bunch J. Imaging of phospholipids in formalin fixed rat brain sections by matrix assisted laser desorption/ionization mass spectrometry. J Am Soc Mass Spectrom 2011;22(11):1991–1998. [DOI] [PubMed] [Google Scholar]
- 25.Buck A, Ly A, Balluff B, et al. High-resolution MALDI-FT-ICR MS imaging for the analysis of metabolites from formalin-fixed, paraffin-embedded clinical tissue samples. J Pathol 2015;237(1):123–132. [DOI] [PubMed] [Google Scholar]
- 26.Carter CL, Jones JW, Farese AM, MacVittie TJ, Kane MA. Inflation-Fixation Method for Lipidomic Mapping of Lung Biopsies by Matrix Assisted Laser Desorption/Ionization-Mass Spectrometry Imaging. Anal Chem 2016;88(9):4788–4794. [DOI] [PMC free article] [PubMed] [Google Scholar]
- 27.Vos DRN, Bowman AP, Heeren RMA, Balluff B, Ellis SR. Class-specific depletion of lipid ion signals in tissues upon formalin fixation. International Journal of Mass Spectrometry 2019;446:116212. [Google Scholar]
- 28.Huber K, Kunzke T, Buck A, et al. Multimodal analysis of formalin-fixed and paraffin-embedded tissue by MALDI imaging and fluorescence in situ hybridization for combined genetic and metabolic analysis. Lab Invest 2019;99(10):1535–1546. [DOI] [PubMed] [Google Scholar]
- 29.Fox CH, Johnson FB, Whiting J, Roller PP. Formaldehyde fixation. J Histochem Cytochem 1985;33(8):845–853. [DOI] [PubMed] [Google Scholar]
- 30.Kiernan JA. Formaldehyde, Formalin, Paraformaldehyde And Glutaraldehyde: What They Are And What They Do. Microscopy Today 2000;8(1):8–13. [Google Scholar]
- 31.Thavarajah R, Mudimbaimannar VK, Elizabeth J, Rao UK, Ranganathan K. Chemical and physical basics of routine formaldehyde fixation. J Oral Maxillofac Pathol 2012;16(3):400–405. [DOI] [PMC free article] [PubMed] [Google Scholar]
- 32.Ly A, Buck A, Balluff B, et al. High-mass-resolution MALDI mass spectrometry imaging of metabolites from formalin-fixed paraffin-embedded tissue. Nat Protoc 2016;11(8):1428–1443. [DOI] [PubMed] [Google Scholar]
- 33.Hughes C, Gaunt L, Brown M, Clarke NW, Gardner P. Assessment of paraffin removal from prostate FFPE sections using transmission mode FTIR-FPA imaging. Analytical Methods 2014;6(4):1028–1035. [Google Scholar]
- 34.Wojakowska A, Marczak Ł, Jelonek K, Polanski K, Widlak P, Pietrowska M. An Optimized Method of Metabolite Extraction from Formalin-Fixed Paraffin-Embedded Tissue for GC/MS Analysis. PLoS One 2015;10(9):e0136902. [DOI] [PMC free article] [PubMed] [Google Scholar]
- 35.Acar N, Berdeaux O, Grégoire S, et al. Lipid composition of the human eye: are red blood cells a good mirror of retinal and optic nerve fatty acids? PLoS One 2012;7(4):e35102. [DOI] [PMC free article] [PubMed] [Google Scholar]
- 36.Rice DS, Calandria JM, Gordon WC, et al. Adiponectin receptor 1 conserves docosahexaenoic acid and promotes photoreceptor cell survival. Nat Commun 2015;6:6228. [DOI] [PMC free article] [PubMed] [Google Scholar]
- 37.London A, Benhar I, Schwartz M. The retina as a window to the brain-from eye research to CNS disorders. Nat Rev Neurol 2013;9(1):44–53. [DOI] [PubMed] [Google Scholar]
- 38.Liu A, Chang J, Lin Y, Shen Z, Bernstein PS. Long-chain and very long-chain polyunsaturated fatty acids in ocular aging and age-related macular degeneration. J Lipid Res 2010;51(11):3217–3229. [DOI] [PMC free article] [PubMed] [Google Scholar]
- 39.Skowronska-Krawczyk D, Chao DL. Long-Chain Polyunsaturated Fatty Acids and Age-Related Macular Degeneration. Adv Exp Med Biol 2019;1185:39–43. [DOI] [PMC free article] [PubMed] [Google Scholar]
- 40.Curcio CA. Soft Drusen in Age-Related Macular Degeneration: Biology and Targeting Via the Oil Spill Strategies. Invest Ophthalmol Vis Sci 2018;59(4):Amd160-amd181. [DOI] [PMC free article] [PubMed] [Google Scholar]
- 41.Curcio CA. Antecedents of Soft Drusen, the Specific Deposits of Age-Related Macular Degeneration, in the Biology of Human Macula. Invest Ophthalmol Vis Sci 2018;59(4):Amd182-amd194. [DOI] [PMC free article] [PubMed] [Google Scholar]
- 42.Masland RH. The neuronal organization of the retina. Neuron 2012;76(2):266–280. [DOI] [PMC free article] [PubMed] [Google Scholar]
- 43.Zemski Berry KA, Gordon WC, Murphy RC, Bazan NG. Spatial organization of lipids in the human retina and optic nerve by MALDI imaging mass spectrometry. J Lipid Res 2014;55(3):504–515. [DOI] [PMC free article] [PubMed] [Google Scholar]
- 44.Cacciatore S, Zadra G, Bango C, et al. Metabolic Profiling in Formalin-Fixed and Paraffin-Embedded Prostate Cancer Tissues. Mol Cancer Res 2017;15(4):439–447. [DOI] [PMC free article] [PubMed] [Google Scholar]
- 45.Patel E Fresh Frozen Versus Formalin-Fixed Paraffin Embedded for Mass Spectrometry Imaging. Methods Mol Biol 2017;1618:7–14. [DOI] [PubMed] [Google Scholar]
- 46.Hermann J, Noels H, Theelen W, et al. Sample preparation of formalin-fixed paraffin-embedded tissue sections for MALDI-mass spectrometry imaging. Anal Bioanal Chem 2020;412(6):1263–1275. [DOI] [PMC free article] [PubMed] [Google Scholar]
- 47.Neef SK, Winter S, Hofmann U, et al. Optimized protocol for metabolomic and lipidomic profiling in formalin-fixed paraffin-embedded kidney tissue by LC-MS. Anal Chim Acta 2020;1134:125–135. [DOI] [PubMed] [Google Scholar]
- 48.Feng D, Yuan J, Liu Q, et al. UPLC‑MS/MS‑based metabolomic characterization and comparison of pancreatic adenocarcinoma tissues using formalin‑fixed, paraffin‑embedded and optimal cutting temperature‑embedded materials. Int J Oncol 2019;55(6):1249–1260. [DOI] [PMC free article] [PubMed] [Google Scholar]
- 49.Arima K, Lau MC, Zhao M, et al. Metabolic Profiling of Formalin-Fixed Paraffin-Embedded Tissues Discriminates Normal Colon from Colorectal Cancer. Mol Cancer Res 2020;18(6):883–890. [DOI] [PMC free article] [PubMed] [Google Scholar]
- 50.Kelly AD, Breitkopf SB, Yuan M, Goldsmith J, Spentzos D, Asara JM. Metabolomic profiling from formalin-fixed, paraffin-embedded tumor tissue using targeted LC/MS/MS: application in sarcoma. PLoS One 2011;6(10):e25357. [DOI] [PMC free article] [PubMed] [Google Scholar]
- 51.Anderson DMG, Lambert W, Calkins DJ, et al. Imaging MS of Rodent Ocular Tissues and the Optic Nerve. In: Cole LM, ed. Imaging Mass Spectrometry : Methods and Protocols New York, NY: Springer New York; 2017:15–27. [DOI] [PubMed] [Google Scholar]
- 52.Bemis KD, Harry A, Eberlin LS, et al. Cardinal: an R package for statistical analysis of mass spectrometry-based imaging experiments. Bioinformatics 2015;31(14):2418–2420. [DOI] [PMC free article] [PubMed] [Google Scholar]
- 53.Niedermeyer THJ, Strohalm M. mMass as a Software Tool for the Annotation of Cyclic Peptide Tandem Mass Spectra. PLoS One 2012;7(9):e44913. [DOI] [PMC free article] [PubMed] [Google Scholar]
- 54.Bemis KD, Harry A, Eberlin LS, et al. Probabilistic Segmentation of Mass Spectrometry (MS) Images Helps Select Important Ions and Characterize Confidence in the Resulting Segments. Mol Cell Proteomics 2016;15(5):1761–1772. [DOI] [PMC free article] [PubMed] [Google Scholar]
- 55.Pellegrino RM, Di Veroli A, Valeri A, Goracci L, Cruciani G. LC/MS lipid profiling from human serum: a new method for global lipid extraction. Anal Bioanal Chem 2014;406(30):7937–7948. [DOI] [PubMed] [Google Scholar]
- 56.Hutchins PD, Russell JD, Coon JJ. LipiDex: An Integrated Software Package for High-Confidence Lipid Identification. Cell Syst 2018;6(5):621–625.e625. [DOI] [PMC free article] [PubMed] [Google Scholar]
- 57.Koelmel JP, Kroeger NM, Ulmer CZ, et al. LipidMatch: an automated workflow for rule-based lipid identification using untargeted high-resolution tandem mass spectrometry data. BMC Bioinformatics 2017;18(1):331. [DOI] [PMC free article] [PubMed] [Google Scholar]
- 58.Fabbri R, Macciocca M, Vicenti R, et al. Long-term storage does not impact the quality of cryopreserved human ovarian tissue. Journal of Ovarian Research 2016;9(1):50. [DOI] [PMC free article] [PubMed] [Google Scholar]
- 59.Guerrero RB, Batts KP, Brandhagen DJ, Germer JJ, Perez RG, Persing DH. Effects of formalin fixation and prolonged block storage on detection of hepatitis C virus RNA in liver tissue. Diagn Mol Pathol 1997;6(5):277–281. [DOI] [PubMed] [Google Scholar]
- 60.Gaudin M, Panchal M, Ayciriex S, et al. Ultra performance liquid chromatography - mass spectrometry studies of formalin-induced alterations of human brain lipidome. J Mass Spectrom 2014;49(10):1035–1042. [DOI] [PubMed] [Google Scholar]
- 61.Hackett MJ, McQuillan JA, El-Assaad F, et al. Chemical alterations to murine brain tissue induced by formalin fixation: implications for biospectroscopic imaging and mapping studies of disease pathogenesis. Analyst 2011;136(14):2941–2952. [DOI] [PubMed] [Google Scholar]
- 62.Li CM, Chung BH, Presley JB, et al. Lipoprotein-like particles and cholesteryl esters in human Bruch’s membrane: initial characterization. Invest Ophthalmol Vis Sci 2005;46(7):2576–2586. [DOI] [PubMed] [Google Scholar]
- 63.Haimovici R, Gantz DL, Rumelt S, Freddo TF, Small DM. The lipid composition of drusen, Bruch’s membrane, and sclera by hot stage polarizing light microscopy. Invest Ophthalmol Vis Sci 2001;42(7):1592–1599. [PubMed] [Google Scholar]
Associated Data
This section collects any data citations, data availability statements, or supplementary materials included in this article.
Supplementary Materials
Supplementary Figure 1 and 2: MALDI-IMS analysis of 90-year-old human donor eye from fresh-frozen sample vs paraformaldehyde-fixed in peripheral sections from the same donor. Panels A-D display multiple lipid signals in both polarities in fixed and fresh-frozen tissue overlaid with an optical image of the tissues imaged. Varying signal intensities from the selected species can be seen for both fresh-frozen and fixed tissue in both polarities, Supplementary Figure 1 for negative ion and Supplementary Figure 2 for positive ion.
Supplementary Figure 3: Positive ion mode MALDI-IMS of fresh-frozen vs fixed tissue displaying A PC(32:0), B PC(34:1) and C PC(34:2) from Figure 2D displaying the protonated, sodiated and potassiated ions which show the same localization but varying intensities.
Supplementary Figure 4: Positive ion mode MALDI-IMS of fresh-frozen vs fixed tissue displaying A TG(52:2) and B TG(52:3) displaying the protonated, sodiated and potassiated ions in fixed and fresh-frozen tissue overlaid with an optical image of the tissues imaged and MALDI IMS alone. These lipids show a high degree of localization in the choroid region with varying intensities.
Supplementary Figure 5: Global averaged mass spectra from negative and positive ion mode analysis of fixed and fresh tissues exported from imaging data. Panel 1A displays the negative ion mode mass spectrum from fixed tissue. Panel 1B displays the negative ion mode mass spectrum from fresh tissue. Panel 2A shows the positive ion mode mass spectrum from fixed tissue. Panel 2B shows the positive ion mode mass spectrum from fresh tissue.
Supplementary Figure 6: Replicate imaging mass spectrometry (IMS) data analysis of 84 year old human donor eye from fresh-frozen sample vs paraformaldehyde-fixed in peripheral sections from the same donor. Panels 1A (top, fixed) and B (bottom, fresh-frozen) display zoomed PASH stained tissue from an adjacent section indicating cell layers, NFL nerve fiber layer, GCL ganglion cell layer, IPL inner plexiform layer, INL inner nuclear layer, HFL Henle fiber layer, ONL outer nuclear layer, IS+OS inner segment + outer segment, RPE-BrM retinal pigment epithelium-Bruch’s membrane, Ch choroid. Panels 2A-D display multiple lipid signals in both polarities in fixed and fresh-frozen tissue. Panel A and B display negative ion mode analysis were three signals which were observed to have higher signal intensity in in fixed tissue (A) and fresh-frozen tissue (B). Panel C and D display negative ion mode analysis were three signals which were observed to have higher signal intensity in in fixed tissue (C) and fresh-frozen tissue (D). The poor morphology of the fresh-frozen tissue if reflected in the image quality in this example.
Supplementary Figure 7: Panel A and B show the differences in lipid composition from fixed (gray bars) and fresh-frozen (yellow bars) tissues analyzed using MALDI-IMS displaying multiple lipid classes observed in negative (Panel A) and positive (Panel B) ion mode analysis.
Supplementary Figure 8 A: Molecular ion spectra and fragmentation pattern in negative ionization mode of fixed tissue using LC-ESI-MS/MS. Calculated monoisotopic mass A1. 701.5121; PA (18:1_18:0); ppm error: 1.0, A2. 772.5281; PE(O-18:1_22:6); ppm error: 0.6 and A3. 1473.981; CL (18:2_20:3_18:2_18:2); ppm error: 1.3. B: Molecular ion spectra and fragmentation pattern in negative ionization mode of fresh-frozen tissue using LC-ESI-MS/MS. Calculated monoisotopic mass B1. 700.5281; (a) PE(O-16:0_18:2) and (b) PE(P-18:1_16:0) ; ppm error: 0.1, B2. 722.5125; (a) PE(O-16:0_20:5) and (b) PE(P-16:0_20:4); ppm error: 0.8, B3. 750.5443; (a) PE(O-16:0_22:5) and (b) PE(P-18:0_20:4); ppm error: 0.3. C: Molecular ion spectra and fragmentation pattern in positive ionization mode of fixed tissue using LC-ESI-MS/MS. Calculated monoisotopic mass C1. [M+H]+ 786.6013; PC(36:2); ppm error:2.6, C2. [M+H]+ 788.6169; PC(36:1); ppm error:0.6, C3. [M+H]+ 814.6326; PC(38:2); ppm error: 5.6. D; Molecular ion spectra and fragmentation pattern in positive ionization mode of fixed tissue using LC-ESI-MS/MS. Calculated monoisotopic mass D1. [M+H]+ 734.5694; PC(32:0); ppm error: 1.9, D2. [M+H]+ 760.5851; PC(34:1); ppm error: 2.2, D3. [M+H]+ 786.6007; PC(36:2); ppm error: 1.9.
Supplementary Figure 9: LC-MS/MS data of fresh-frozen (blue boxes) vs fixed (red boxes) human donor retina (biological replicate 2). M/z versus retention time summary of (a) negative ion mode data and m/z versus retention time summary of (b) positive ion mode data where lipid classes.
Supplementary Figure 10: LC-MS/MS data of fresh-frozen (blue boxes) vs fixed (red boxes) human donor retina (biological replicate 3). M/z versus retention time summary of (a) negative ion mode data and m/z versus retention time summary of (b) positive ion mode data where lipid classes.
Supplementary Figure 11: Lipid composition identified (MS2 confirmations) in fresh-frozen and fixed human retina from LC-MS/MS using LipiDex.