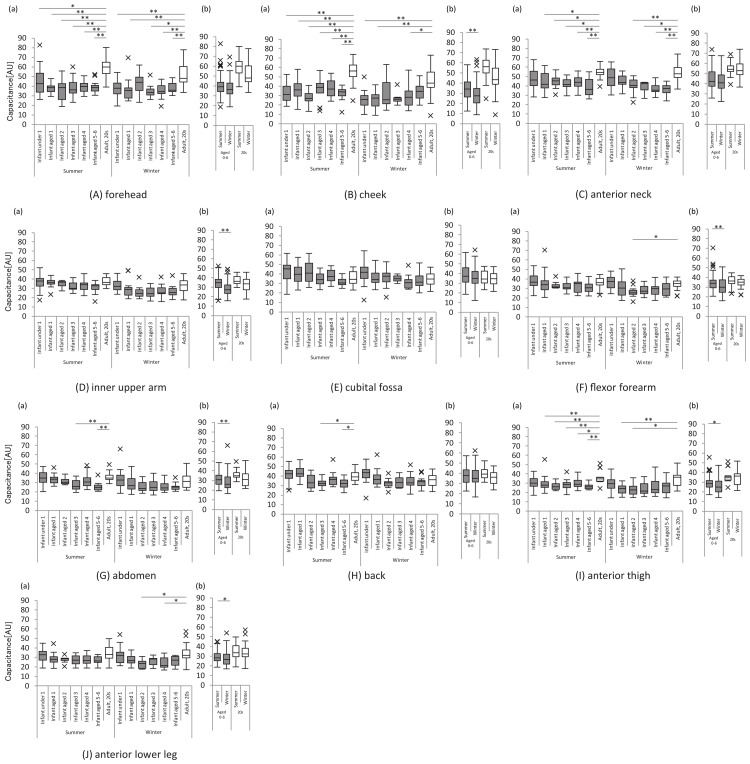
Figure 1. Water content of the stratum corneum.
The graph on the left shows the water content of the stratum corneum at each site for each age group of infants and children and women in their 20s, in summer and winter (a). The graph on the right shows the water content of the stratum corneum in infants and children and women in their 20s in summer and winter, respectively (b). All analyses were performed using a non-parametric method, and significant differences for the respective age groups are indicated as follows: *: p<0.05 and **: p<0.01. X indicates outliers.

