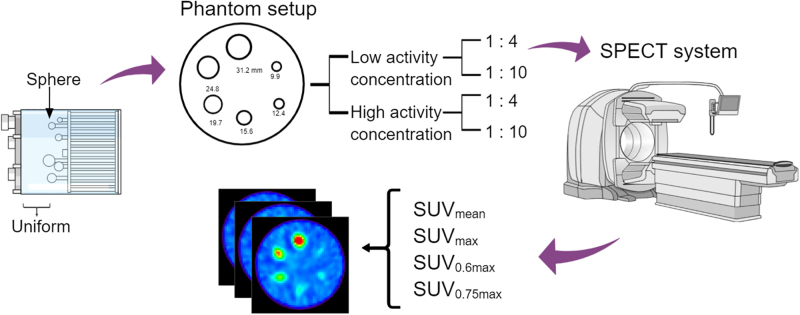
Visual Abstract
Keywords: quantitative, SPECT/CT, SUV, ratio, phantom
Abstract
Advances in iterative image reconstruction enable absolute quantification of SPECT/CT studies by incorporating compensations for collimator–detector response, attenuation, and scatter. This study aimed to assess the quantitative accuracy of SPECT/CT based on different levels of 99mTc activity (low/high) using different SUV metrics (SUVmean, SUVmax, SUV0.6 max, and SUV0.75 max [the average values that include pixels greater than 60% and 75% of the SUVmax in the volume of interest, respectively]). Methods: A Jaszczak phantom equipped with 6 fillable spheres was set up with low and high activity ratios of 1:4 and 1:10 (background-to-sphere) on background activities of 10 and 60 kBq/mL, respectively. The fixed-size volume of interest based on the diameter of each sphere was drawn on SPECT images using various metrics for SUV quantification purposes. Results: The convergence of activity concentration was dependent on the number of iterations and application of postfiltering. For the background-to-sphere ratio of 1:10 with a low background activity concentration, the SUVmean metric showed an underestimation of about 38% from the actual SUV, and SUVmax exhibited an overestimation of about 24% for the largest sphere diameter. Meanwhile, bias reductions of as much as −6% and −7% for SUV0.6 max and SUV0.75 max, respectively, were observed. SUVmax gave a more accurate reading than the others, although points that exceeded the actual value were detected. At 1:4 and 1:10 background activity of 10 kBq/mL, a low activity concentration attained a value close to the actual ratio. Use of 2 iterations and 10 subsets without postfiltering gave the most accurate values for reconstruction and the best image overall. Conclusion: SUVmax is the best metric in a high- or low-contrast-ratio phantom with at least 2 iterations, 10 subsets, and no postfiltering.
The development of multimodality γ-camera instrumentation (SPECT/CT), image reconstruction algorithms, and advanced compensation methods to correct photon attenuation, scattering, and resolution have rendered quantitative SPECT a feasible method that is comparable to the well-established quantitative PET (1).
Filtered backprojection (FBP) and ordered-subset expectation maximization are the 2 most commonly used algorithms in SPECT reconstruction (2). Although the FBP algorithm is simple and fast (3), it unnecessarily amplifies the high-frequency noise, which in turn will affect the quality of the final reconstructed SPECT image (4). Another limitation of FBP is that attenuation cannot be readily integrated and compensated for. Before or after reconstruction, the data should be corrected to compensate for attenuation in the FBP reconstruction, presenting a challenge for scholars (5).
Three-dimensional ordered-subset expectation maximization is a quantitative image reconstruction algorithm used in state-of-the-art SPECT/CT systems (6). Ordered-subset expectation maximization separates the measured datasets into various subsets and uses a single subset for every iteration, thus accelerating the algorithm by a factor equal to the number of subsets (7).
The quantitative accuracy of reconstructed SPECT images deteriorates because of several physical factors, namely photon attenuation, Compton scattering, and a spatially varying collimator response (2). The inclusion of collimator response, that is, resolution recovery, in the GE Healthcare systems (Discovery NM/CT 670 SPECT/CT device; Infinia SPECT/CT) will increase the accuracy of the final reconstructed images (8,9). Attenuation causes inconsistent projection information that may increase or decrease counts in the image, particularly near the detector plane (10). Meanwhile, the presence of scattered photons will result in less contrast and a loss of quantification accuracy in reconstructed images.
Different activity concentrations affect the quantification of SPECT/CT. On the basis of a study by Francis et al. (11), SUV increases with increased activity concentrations for the same size of sphere. Their study proved that radionuclide uptake values correspond to activity concentrations in organs or tissues.
The use of SUV in the quantification of SPECT/CT is gaining interest. SUV is defined as the concentration of radioactivity in the tissue normalized to the injected dose and body weight. SUVmean is defined as the average SUV in the volume of interest (VOI), and SUVmax is defined as the maximum SUV in the VOI. In this study, we also included SUV0.6 max and SUV0.75 max, which are defined as the average values that include pixels greater than 60% and 75%, respectively, of the SUVmax in the VOI. Finally, we compared these 4 SUV metrics to see which gave the most accurate reading.
Factors that potentially affect SUV measurements include spatial resolution and reconstruction parameters. For small objects, image resolution has a partial-volume effect on the measured SUV (12). Usually, SPECT collimators are equipped with a maximum permissible resolution to partially offset the limited detection performance (13). Any changes in reconstruction parameters, such as matrix size, filtering, field-of-view size, and iteration number, will have a significant effect on SUV calculation in clinical cases.
In this study, we aimed to assess the quantitative accuracy when different levels of activity concentration (low/high) with different reconstruction parameters are used for various SUV metrics (SUVmean, SUVmax, SUV0.6 max, and SUV0.75 max).
MATERIALS AND METHODS
Phantom Studies
Quantitative 99mTc-SPECT/CT acquisitions of a Jaszczak phantom containing 6 spheres of various diameters (9.9, 12.4, 15.6, 19.7, 24.8, and 31.2 mm) were performed on a Discovery NM/CT 670 SPECT/CT device (GE Healthcare) equipped with a low-energy, high-resolution collimator. For the first experiment, the background compartment was filled with an activity concentration of about 60 kBq/mL, with sphere-to-background ratios of 10:1 and 4:1. For the second experiment, the background compartment was filled with an activity concentration of about 10 kBq/mL, again with sphere-to-background ratios of 10:1 and 4:1.
Data Acquisition and Reconstruction
SPECT acquisitions were reconstructed using the ordered-subset expectation maximization on a GE Healthcare Xeleris workstation with a 128 × 128 × 128 voxel grid. The acquisition voxel size was 4.42 × 4.42 × 4.42 mm. A CT scan with an energy of 120 kVp and a tube current of 205 mAs was used for attenuation correction. CT-based attenuation correction and dual-energy window scatter correction were systematically applied in SPECT reconstructions. Both experiments were acquired using 20 s per view for a total of 60 views per camera head with no zoom application (×1 multiplication), and images were reconstructed using 2, 10, and 20 iterations with 10 fixed subsets with and without the gaussian filter. SPECT/CT data were reconstructed in an isotropic voxel size of 128 × 128 × 128 with a dimension of 4.42 × 4.42 mm and a slice thickness of 4.42 mm. All images were reconstructed using the ordered-subset expectation maximization algorithm with attenuation correction, scatter correction, and resolution recovery. We utilized the gaussian postprocessing filter using a 4-mm full width at half maximum.
Image Analysis
The reconstructed data were processed using A Medical Image Data Examiner (AMIDE, version 1.0.4) freeware tool (14). The VOI was drawn for 6 spheres based on the CT images and then fused onto the SPECT images. This tool was used to obtain the total number of counts in the VOI on the SPECT images. The SUV was calculated from the activity concentration (kBq/mL) divided by the total administered activity (kBq) within the phantom background chamber and normalized to the weight (g) of the solution in the phantom. SUVmean, SUVmax, SUV0.6 max, and SUV0.75 max metrics were used for each sphere in different phantom contrast ratios and activity concentrations, similar to the study conducted by Lee et al. (15). Calculation of SUV0.6 max and SUV0.75 max was based on an assumption about the average values of all regional voxels, with values being within 60% and 75%, respectively, of the maximal voxel value. The statistical variance or noise was determined using the coefficient of variation. For each measurement, the coefficient of variation for each sphere was calculated by dividing the SD by the mean reading for each sphere.
Statistical Analysis
Statistical analysis was performed using SPSS (version 24; IBM Corp.) software. An independent-sample t test was used to verify whether significant differences existed between high and low background activity concentrations and between 1:4 and 1:10 ratios. Meanwhile, a sample t test was used to compare the SUVs with the reference values for different factors, such as the different activity concentrations, ratios, SUV metrics, and reconstructions. In this study, multiple metric SUVs were tested to find the value nearest the reference value, and the results were proven through 1-way ANOVA.
RESULTS
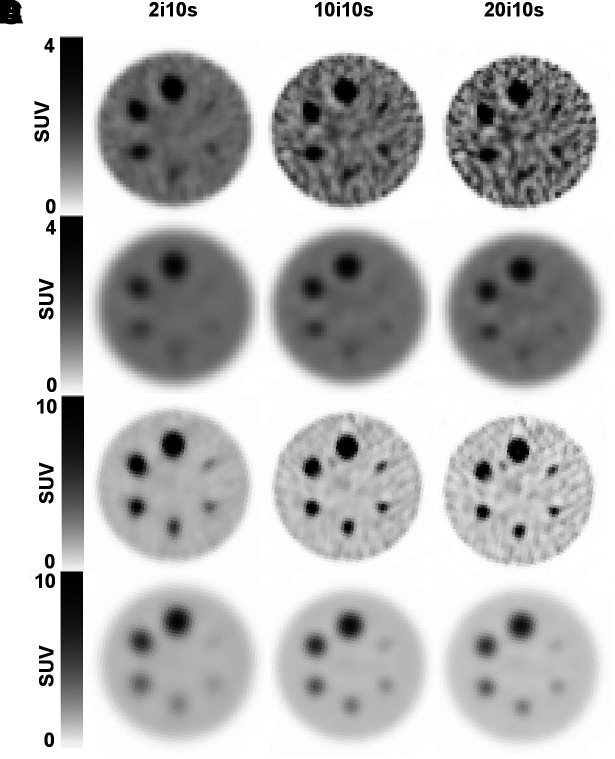
From Figure 1, high iteration numbers increased the contrast along with the noise of an image. The use of a postprocessing filter suppressed the noise but caused an oversmoothing effect (low contrast) on the image (Figs. 1B and 1D). Use of a filter reduced the contrast between the sphere and background, resulting in less qualitative enhancement of the images. However, the smoothing effect caused by the filter introduced additional blurring to the image and hence eliminated details of the structure within the image.
FIGURE 1.
SUV images from phantom study without (A and C) and with (B and D) 4-mm gaussian postprocessing filter. Reconstructed images were achieved using 3-dimensional ordered-subset expectation maximization with 2, 10, and 20 iterations and 10 subsets (2i10s, 10i10s, and 20i10s, respectively) and with background-to-sphere ratios of 1:4 and 1:10 with high activity concentration.
Descriptive Analysis
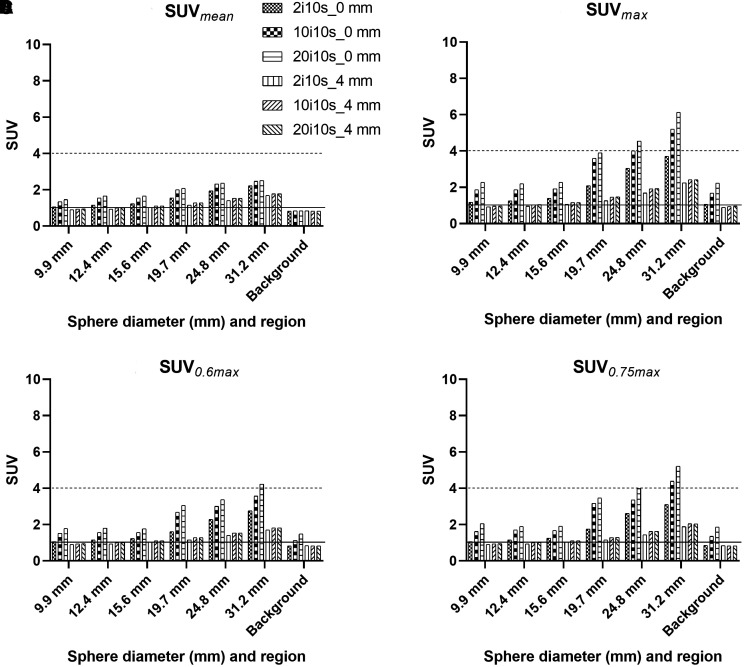
All SUV metrics (SUVmean, SUVmax, SUV0.6 max, and SUV0.75 max) for the different activity concentrations and ratios were plotted on a graph against the function of sphere size and background. On the basis of the plotted graph, the SUV at a low activity concentration (10 kBq/mL) was overestimated compared with the actual value. Meanwhile, a high activity concentration (60 kBq/mL) underestimated the SUV for the sphere-to-background ratios of 1:4 and 1:10 (Fig. 2, Supplemental Figs. 1–3; supplemental materials are available at http://jnmt.snmjournals.org). A sphere-to-background ratio of 1:4 showed a higher accuracy at a low activity concentration (Supplemental Fig. 1) than at a high activity concentration (Fig. 2).
FIGURE 2.
Sphere-to-background ratio of 1:4 with high activity concentration. Dotted lines show true SUV for respective spheres and background.
The various diameters of spheres inside the Jaszczak phantom (9.9, 12.4, 15.6, 19.7, 24.8, and 31.2 mm) were analyzed across the activity concentrations and sphere-to-background ratios of 1:4 and 1:10. The results showed that at the sphere-to-background ratio of 1:4 with a high activity concentration, SUVmean, SUVmax, SUV0.6 max, and SUV0.75 max increased with the increase in sphere diameter (Fig. 2).
When we focused on the largest sphere, SUVmean decreased by about 38% from the actual SUV at a low activity concentration, whereas SUVmax increased by about 24%. Given that SUV0.6 max and SUV0.75 max showed no major variations, reduction biases of about −6% and −7% were observed, respectively.
In this experimental work, a fixed subset of 10 was used for the reconstruction parameter, whereas the increase in iterations from 2 to 10 and 20 indicated an overestimation of SUV when the filter was not utilized. Compared with not using filters, using filters underestimated SUVs regardless of differences in iteration number, SUV threshold, sphere diameter, activity concentration, and sphere-to-background ratio. Such a result was due to the filter function of simultaneously removing noise while reducing the counts in the final reconstructed images.
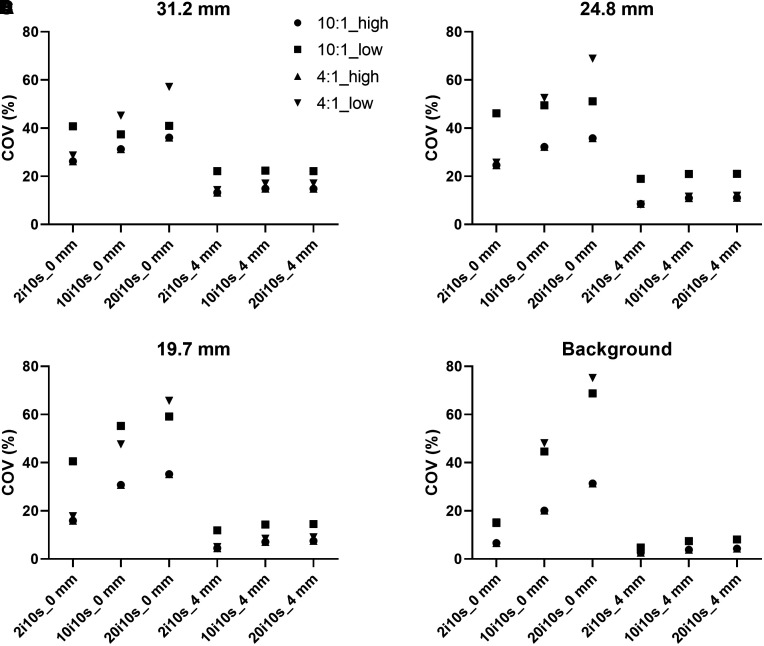
A coefficient of variation was used to demonstrate noise level and can be calculated by dividing the SD by the average activity concentration and multiplying by 100. Figure 3 shows the noise for various reconstructions for the 3 largest spheres in the phantom. The higher the iteration number, the higher the coefficient of variation (Fig. 3; Supplemental Fig. 4). However, when using filters, the coefficient of variation values were the same for all 3 iterations used.
FIGURE 3.
Noise (percentage coefficient of variation [COV]) for various reconstructions for 3 largest spheres and background. i = iterations; s = subsets.
Statistical Analysis
All data were analyzed using SPSS software. The P values for different SUV metrics at sphere-to-background ratios of 1:4 and 1:10 with different activity concentrations showed a significant difference. Theoretically, the true mean value at the 1:4 sphere-to-background ratio is 4 for all spheres inside the phantom, whereas the true mean value at the 1:10 ratio is 10. The SUVmax at a low activity concentration was the nearest to the theoretic value for both ratios.
One-way ANOVA was conducted to determine whether SUVs differed for groups with various SUV metrics. SUV was classified into 4 groups: SUVmean, SUVmax, SUV0.6 max, and SUV0.75 max. There were statistically significant differences between different SUV metrics—differences for which the P value was less than 0.001. Dunnett T3 post hoc analysis revealed that SUVmean was statistically significant (P < 0.05) when compared with the other 3 groups, but no other group differences were statistically significant between SUVmax, SUV0.6 max, and SUV0.75 max.
The varying spheric sizes inside the phantom represent lesion in the patient’s body. Significant differences were observed for all sphere sizes, with true mean values of 4 and 10, except for the 24.8-mm sphere at a low activity concentration and at a sphere-to-background ratio of 1:4 (P = 0.104).
The effects of different reconstruction iterations on the true mean value of the phantom showed a significant difference from the true mean (4 and 10) under different reconstruction methods, except for 2 iterations and 10 subsets without postfiltering at a low activity concentration for sphere-to-background ratios of 1:4 (P = 0.595) and 1:10 (P = 0.268).
DISCUSSION
Two different background activity concentrations (60 and 10 kBq/mL) were used in this study. These backgrounds were intended to compare the 2 concentrations to obtain an accurate reading relative to the theoretic value. Increasing the activity concentration retained the SUV based on the ratios. However, the results showed that the SUV was closest to the actual value in a low activity concentration. When we observed the phantom images at different concentrations and sphere-to-background ratios, we determined that the spill-in effect appeared at a low activity concentration at a 1:4 sphere-to-background ratio for the smallest sphere diameter (9.9 mm). This effect is known as the partial-volume effect, which is caused by the limited partial resolution of the imaging system (16,17).
In the comparison of the 4 SUV-based graphs in Figure 2 and Supplemental Figures 1–3, SUVmean showed an underestimation from the real SUV, whereas SUVmax exhibited an overestimation. Given that SUV0.6 max and SUV0.75 max showed no considerable difference, SUV0.75 max was closer to the theoretic value.
Supplemental Figure 1 indicates that a low activity concentration with a low sphere-to-background ratio may be disastrous if the SUVmax metric is used. Given the high background value, proper background subtraction is an important measure in quantification. The number of iterations is the primary variable affecting image quality. Although a high number of iterations will generally result in a high spatial resolution, the noise level will also increase. A high number of iterations will also hasten image convergence.
The algorithm cannot fully converge if the iteration number is inadequate, which will eventually result in a blurry image with inadequate contrast. Meanwhile, if the number of iterations is extremely large, then the reconstructed image shows oversharpening, with an elevated level of noise (Fig. 1). The selection of reconstruction parameters, such as iteration number, filtering, attenuation correction, scatter correction, and resolution recovery, is important to produce good-quality images with minimal noise.
In this study, images were reconstructed using 10 subsets with 2, 10, and 20 iterations. Reconstruction using 2 iterations, 10 subsets, and no postfiltering at a low activity concentration for both sphere-to-background ratios was found to be most suitable based on the SUV obtained from this study. This result indicates that the obtained value approached the true theoretic value.
The postprocessing filter reduced noise but also produced a smoothing effect on the final reconstructed images. Filters can have a major effect on the quality of clinical images due to their degree of smoothing. Proper filter selection and appropriate smoothing allow physicians to interpret the results and make an accurate diagnosis (18). Gaussian smoothing produces a low image resolution and thus reduces the accuracy of the SUV.
In this experimental study, when we applied the 4-mm gaussian filter, the accuracy of SUV dramatically decreased, and not a single value under various ratios and spheres reached the true theoretic value. Thus, the filter choice can affect the quantitative value of SPECT/CT images.
Clinical bone SPECT/CT studies usually have high sensitivity but low specificity. This imaging procedure typically reconstructs images using 3 or 5 iterations and 8–10 subsets with postsmoothing using a gaussian or Butterworth filter (19). For quantitative analysis, the filter selected must allow for the best compromise between image quality and noise. Given that SUVmax is most accurate at various ratios and at a low or high activity concentration, it should be considered for use in clinical settings.
In nuclear medicine imaging, quantification offers a great advantage. Although SUV may have initially been a framework for PET imaging, it is now found equally ideal for SPECT imaging. The use of SUV in SPECT imaging offers a wide range of radiopharmaceuticals and applications. In this study, we compared different SUV metrics by creating various factors to determine the accuracy of SUV readings. SUVmax demonstrated the reading that correlated most accurately with the clinical setting commonly used for SUV reporting.
CONCLUSION
The concentration of the activity ratio (high or low activity concentration) plays a role in determining an accurate SUV. On the basis of the analysis, a low activity concentration under both ratios provided a more accurate value than a high activity concentration. SUVmax was the closest to the actual theoretic values. From the aspect of reconstruction, the use of 2 iterations and 10 subsets without postfiltering is optimal for accurate quantification and overall image quality when there is a compromising noise level.
DISCLOSURE
This study was supported by Universiti Sains Malaysia (USM); under short-term grant (304/CIPPT/6315160) and under fundamental research grant scheme (203/CIPPT/6711730). No other potential conflict of interest relevant to this article was reported.
REFERENCES
- 1. Bailey DL, Willowson KP. An evidence-based review of quantitative SPECT imaging and potential clinical applications. J Nucl Med. 2013;54:83–89. [DOI] [PubMed] [Google Scholar]
- 2. Alzimami KS, Sassi SA, Spyrou NM. A comparison between 3D OSEM and FBP image reconstruction algorithms in SPECT. In: Ao S-I, Gelman L, eds. Advances in Electrical Engineering and Computational Science. Springer; Netherlands; 2009:195–206. [Google Scholar]
- 3. Zeng GL. A filtered backprojection algorithm with characteristics of the iterative landweber algorithm. Med Phys. 2012;39:603–607. [DOI] [PMC free article] [PubMed] [Google Scholar]
- 4. Ramírez J, Górriz JM, Gómez-Río M, et al. Effective emission tomography image reconstruction algorithms for SPECT data. In: Computational Science—ICCS 2008. Springer; 2008:741–748. [Google Scholar]
- 5. Meysam T, Marian N. Quantitative evaluation of the effect of attenuation correction in SPECT images with CT-derived attenuation. Paper presented at: Spie Digital Library website. https://www.spiedigitallibrary.org/conference-proceedings-of-spie/10948/2512120/Quantitative-evaluation-of-the-effect-of-attenuation-correction-in-SPECT/10.1117/12.2512120.short?SSO=1. Accessed August 19, 2021. [Google Scholar]
- 6. Katua AM , Ankrah AO , Vorster M , van Gelder A , Sathekge MM. Optimization of ordered subset expectation maximization reconstruction for reducing urinary bladder artifacts in single-photon emission computed tomography imaging. World J Nucl Med. 2011;10:3–8. [DOI] [PMC free article] [PubMed] [Google Scholar]
- 7. Hudson HM, Larkin RS. Accelerated image reconstruction using ordered subsets of projection data. IEEE Trans Med Imaging. 1994;13:601–609. [DOI] [PubMed] [Google Scholar]
- 8. Ismail FS, Mansor S. Impact of resolution recovery in quantitative 99mTc SPECT/CT cardiac phantom studies. J Med Imaging Radiat Sci. 2019;50:449–453. [DOI] [PubMed] [Google Scholar]
- 9. Knoll P, Kotalova D, Köchle G, et al. Comparison of advanced iterative reconstruction methods for SPECT/CT. Z Med Phys. 2012;22:58–69. [DOI] [PubMed] [Google Scholar]
- 10. Frey EC, Humm JL, Ljungberg M. Accuracy and precision of radioactivity quantification in nuclear medicine images. Semin Nucl Med. 2012;42:208–218. [DOI] [PMC free article] [PubMed] [Google Scholar]
- 11. Francis H, Amuasi JH, Kwame KA, Vangu MD. Quantitative assessment of radionuclide uptake and positron emission tomography-computed tomography image contrast. World J Nucl Med. 2016;15:167–172. [DOI] [PMC free article] [PubMed] [Google Scholar]
- 12. Adams MC, Turkington TG, Wilson JM, Wong TZ. A systematic review of the factors affecting accuracy of SUV measurements. AJR. 2010;195:310–320. [DOI] [PubMed] [Google Scholar]
- 13. Ritt P, Vija H, Hornegger J, Kuwert T. Absolute quantification in SPECT. Eur J Nucl Med Mol Imaging. 2011;38(suppl 1):S69–S77. [DOI] [PubMed] [Google Scholar]
- 14. Loening AM, Gambhir SS. AMIDE: a free software tool for multimodality medical image analysis. Mol Imaging. 2003;2:131–137. [DOI] [PubMed] [Google Scholar]
- 15. Lee JR, Madsen MT, Bushnel D, Menda Y. A threshold method to improve standardized uptake value reproducibility. Nucl Med Commun. 2000;21:685–690. [DOI] [PubMed] [Google Scholar]
- 16. Soret M, Bacharach SL, Buvat I. Partial-volume effect in PET tumor imaging. J Nucl Med. 2007;48:932–945. [DOI] [PubMed] [Google Scholar]
- 17. Du Y, Madar I, Stumpf MJ, Rong X, Fung GS, Frey EC. Compensation for spill-in and spill-out partial volume effects in cardiac PET imaging. J Nucl Cardiol. 2013;20:84–98. [DOI] [PubMed] [Google Scholar]
- 18. Lyra M, Ploussi A. Filtering in SPECT image reconstruction. Int J Biomed Imaging. 2011;2011:693795. [DOI] [PMC free article] [PubMed] [Google Scholar]
- 19. Van den Wyngaert T, Strobel K, Kampen WU, et al. The EANM practice guidelines for bone scintigraphy. Eur J Nucl Med Mol Imaging. 2016;43:1723–1738. [DOI] [PMC free article] [PubMed] [Google Scholar]


