

Abstract
Aims
Weight excess and insulin resistance predispose to heart failure. High sodium consumption may contribute to the development of cardiac impairment in insulin‐resistant individuals by promoting inadequate skeletal muscle microvascular perfusion response to insulin. We sought to investigate the association of dietary sodium reduction with muscle perfusion, insulin sensitivity, and cardiac function in overweight/obese insulin‐resistant (O‐IR) normotensive subjects.
Methods and results
Fifty O‐IR individuals with higher than recommended sodium intake were randomized to usual or reduced sodium diet for 8 weeks; 25 lean, healthy subjects served as controls for pre‐intervention measurements. Echocardiography and muscle perfusion were performed during fasting and under stable euglycaemic–hyperinsulinaemic clamp conditions. O‐IR patients demonstrated subclinical cardiac dysfunction as evidenced by lower left ventricular global longitudinal strain (GLS), e′ tissue velocity, and left atrial strain and reduced muscle perfusion. The intervention arm showed improvements in insulin resistance [glucose infusion rate (GIR)], GLS, e′, atrial strain, and muscle perfusion in fasting conditions, as well as improved responses of GLS and muscle perfusion to insulin during clamp. Significant interactions were found between the allocation to low‐salt diet and improvement in muscle perfusion on change in GIR at follow‐up (P = 0.030), and between improvement in muscle perfusion and change in GIR on change in GLS response to insulin at follow‐up (P = 0.026). Mediation analysis revealed that the relationship between the reduction of sodium intake and improvement in GLS was mediated by improvements in muscle perfusion and GIR (decrease in beta coefficient from −0.29 to −0.16 after the inclusion of mediator variables to the model).
Conclusions
The reduction of dietary sodium in the normotensive O‐IR population improves cardiac function, and this effect may be associated with the concomitant improvements in skeletal muscle perfusion and insulin resistance. These findings might contribute to refining heart failure preventive strategies.
Keywords: Sodium consumption, Insulin resistance, Weight excess, Microvascular muscle perfusion, Myocardial function, Heart failure
Introduction
The worldwide obesity epidemic contributes to the increasing disease burden of heart failure, posing substantial medical and economic problems for public healthcare system. The association of asymptomatic left ventricular (LV) dysfunction with metabolic disorders more than doubles the 4 year risk of heart failure. 1 In view of the high morbidity and mortality of overt heart failure, prophylactic measures to limit or retard the progression of metabolic cardiomyopathy are of paramount importance.
Insulin resistance (IR) is a common pathway between weight excess and cardiovascular (CV) disease. 1 The link between obesity, IR, and cardiac functional abnormalities has been thoroughly demonstrated in previous research 12 , 23 ; however, exact mechanisms participating in the pathologic process remain underexplored.
Diet in most countries is abundant in sodium, exceeding the recommended consumption limits for this micronutrient. 30 , 31 Data from experimental and human studies suggest that high sodium intake may contribute to IR due to impaired vascular function in skeletal muscle, independent of myocyte insulin sensitivity and hypertension. 32 , 33 , 34 , 35 Specifically, reduced skeletal muscle microvascular perfusion has been postulated to be a mediator, but evidence linking a sequence high sodium–poor microvascular blood flow (MBF) to altered LV function is lacking. Skeletal muscle microvascular flow, normally increased in response to insulin to enhance glucose disposal, is blunted in IR, which further disturbs metabolic homeostasis and may have potential CV implications. 2 , 3 , 4
As high sodium intake is a well‐known component of the obesogenic environment, 13 it is reasonable to consider it as a target for pre‐emptive measures aimed at improving the metabolic milieu and cardiac performance in patients with excessive body weight to prevent the development of overt heart failure. In view of the difficulties in weight control in a considerable proportion of obese subjects, the dietary salt reduction might be prioritized as an additional measure having an effect on metabolic and CV outcomes, independent of its effect on blood pressure. From a clinical standpoint, evidence is needed for efficacy in this context of moderate changes in daily sodium intake, which are implementable.
Accordingly, we sought to investigate the association of dietary sodium, including the effect of reduction in dietary sodium intake, with skeletal muscle perfusion, insulin sensitivity, and cardiac function in overweight/obese insulin‐resistant normotensive subjects. We hypothesize that abnormal skeletal muscle perfusion associated with high sodium intake contributes to IR and subclinical myocardial dysfunction in individuals with weight excess and that the restriction of sodium intake may improve metabolic and CV derangements.
Methods
Study design
The present study encompassed two stages:
Cross‐sectional analysis comparing overweight/obese insulin‐resistant subjects with lean non‐insulin‐resistant controls with respect to metabolic, skeletal muscle perfusion, and CV profiles in the context of dietary sodium intake; and
Prospective, randomized, parallel‐group trial including overweight/obese insulin‐resistant individuals, testing the hypothesis on the beneficial effect of 8 weeks low‐salt diet on the aforementioned characteristics. The primary endpoint was change at follow‐up in LV systolic function as assessed by global longitudinal strain (GLS). The secondary endpoints included changes in LV diastolic function [peak early diastolic mitral annular velocity (e′)], left atrial (LA) function [peak atrial longitudinal strain (PALS) and peak atrial contractile strain (PACT)], brachial artery flow, muscle perfusion [microvascular blood volume (MBV), microvascular flow velocity (MFV), and MBF], and IR [glucose infusion rate (GIR) during euglycaemic–hyperinsulinaemic clamp steady state].
Patient selection
Participants satisfying the selection criteria were recruited through community advertising (internet/newspaper) and from local general practice clinics. The studied group comprised 50 overweight/obese subjects [body mass index (BMI) > 25 kg/m2], with IR [homeostatic model assessment of insulin resistance (HOMA‐IR) > 2.0 further confirmed by GIR < 4.9 mg/kg/min], 14 who had normal or pre‐diabetic fasting plasma glucose (<7.0 mmol) levels and urinary sodium excretion > 100 mmol/day indicating higher sodium intake than recommended. Exclusion criteria were hypertension, CV disease, diabetes mellitus, polycystic ovarian syndrome, and any chronic pharmacotherapy (e.g. angiotensin‐converting enzyme inhibitors, aspirin, and metformin).
The referent group included 25 healthy individuals with normal BMI < 25 kg/m2 and HOMA‐IR < 1.78. 15 All study subjects were informed of the purpose of the study and provided written informed consent. Investigations were in accordance with the Declaration of Helsinki and were approved by Wroclaw Medical University Bioethics Committee.
Study protocol, randomization, and masking
After 12 h overnight fasting, blood pressure, laboratory panel (including plasma glucose, insulin, and aldosterone), and anthropometric data (height, weight, and hip and waist circumferences) were collected in all participants. A 24 h urinary sample was taken to measure sodium excretion. Degree of insulin sensitivity was evaluated by euglycaemic–hyperinsulinaemic clamp. Echocardiography, skeletal muscle perfusion, and vascular ultrasound examinations were performed during fasting and under stable clamp conditions. Subsequently, overweight/obese insulin‐resistant subjects were randomized to either a reduced or usual sodium diet for 8 weeks. The randomization procedure was performed in blocks of 10 sequentially numbered, opaque, sealed envelopes with an allocation ratio 1:1. The group assignment was unblinded for investigators performing the assessments and blinded for investigators carrying out data analysis. In the interventional part of the study, the baseline investigations were repeated after 8 weeks (Figures 1 and 2 ).
Figure 1.
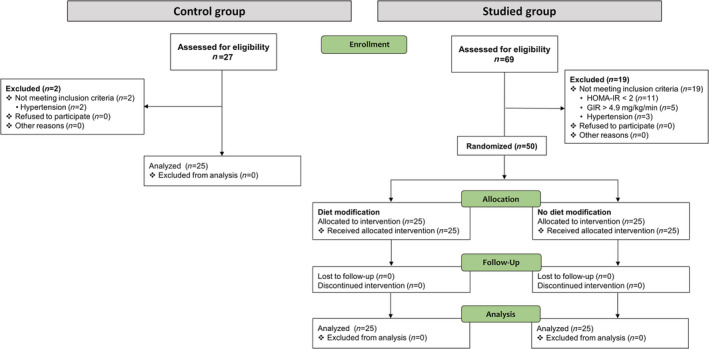
The study flow chart. GIR, glucose infusion rate; HOMA‐IR, homeostatic model assessment of insulin resistance.
Figure 2.
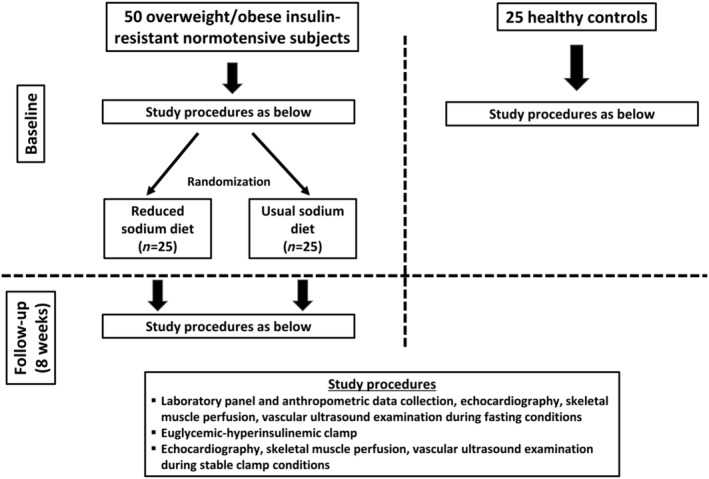
The study protocol.
Usual vs. reduced sodium diet
The purpose of dietary modification supervised by a clinical dietician was to reduce daily sodium intake by 25%, with caloric, potassium, saturated and unsaturated fat, protein, and carbohydrate ingestion remaining unchanged. Subjects randomized to the usual sodium diet were instructed to maintain their dietary habits for the duration of the study. Enrollees from both study arms were instructed to maintain their usual lifestyle habits. To assess dietary compliance, participants from both the usual sodium and reduced sodium groups completed a 24 h food recall every 2 weeks and a 24 h urine sample was collected after 2 and 4 weeks to measure sodium excretion. Every participant, who had not managed to achieve 25% reduction of sodium intake, was advised by the clinical dietician.
Laboratory assessments
Peripheral venous blood samples were drawn between 8:00 a.m. and 9:00 a.m. after 30 min of rest in the supine position. Fasting blood glucose, insulin, haemoglobin, creatinine, and urinary sodium excretion were measured by standard hospital pathology laboratory protocols. Serum aldosterone was assessed by a radioimmunoassay from Immunotech (Prague, Czech Republic). The HOMA‐IR, an index of IR, was calculated as the product of fasting insulin multiplied by fasting glucose divided by 405.
Euglycaemic–hyperinsulinaemic clamp
A 2 h euglycaemic–hyperinsulinaemic clamp was carried out after a 12 h overnight fast. Briefly, an intravenous catheter was placed in an antecubital vein to infuse insulin and glucose. A second catheter was placed retrograde in a dorsal vein of the contralateral hand for arterialized blood withdrawal. Regular human insulin (120 mU/m2/min, Actrapid; Novo Nordisk, Denmark) was infused for 2 h, and a 20% glucose solution was co‐infused at a variable rate to maintain glycaemia within 10% of basal. The GIR during the stable period of the clamp was used as a measure of whole body insulin sensitivity.
Vascular ultrasonography
Brachial artery blood flow
Ultrasonographic 2D longitudinal images of the brachial artery were obtained, and the diameter was measured as a distance between each inside edge of the arterial intima 10 cm proximal to the antecubital fold. Flow velocity was determined using pulse‐wave Doppler, and brachial flow was calculated from the diameter and velocity measurements.
Skeletal muscle microvascular perfusion
Contrast‐enhanced ultrasound for skeletal muscle microvascular perfusion was performed using a linear array transducer (L9‐D) positioned over the quadriceps (half of the distance from the patella to inguinal fold). Mechanical index (0.15 for continuous and 1.20 for flash), gain settings, and frame rate of cine recordings (22 Hz) were identical in all examinations. Depth and focus were optimized for each study. Microbubbles (Sonovue, Bracco, Milan, Italy) were reconstituted according to the manufacturer's instruction using a supplied 0.9% saline and continuously infused intravenously at an initial rate of 2.5 mL/min for 1 min followed by 1 mL/min. Once the microbubble concentration achieved steady state (∼2 min after the beginning of infusion), a high‐energy, brief burst of ultrasound (flash) was generated to transitorily destroy microbubbles within the volume of skeletal muscle being imaged, and a subsequent microbubbles replenishment was assessed during a continuous, real‐time low‐power imaging. Two successive 40 s acquisitions of flash‐replenishment cycles were carried out.
Digital image analysis was conducted offline using a dedicated software (Echopac v. 202, GE Medical Systems, Horten, Norway). Images were background subtracted (using the frame at 0.5 s post flash) (using the 0.5 s frame) to eliminate signal from larger blood vessels and tissue per se. Background‐corrected acoustic intensity was expressed against time and fitted to the function: y = A (1 − e −β(t−tb)), where y is acoustic intensity at time t, tb is the background time, A is plateau acoustic intensity reflecting MBV, and β is the rate constant of microvascular re‐filling, proportional to MFV. Skeletal muscle MBF was computed as the product of blood volume multiplied by velocity (A × β). MBV, MFV, and MBF are presented as averages from the two flash‐replenishment cycles recorded successively at a given stage of the protocol.
Echocardiography
Echocardiographic imaging was performed using standard equipment (Vivid e9, General Electric Medical Systems, Milwaukee, Wisconsin) with a M5S phased array multifrequency transducer. Imaging data were analysed offline after being saved in the digital format on a secure server.
Conventional, 3D, and tissue Doppler imaging
Cardiac dimensions and wall thicknesses were measured according to recommendations of the American Society of Echocardiography and the European Association of Cardiovascular Imaging. 16 LV volumes and ejection fraction were assessed by 3D approach, whereas LA volumes by the area‐length method. LV inflow parameters including peak early (E) and late diastolic flow velocity (A) and deceleration time of early diastolic flow wave (DT) were evaluated from the apical four‐chamber view by pulsed‐wave Doppler with the sample volume placed between the tips of the mitral leaflets. Pulsed‐wave tissue Doppler was used to evaluate peak early diastolic tissue velocity (e′) at the septal and lateral portions of the mitral annulus. The ratio of mitral inflow early diastolic velocity to the average e′ velocity from both parts of the mitral annulus (E/e′) was calculated to approximate LV filling pressure.
Speckle tracking imaging
Left ventricular longitudinal deformation was evaluated by semi‐automated 2D speckle tracking (Echopac v.202, GE Medical Systems, Horten, Norway) in the three apical views at a temporal resolution of 60–90 frames/s. The average negative value on the strain curve was presented as GLS. The apical four‐chamber and two‐chamber views were used to evaluate LA longitudinal strain, and the onset of QRS was accepted as the zero reference point.
Peak atrial longitudinal strain (corresponding to LA reservoir function) was measured as the peak value of longitudinal strain during LV systole, and PACS (corresponding to atrial contractile function) was assessed as the value of strain at the onset of P wave in electrocardiogram. The final LA strain values were the averages from both apical views.
All echocardiographic parameters were averaged over three consecutive cardiac cycles.
Statistical analysis
The sample size was calculated addressing the primary endpoint in the interventional part of the study. As no intervention trial with reduced sodium consumption with LV functional endpoint was available, we used the results of previous studies assessing the relationships between sodium intake and IR, and our previous data on the effect of lifestyle (dietary and exercise) intervention‐induced IR reduction on LV deformation increase. 9 , 33 , 34 Assuming a 7% improvement in GLS in response to a 10% improvement in IR following a 25% reduction in sodium intake and applying the variance seen in our patients, a sample size of 23 per group was anticipated to show a significant difference (P < 0.05) at a power of 80%. To allow for drop‐outs, the number of patients in each study arm was increased to 25.
Data are presented as mean ± standard deviation for continuous variables and as counts and percentages for categorical variables. Between‐group comparisons were performed by an unpaired two‐sided Student's t‐test or, when more than two groups were included, by one‐way ANOVA with Scheffe's post hoc test for continuous variables and by χ 2 for categorical variables. Homogeneity of variances was assessed by the Levene test. Longitudinal analyses were performed by a mixed‐design ANOVA for repeated measures, with the test of interest being an interaction of treatment and time (baseline to 8 weeks) on the dependent variable. Associations between variables were studied with the use of univariable and multivariable regression analysis. Interactions between the reduced sodium diet and change in MFV at follow‐up and between change in MFV response to insulin and change in GIR at follow‐up were tested using general linear models. To clarify the nature of the relationship between urinary sodium (reflecting sodium intake) and GLS, mediation analysis was employed, 18 using MFV and GIR as mediator variables. Changes in particular parameters with intervention were calculated by subtracting the baseline value from the follow‐up value and were expressed in the units of their measurements. All calculations were carried out with standard statistical software (Statistica Version 13, TIBCO Software Inc., Palo Alto, CA, USA). The level of statistical significance was set at a two‐sided P‐value < 0.05.
Results
Patient characteristics
The baseline demographic, clinical, and cardiac structural characteristics of the studied population are presented in Table 1 ; cardiac functional, vascular, and skeletal muscle perfusion parameters are displayed in Table 2 . In comparison with lean controls, both weight excess–IR groups were by definition characterized by higher BMI, waist circumference, waist‐to‐hip ratio, HOMA‐IR, fasting insulin and glucose, and lower GIR. Moreover, patients with weight excess and IR demonstrated higher urine sodium excretion and circulating aldosterone, LV diastolic and systolic abnormalities (lower e′ and GLS, respectively), impaired LA function (lower PALS and PACT), and reduced skeletal muscle perfusion (lower MBV, MFV, and MBF). In addition, in both weight excess–IR groups, an impaired response to insulin infusion during clamp was noted for GLS, PALS, MFV, MBF, MBV, and brachial artery velocity (the latter two only for the reduced sodium diet arm). There were no significant differences between the reduced sodium and usual sodium diet subsets with respect to any variable.
Table 1.
Baseline clinical and cardiac structural characteristics of the studied population
| Parameter | Controls (1) | Reduced sodium diet (2) | Usual sodium diet (3) | P 1–2 | P 1–3 | P 2–3 |
|---|---|---|---|---|---|---|
| Age, years | 44.5 ± 10.2 | 46.8 ± 13.6 | 45.9 ± 12.4 | 0.50 | 0.69 | 0.78 |
| Male sex, n (%) | 9 (36) | 11 (44) | 14 (56) | 0.56 | 0.16 | 0.40 |
| BMI, kg/m2 | 24.2 ± 1.1 | 31.7 ± 5.1 | 30.3 ± 4.5 | <0.001 | <0.001 | 0.22 |
| Waist circumference, cm | 88.6 ± 10.2 | 102.3 ± 13.1 | 103.2 ± 11.2 | <0.001 | <0.001 | 0.77 |
| WHR | 0.86 ± 0.08 | 0.93 ± 0.12 | 0.94 ± 0.10 | 0.01 | 0.005 | 0.65 |
| HOMA‐IR | 0.84 ± 0.25 | 5.55 ± 2.13 | 5.50 ± 1.43 | <0.001 | <0.001 | 0.91 |
| Insulin, μIU/mL | 3.6 ± 1.0 | 21.9 ± 8.8 | 22.2 ± 5.6 | <0.001 | <0.001 | 0.86 |
| Glucose, mg/dL | 93.6 ± 8.8 | 104.1 ± 11.7 | 101.4 ± 11.4 | <0.001 | 0.01 | 0.37 |
| GIR, mg/kg/min | 8.56 ± 2.31 | 3.27 ± 1.30 | 3.49 ± 0.94 | <0.001 | <0.001 | 0.64 |
| Urine sodium, mmol/24 h | 175 ± 59 | 224 ± 57 | 220 ± 54 | 0.003 | 0.006 | 0.82 |
| Aldosterone, pg/mL | 115 ± 50 | 144 ± 48 | 145 ± 49 | 0.03 | 0.03 | 0.93 |
| Haemoglobin, g/dL | 14.7 ± 1.3 | 14.6 ± 1.2 | 13.8 ± 0.6 | 0.83 | 0.27 | 0.31 |
| Creatinine, mg/dL | 0.89 ± 0.15 | 0.93 ± 0.12 | 0.93 ± 0.21 | 0.53 | 0.48 | 0.92 |
| eGFR, mL/min/1.73 m2 | 86.7 ± 11.3 | 78.9 ± 13.2 | 82.1 ± 16.5 | 0.06 | 0.29 | 0.47 |
| Systolic blood pressure, mmHg | 119 ± 11 | 119 ± 10 | 119 ± 12 | 0.93 | 0.87 | 0.80 |
| Diastolic blood pressure, mmHg | 76 ± 7 | 75 ± 8 | 75 ± 8 | 0.68 | 0.69 | 0.99 |
| LV mass index, g/m2.7 | 78.2 ± 14.9 | 86.2 ± 19.1 | 84.3 ± 15.4 | 0.09 | 0.20 | 0.70 |
| LVEDD, mm | 50.2 ± 4.5 | 51.2 ± 4.4 | 50.3 ± 3.6 | 0.40 | 0.97 | 0.43 |
| LAVI, mL/m2 | 29.3 ± 8.0 | 28.8 ± 8.9 | 27.2 ± 7.0 | 0.83 | 0.38 | 0.52 |
BMI, body mass index; eGFR, estimated glomerular filtration rate; GIR, glucose infusion rate; HOMA‐IR, homeostatic model assessment of insulin resistance; LAVI, left atrial volume index; LV, left ventricular; LVEDD, left ventricular end‐diastolic dimension; WHR, waist‐to‐hip ratio.
Values are means ± standard deviation for continuous variables and counts and percentages for categorical variables.
All significant P‐values are depicted in bold to improve the clarity of presentation.
Table 2.
Cardiac functional, vascular, and perfusion characteristics at baseline–at fasting conditions and response to euglycaemic–hyperinsulinaemic clamp
| Parameter | Fasting | Response to insulin (change from fasting to peak clamp) | ||||||||||
|---|---|---|---|---|---|---|---|---|---|---|---|---|
| Controls (1) | Reduced sodium diet (2) | Usual sodium diet (3) | P 1–2 | P 1–3 | P 2–3 | Controls (1) | Reduced sodium diet (2) | Usual sodium diet (3) | P 1–2 | P 1–3 | P 2–3 | |
| Cardiac function | ||||||||||||
| E/A | 1.55 ± 0.57 | 1.41 ± 1.23 | 1.24 ± 0.38 | 0.55 | 0.18 | 0.45 | −0.04 ± 0.36 | −0.19 ± 1.27 | −0.01 ± 0.22 | 0.50 | 0.89 | 0.41 |
| DT, ms | 198 ± 29 | 211 ± 30 | 214 ± 56 | 0.26 | 0.18 | 0.85 | 2.79 ± 26.46 | −1.72 ± 40.45 | 10.32 ± 43.14 | 0.68 | 0.49 | 0.26 |
| e′ septal, cm/s | 11.2 ± 2.7 | 8.8 ± 3.1 | 9.3 ± 2.1 | 0.001 | 0.01 | 0.49 | 0.46 ± 1.14 | 0.04 ± 0.98 | 0.06 ± 1.28 | 0.20 | 0.23 | 0.95 |
| e′ lateral, cm/s | 14.2 ± 3.9 | 11.2 ± 3.7 | 12.0 ± 3.5 | 0.005 | 0.04 | 0.44 | 0.46 ± 1.56 | 0.20 ± 1.50 | 0.36 ± 2.06 | 0.60 | 0.84 | 0.74 |
| E/e′ | 7.80 ± 2.19 | 8.12 ± 2.68 | 7.47 ± 2.22 | 0.64 | 0.63 | 0.34 | −0.41 ± 0.84 | −0.07 ± 1.25 | −0.43 ± 1.48 | 0.32 | 0.97 | 0.30 |
| LV ejection fraction, % | 64.9 ± 5.4 | 64.2 ± 5.0 | 63.3 ± 5.4 | 0.62 | 0.29 | 0.58 | 1.84 ± 4.66 | 0.54 ± 3.44 | 0.43 ± 5.63 | 0.33 | 0.30 | 0.94 |
| GLS, % | 19.3 ± 1.68 | 17.3 ± 1.43 | 16.7 ± 1.97 | <0.001 | <0.001 | 0.21 | 1.22 ± 1.40 | 0.26 ± 0.91 | 0.07 ± 1.50 | 0.01 | 0.002 | 0.61 |
| PALS, % | 33.9 ± 6.08 | 25.5 ± 5.15 | 26.9 ± 4.78 | <0.001 | <0.001 | 0.34 | 2.67 ± 5.09 | 0.12 ± 2.60 | −0.08 ± 3.45 | 0.02 | 0.01 | 0.86 |
| PACT, % | 13.98 ± 2.74 | 12.23 ± 2.23 | 12.21 ± 1.98 | 0.009 | 0.009 | 0.98 | 1.14 ± 1.79 | 0.29 ± 1.88 | 0.31 ± 2.36 | 0.14 | 0.15 | 0.98 |
| Skeletal muscle perfusion | ||||||||||||
| Microvascular blood volume, dB | 3.75 ± 1.16 | 3.21 ± 0.95 | 2.92 ± 0.81 | 0.06 | 0.004 | 0.28 | 0.91 ± 1.52 | 0.14 ± 0.82 | 0.52 ± 0.63 | 0.01 | 0.20 | 0.20 |
| Microvascular flow velocity, 1/s | 0.38 ± 0.14 | 0.24 ± 0.08 | 0.27 ± 0.11 | <0.001 | <0.001 | 0.34 | 0.09 ± 0.13 | 0.03 ± 0.09 | 0.03 ± 0.07 | 0.04 | 0.04 | 0.95 |
| Microvascular blood flow, dB/s | 1.49 ± 0.81 | 0.80 ± 0.45 | 0.81 ± 0.46 | <0.001 | <0.001 | 0.95 | 0.75 ± 0.82 | 0.17 ± 0.49 | 0.27 ± 0.34 | <0.001 | 0.006 | 0.50 |
| Vascular characteristics | ||||||||||||
| Brachial artery diameter, mm | 4.0 ± 0.4 | 4.2 ± 0.9 | 4.0 ± 0.5 | 0.25 | 0.88 | 0.32 | 0.08 ± 0.11 | −0.01 ± 0.15 | 0.02 ± 0.15 | 0.06 | 0.19 | 0.54 |
| Brachial artery peak velocity, cm/s | 82.6 ± 24.4 | 91.6 ± 27.8 | 89.1 ± 18.0 | 0.19 | 0.34 | 0.71 | 8.9 ± 17.9 | −10.8 ± 24.2 | −1.7 ± 16.6 | <0.001 | 0.06 | 0.11 |
| Brachial artery blood flow, mL/min | 84.8 ± 37.9 | 82.0 ± 30.0 | 80.7 ± 23.0 | 0.75 | 0.64 | 0.88 | 17.2 ± 27.2 | 6.3 ± 41.8 | 5.3 ± 21.6 | 0.22 | 0.18 | 0.91 |
A, late diastolic mitral inflow velocity; DT, deceleration time of E wave; E, peak early diastolic mitral flow velocity; e′, peak early diastolic mitral annular velocity; GLS, global longitudinal strain; LV, left ventricular; PACT, peak atrial contraction strain; PALS, peak atrial longitudinal strain.
Values are means ± standard deviation.
All significant P‐values are depicted in bold to improve the clarity of presentation.
Changes in clinical and laboratory parameters with dietary intervention
In addition to the deliberate decrease in urine sodium excretion, which on average exceeded 30%, the reduced sodium diet arm exhibited an improvement in IR, as evidenced by a significant increase in GIR and decrease in HOMA‐IR, and a borderline decrease in serum aldosterone (P = 0.06). There were no significant changes at follow‐up in either group in all body fat‐related parameters and blood pressure (Table 3 ).
Table 3.
Changes at follow‐up in anthropometric, metabolic, hormonal, and blood pressure profile in the studied population
| Parameter | Reduced sodium diet | Usual sodium diet | P |
|---|---|---|---|
| BMI, kg/m2 | −0.10 ± 0.48 | −0.07 ± 0.56 | 0.84 |
| Waist circumference, cm | −0.28 ± 1.10 | −0.60 ± 1.11 | 0.38 |
| WHR | 0.01 ± 0.01 | 0.01 ± 0.01 | 0.56 |
| HOMA‐IR | −0.87 ± 2.42 | 0.29 ± 1.46 | 0.04 |
| Insulin, μIU/mL | −3.53 ± 9.38 | 0.16 ± 4.23 | 0.08 |
| Glucose, mg/dL | −1.0 ± 9.0 | 2.9 ± 15.7 | 0.30 |
| GIR, mg/kg/min | 1.62 ± 2.49 | −0.28 ± 0.74 | 0.001 |
| Urine sodium excretion, mmol/24 h | −68.9 ± 26.0 | 34.6 ± 65.9 | <0.001 |
| % decrease in urine sodium excretion, % | −30.9 ± 10.1 | 17.1 ± 31.9 | <0.001 |
| Aldosterone, pg/mL | 44.8 ± 50.6 | 14.3 ± 63.2 | 0.06 |
| Systolic blood pressure, mmHg | −0.72 ± 4.55 | 0.24 ± 6.66 | 0.55 |
| Diastolic blood pressure, mmHg | −0.32 ± 4.28 | 1.36 ± 4.75 | 0.19 |
BMI, body mass index; eGFR, estimated glomerular filtration rate; GIR, glucose infusion rate; HOMA‐IR, homeostatic model assessment of insulin resistance; WHR, waist‐to‐hip ratio.
Values are means ± standard deviation.
All significant P‐values are depicted in bold to improve the clarity of presentation.
Changes in cardiac function and vascular and muscle perfusion characteristics with dietary intervention
The reduced sodium diet group demonstrated improvements in LV systolic function (increase in GLS), LV diastolic function (increase in e′), LA function (increase in PALS), and muscle perfusion (increase in MFV) in fasting conditions, as well as improved responses of GLS and muscle perfusion (MFV and MBF) to insulin during clamp. No significant changes with intervention were noted for the evaluated vascular indices (Table 4 ). Examples of the effect of reduced sodium diet on skeletal muscle perfusion and LV deformation are presented in Figure 3 .
Table 4.
Cardiac functional, vascular, and perfusion characteristics after intervention–at fasting conditions and response to euglycaemic–hyperinsulinaemic clamp
| Change from baseline to follow‐up (follow‐up value minus baseline value) | Fasting | Response to insulin (change from fasting to peak clamp) | ||||
|---|---|---|---|---|---|---|
| Reduced sodium diet | Usual sodium diet | P | Reduced sodium diet | Usual sodium diet | P | |
| Cardiac function | ||||||
| E/A | −0.16 ± 1.33 | −0.03 ± 0.23 | 0.63 | 0.24 ± 1.31 | −0.01 ± 0.34 | 0.35 |
| DT, ms | −1.76 ± 37.74 | −5.92 ± 48.16 | 0.74 | 2.08 ± 54.52 | −5.60 ± 54.58 | 0.62 |
| e′ septal, cm/s | 1.12 ± 1.13 | 0.08 ± 1.68 | 0.01 | −0.20 ± 2.71 | −0.42 ± 1.82 | 0.74 |
| e′ lateral, cm/s | 0.92 ± 1.75 | 0.12 ± 2.39 | 0.18 | −0.68 ± 2.44 | −0.72 ± 2.07 | 0.95 |
| E/e′ | −0.45 ± 1.31 | −0.31 ± 2.41 | 0.79 | −0.11 ± 2.43 | 0.23 ± 1.63 | 0.56 |
| LV ejection fraction, % | 0.86 ± 4.37 | 0.65 ± 3.90 | 0.87 | 1.29 ± 5.23 | −0.25 ± 5.35 | 0.36 |
| GLS, % | 0.92 ± 1.20 | 0.25 ± 0.91 | 0.03 | 1.05 ± 0.90 | 0.25 ± 1.45 | 0.02 |
| PALS, % | 1.54 ± 3.50 | −0.79 ± 4.03 | 0.03 | 1.22 ± 4.39 | −0.83 ± 4.85 | 0.12 |
| PACT, % | 1.36 ± 2.61 | 0.03 ± 2.23 | 0.06 | −0.18 ± 2.71 | 0.11 ± 3.02 | 0.72 |
| Skeletal muscle perfusion | ||||||
| Microvascular blood volume, dB | 0.11 ± 1.08 | 0.06 ± 0.86 | 0.85 | 0.22 ± 1.27 | −0.22 ± 0.80 | 0.15 |
| Microvascular flow velocity, 1/s | 0.04 ± 0.10 | −0.01 ± 0.07 | 0.04 | 0.07 ± 0.16 | −0.03 ± 0.09 | 0.01 |
| Microvascular blood flow, dB/s | 0.13 ± 0.44 | 0.03 ± 0.37 | 0.38 | 0.44 ± 0.93 | −0.20 ± 0.36 | 0.002 |
| Vascular characteristics | ||||||
| Brachial artery diameter, mm | 0.06 ± 0.19 | −0.01 ± 0.15 | 0.19 | 0.04 ± 0.27 | −0.01 ± 0.21 | 0.51 |
| Brachial artery peak velocity, cm/s | 4.40 ± 39.47 | −0.90 ± 22.32 | 0.60 | 4.80 ± 35.20 | 2.40 ± 22.06 | 0.80 |
| Brachial artery blood flow, mL/min | 3.1 ± 15.7 | −3.0 ± 23.3 | 0.28 | 1.6 ± 43.8 | −3.8 ± 38.9 | 0.65 |
A, late diastolic mitral inflow velocity; DT, deceleration time of E wave; E, peak early diastolic mitral flow velocity; e′, peak early diastolic mitral annular velocity; GLS, global longitudinal strain; LV, left ventricular; PACT, peak atrial contraction strain; PALS, peak atrial longitudinal strain.
Values are means ± standard deviation.
All significant P‐values are depicted in bold to improve the clarity of presentation.
Figure 3.
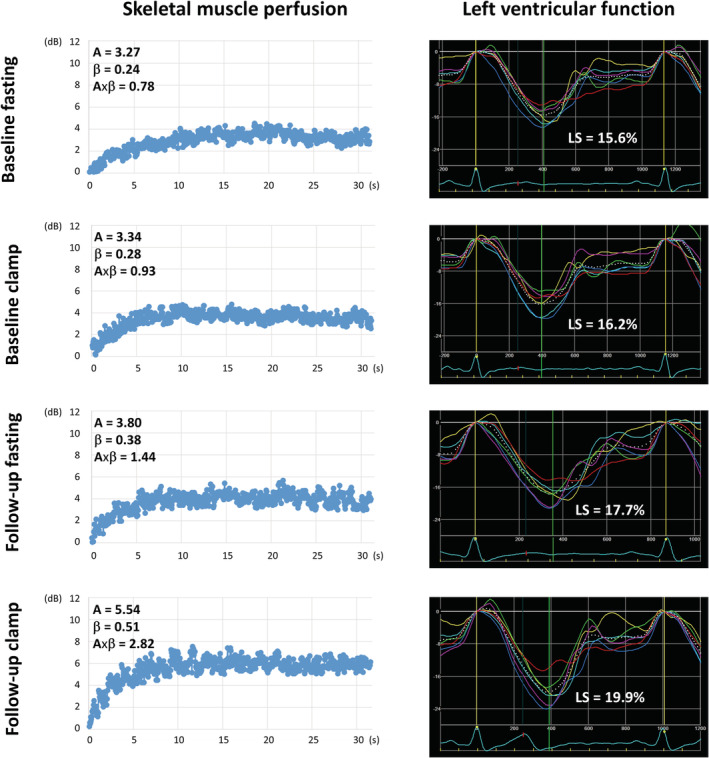
Examples of the effect of reduced sodium diet on skeletal muscle perfusion and left ventricular (LV) function in an overweight/obese individual. Caption: Only a minor increase in muscle perfusion and LV strain in response to insulin infusion during clamp at baseline. After an 8 week reduced sodium diet, significant improvements in muscle perfusion and LV strain, both during fasting and insulin infusion during clamp. A, plateau acoustic intensity reflecting microvascular blood volume; β, the rate constant of microvascular re‐filling reflecting microvascular flow velocity; A × β, the product of blood volume multiplied by velocity reflecting myocardial blood flow; LS, LV longitudinal strain in the apical four‐chamber view.
Associations
Urinary sodium excretion, representing dietary sodium intake, was associated with GIR at both baseline (β −0.46; SE 0.10; P < 0.001) and follow‐up (β −0.35; SE 0.13; P = 0.01 for changes from baseline to follow‐up), muscle perfusion (Supporting Information, Table S1 ), and LV function (change in urine sodium vs. change in GLS response to insulin at follow‐up; Supporting Information, Figure S1 ).
The associations of cardiac function with IR and muscle perfusion parameters (GIR and MFV) are presented in Supporting Information, Table S2 . After adjustment for age, sex, BMI, waist‐to‐hip ratio, blood pressure, and serum aldosterone, significant associations were found for e′ (fasting at baseline and follow‐up), E/e′ (fasting at baseline), GLS (response to insulin at baseline and follow‐up, and fasting at follow‐up), and PALS (fasting at baseline and follow‐up, and response to insulin at follow‐up). Scatterplots illustrating associations between change in GLS response to insulin at follow‐up and changes in GIR and MFV at follow‐up are shown in Supporting Information, Figure S1 .
Bivariable regression analysis revealed a significant interaction between the allocation to low‐salt diet and change from baseline to follow‐up in MFV during fasting on change in GIR at follow‐up (P = 0.030), and between change in MFV response to insulin at follow‐up and change in GIR at follow‐up on change in GLS response to insulin at follow‐up (P = 0.026). Regression‐based mediation analysis demonstrated that the relationship between urinary sodium excretion and GLS was partially mediated by MFV and GIR, as evidenced by the reduction in variance of GLS explained by urinary sodium excretion after the inclusion of MFV and GIR to the model (decrease in beta coefficient from −0.29 to −0.16 for change in GLS in response to insulin infusion from baseline to follow‐up; Figure 4 ).
Figure 4.
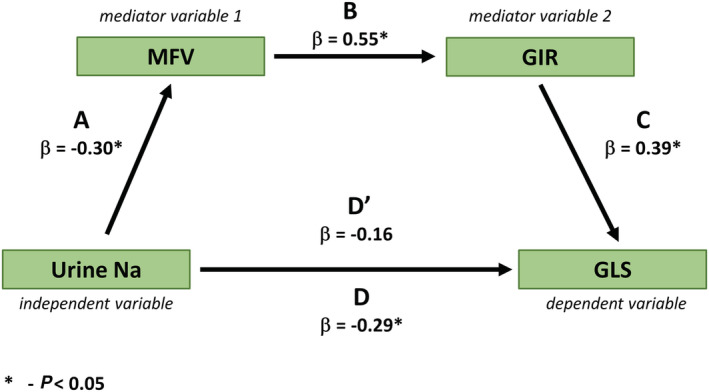
Mediating effect of microvascular flow velocity and glucose infusion rate on the relationship between change in urinary sodium at follow‐up and change in left ventricular global longitudinal strain response to insulin infusion from baseline to follow‐up in the normotensive overweight/obese insulin‐resistant population. Caption: β, beta coefficient; D, beta coefficient of urine sodium predicting GLS in a univariable regression analysis (i.e. without the mediating effect of MFV and GIR); D′, beta coefficient of urine sodium predicting GLS in a multivariable regression analysis including urine sodium, MFV, and GIR (i.e. with the mediating effect of MFV and GIR); GIR, glucose infusion rate; GLS, left ventricular global longitudinal strain; MFV, microvascular flow velocity.
No significant associations between serum aldosterone and cardiac function at both baseline and post dietary intervention were found.
Discussion
The major findings of the current study are that in normotensive patients with overweight/obesity and impaired insulin sensitivity, improvement in cardiac function following the reduction of dietary salt intake is associated with improvements in skeletal muscle perfusion and IR. This relationship can be seen both with respect to myocardial performance during fasting and its response to physiological doses of insulin during euglycaemic–hyperinsulinaemic clamp. Our findings might extend the scope of indications for dietary sodium restriction as a preventive measure beyond the traditional focus on better blood pressure control.
Sodium intake, skeletal muscle perfusion, and insulin resistance
Despite positive evidence from animal studies, the association between sodium intake and IR has not been unequivocally documented on the clinical grounds. 11 , 12 , 13 , 14 , 32 Experimental data suggest that the putative contributor to high sodium‐induced IR may be microcirculation abnormalities. 33 , 34 Under healthy circumstances, insulin exerts robust vasodilatory actions in the skeletal muscle microvasculature, and an impairment in this physiologic response promotes IR. 22 A number of subcellular mechanisms mediating the effect of high sodium on muscle perfusion have been proposed, including impaired Na+/K+‐ATPase expression regulation, reduced activity of epithelial sodium channels in endothelial cells, and abnormal caveolin‐1–endothelial nitric oxide synthase interaction, all of which produce increased endothelial stiffness and blunted vascular relaxation. 16 , 17 The promotion of IR by high sodium diet can also be mediated by other, non‐vascular derived mechanisms, including the development of leptin resistance, hyperphagia, and increase in body fat content. 25
The current study demonstrated associations of sodium intake with skeletal muscle perfusion and insulin sensitivity, which may support the aforementioned hypothesis on the pathogenesis of IR resulting from excessive sodium consumption. The diet with a moderately reduced sodium content, implemented for 8 weeks in patients with body weight excess and IR, improved sensitivity to insulin and skeletal muscle perfusion. The presence of interaction between dietary intervention and increase in MFV in relation to change in GIR at follow‐up suggests a mediating role of improvement in muscle perfusion in the beneficial effect of diet on IR. This finding reinforces the notion that a microvascular deficiency in muscle impairing the delivery of insulin and glucose to the myocyte is essential for high sodium‐induced IR.
The effect of low‐salt diet was noted mainly with respect to MFV and MBF but not MBV, which might imply that the reduction of sodium intake facilitates changes in flow velocity within the microcirculation rather than capillary recruitment.
Dietary intervention and cardiac performance
The reduction of sodium intake can lead to alterations in metabolic, haemodynamic, and hormonal profile that might impact on cardiac function. Specifically, changes in insulin sensitivity, LV afterload, and renin–angiotensin–aldosterone and sympathetic system activation, as well as antioxidant defence in the heart, should be considered as potential contributors. 19 , 20 , 21 , 23 In addition, a direct influence of dietary sodium on the myocardial function by interfering with myocyte calcium handling has been postulated. 29 Another issue potentially determining the mechanisms behind cardiac effects and degree of responses to diet may be patient body weight and blood pressure status.
Insulin resistance has been widely recognized to participate in the pathogenesis of myocardial impairment in obesity via the activation of phosphoinositide 3‐kinase/protein kinase B cascade with a subsequent augmentation of cardiomyocyte hypertrophy and intrinsic stiffness, activation of insulin‐like growth factor‐1 receptors, increased response to angiotensin‐II, and promotion of sodium retention with intravascular volume expansion. 24 , 25
In the currently studied normotensive overweight population exhibiting subclinical LV and LA dysfunction, the restriction of dietary sodium was associated with improvements in cardiac performance in fasting conditions (increase in GLS, e′, and PALS) and improvement in GLS response to insulin during clamp. The analysis for GLS revealed that the favourable effect of diet on the myocardium was linked with the beneficial changes in muscle perfusion and IR, independent of changes in blood pressure and aldosterone level. The results of mediation analysis and the interaction between GIR and MFV on GLS response to insulin underpin the hypothesis that the likely sequence of events might be as follows: diet‐induced increase in skeletal muscle perfusion–decrease in IR–cardiac function improvement. The favourable changes in PALS associated with dietary intervention might reflect improvements in LV diastolic function and/or intrinsic LA function.
The absence of significant associations between changes in circulating aldosterone and improvement in cardiac function at follow‐up suggests that the beneficial effect of implemented diet on the heart was not related to the influence of sodium reduction on systemic aldosterone signalling.
Clinical implications
The contribution of this paper to the clarification of mechanism linking high sodium intake, IR, and cardiac impairment may improve the understanding of how to better prevent metabolic and CV risk in overweight persons. In particular, this issue might be important in preventing the progression to symptomatic heart failure. The recognition of myocardial dysfunction in patients with the aforementioned metabolic profile may justify the implementation of an appropriate heart failure prevention strategy, including dietary sodium restriction. The risk associated with high sodium intake is not similar across the entire population. Accordingly, there might be a need to refocus existing public health guidance on the dietary salt reduction. These recommendations might be of particular importance for overweight insulin‐resistant subjects with eating habits including high salt consumption and fast food preferences. The demonstrated efficacy of reducing sodium intake by one‐quarter, which is realistic to be implemented in daily practice, confirms applicability of this approach. This might be more implementable than the currently recommended sodium intake reduction ≤ 5 g/day 30 , 31 and therefore might contribute to more efficient CV risk prevention. Moreover, a moderate reduction of sodium ingestion is reasonable in the light of a recent finding that a more prominent restriction of dietary salt, that is, below 3 g/day, may be prognostically detrimental, 32 while reducing daily salt intake to 4 g improves CV outcomes, especially in overweight and obese subjects. 33 Thus, the current work provides further evidence for critical public health messages recommending restrictions in sodium consumption to address the looming obesity and heart failure epidemic by extending the benefits of these measures beyond the known blood pressure lowering effect. Given the recently demonstrated bidirectional association between BMI and urinary sodium excretion, dietary salt reduction and body weight reduction measures should be implemented concurrently to attain more sustainable health improvements. 34
Study limitations
First, a relatively small study sample might have contributed to the failure to detect significant differences or associations in some analyses. Second, LV function improvement with dietary intervention was of modest magnitude; therefore, its clinical significance is uncertain. Third, we did not demonstrate any significant effect of reduced sodium diet on brachial artery flow, which might be due to the limitations of the method used. Nevertheless, this is not contradictory to the results of muscle perfusion assessment, as the microvasculature can increase capillary flow independently of changes in bulk blood flow to the limb. 35 Fourth, despite the absence of associations between post‐intervention improvement in cardiac function and concomitant changes in blood pressure and systemic aldosterone, we cannot exclude the contribution of other, non‐metabolic mechanisms to the beneficial effect of reduced salt diet on myocardial performance in the studied population. However, we might hypothesize that in this specific clinical profile (overweight and IR but no hypertension), haemodynamic and hormonal effects of dietary sodium restriction might be of a lesser importance. Fifth, the exclusion of ischaemic heart disease was based only on a negative history and the absence of clinical symptoms, which might not ascertain the normal coronary status in each case. Finally, a single‐centre recruitment might affect the generalizability of our findings.
Conclusions
The reduction of dietary sodium intake in the normotensive overweight/obese insulin‐resistant population ameliorates cardiac functional abnormalities, and this effect may be associated with the concomitant improvements in skeletal muscle perfusion and IR. Our observation might contribute to better preventive management of patients being at risk of heart failure. The current investigations pave the way for large‐scale clinical studies aimed at validating our findings against clinical outcomes.
Conflict of interest
None declared.
Funding
This work was supported by the National Science Centre Poland (Narodowe Centrum Nauki) (Grant No. UMO‐2014/13/B/NZ7/02286).
Supporting information
Figure S1. Associations of changes at follow‐up in global longitudinal strain (GLS) response to insulin with changes at follow‐up in urine sodium, skeletal muscle perfusion response to insulin and insulin resistance (GIR) in the normotensive overweight/obese insulin resistant population.
Table S1. Associations of daily urine sodium excretion in the studied group.
Table S2. Associations of GIR and skeletal muscle microvascular flow velocity in the studied group.
Acknowledgements
The investigators are indebted to Prof. Thomas H. Marwick for helpful advices concerning this project.
Keske, M. A. , Przewlocka‐Kosmala, M. , Woznicka, A. K. , Mysiak, A. , Jankowska, E. A. , Ponikowski, P. , and Kosmala, W. (2021) Role of skeletal muscle perfusion and insulin resistance in the effect of dietary sodium on heart function in overweight. ESC Heart Failure, 8: 5304–5315. 10.1002/ehf2.13620.
This study was performed at Cardiology Department, Wroclaw Medical University, Wroclaw, Poland.
References
- 1. Kosmala W, Sanders P, Marwick TH. Subclinical myocardial impairment in metabolic diseases. JACC Cardiovasc Imaging 2017; 10: 692–703. [DOI] [PubMed] [Google Scholar]
- 2. St‐Pierre P, Genders AJ, Keske MA, Richards SM, Rattigan S. Loss of insulin‐mediated microvascular perfusion in skeletal muscle is associated with the development of insulin resistance. Diabetes Obes Metab 2010; 12: 798–805. [DOI] [PubMed] [Google Scholar]
- 3. Keske MA, Clerk LH, Price WJ, Jahn LA, Barrett EJ. Obesity blunts microvascular recruitment in human forearm muscle after a mixed meal. Diabetes Care 2009; 32: 1672–1677. [DOI] [PMC free article] [PubMed] [Google Scholar]
- 4. Premilovac D, Bradley EA, Ng HL, Richards SM, Rattigan S, Keske MA. Muscle insulin resistance resulting from impaired microvascular insulin sensitivity in Sprague Dawley rats. Cardiovasc Res 2013; 98: 28–36. [DOI] [PubMed] [Google Scholar]
- 5. Moosavian SP, Haghighatdoost F, Surkan PJ, Azadbakht L. Salt and obesity: a systematic review and meta‐analysis of observational studies. Int J Food Sci Nutr 2017; 68: 265–277. [DOI] [PubMed] [Google Scholar]
- 6. Tam CS, Xie W, Johnson WD, Cefalu WT, Redman LM, Ravussin E. Defining insulin resistance from hyperinsulinemic‐euglycemic clamps. Diabetes Care 2012; 35: 1605–1610. [DOI] [PMC free article] [PubMed] [Google Scholar]
- 7. Salgado AL, Carvalho L, Oliveira AC, Santos VN, Vieira JG, Parise ER. Insulin resistance index (HOMA‐IR) in the differentiation of patients with non‐alcoholic fatty liver disease and healthy individuals. Arq Gastroenterol 2010; 47: 165–169. [DOI] [PubMed] [Google Scholar]
- 8. Lang RM, Badano LP, Mor‐Avi V, Afilalo J, Armstrong A, Ernande L, Flachskampf FA, Foster E, Goldstein SA, Kuznetsova T, Lancellotti P, Muraru D, Picard MH, Rietzschel ER, Rudski L, Spencer KT, Tsang W, Voigt JU. Recommendations for cardiac chamber quantification by echocardiography in adults: an update from the American Society of Echocardiography and the European Association of Cardiovascular Imaging. Eur Heart J Cardiovasc Imaging 2015; 16: 233–270. [DOI] [PubMed] [Google Scholar]
- 9. Kosmala W, O'Moore‐Sullivan T, Plaksej R, Przewlocka‐Kosmala M, Marwick TH. Improvement of left ventricular function by lifestyle intervention in obesity: contributions of weight loss and reduced insulin resistance. Diabetologia 2009; 52: 2306–2316. [DOI] [PubMed] [Google Scholar]
- 10. Baron R, Kenny D. The moderator‐mediator variable distinction in social psychological research: conceptual, strategic, and statistical considerations. J Pers Soc Psychol 1986; 5: 1173–1182. [DOI] [PubMed] [Google Scholar]
- 11. Garg R, Williams GH, Hurwitz S, Brown NJ, Hopkins PN, Adler GK. Low‐salt diet increases insulin resistance in healthy subjects. Metabolism 2011; 60: 965–968. [DOI] [PMC free article] [PubMed] [Google Scholar]
- 12. Scherbakov N, Bauer M, Sandek A, Szabó T, Töpper A, Jankowska EA, Springer J, Haehling S, Anker SA, Lainscak M, Engeli S, Düngen HD, Doehner W. Insulin resistance in heart failure: differences between patients with reduced and preserved left ventricular ejection fraction. Eur J Heart Fail 2015; 17: 1015–1021. [DOI] [PubMed] [Google Scholar]
- 13. Townsend RR, Kapoor S, McFadden CB. Salt intake and insulin sensitivity in healthy human volunteers. Clin Sci (Lond) 2007; 113: 141–148. [DOI] [PubMed] [Google Scholar]
- 14. Perry CG, Palmer T, Cleland SJ, Morton IJ, Salt IP, Petrie JR, Gould GW, Connell J. Decreased insulin sensitivity during dietary sodium restriction is not mediated by effects of angiotensin II on insulin action. Clin Sci (Lond) 2003; 105: 187–194. [DOI] [PubMed] [Google Scholar]
- 15. Ueda S, Petrie JR, Cleland SJ, Elliott HL, Connell JM. The vasodilating effect of insulin is dependent on local glucose uptake: a double blind, placebo‐controlled study. J Clin Endocrinol Metab 1998; 83: 2126–2131. [DOI] [PubMed] [Google Scholar]
- 16. Mewes M, Nedele J, Schelleckes K, Bondareva O, Lenders M, Kusche‐Vihrog K, Schnittler HJ, Brand SM, Schmitz B, Brand E. Salt‐induced Na /K ‐ATPase‐a/b expression involves soluble adenylyl cyclase in endothelial cells. Pflugers Arch 2017; 469: 1401–1412. [DOI] [PubMed] [Google Scholar]
- 17. Wang ZR, Liu HB, Sun YY, Hu QQ, Li YX, Zheng WW, Yu CJ, Li XY, Wu MM, Song BL, Mu JJ, Yuan ZY, Zhang ZR, Ma HP. Dietary salt blunts vasodilation by stimulating epithelial sodium channels in endothelial cells from salt‐sensitive Dahl rats. Br J Pharmacol 2018; 175: 1305–1317. [DOI] [PMC free article] [PubMed] [Google Scholar]
- 18. Lanaspa MA, Kuwabara M, Andres‐Hernando A, Li N, Cicerchi C, Jensen T, Orlicky DJ, Roncal‐Jimenez CA, Ishimoto T, Nakagawa T, Rodriguez‐Iturbe B, MacLean PS, Johnson RJ. High salt intake causes leptin resistance and obesity in mice by stimulating endogenous fructose production and metabolism. Proc Natl Acad Sci USA 2018; 115: 3138–3143. [DOI] [PMC free article] [PubMed] [Google Scholar]
- 19. Kosmala W, Przewlocka‐Kosmala M, Szczepanik‐Osadnik H, Mysiak A, Marwick TH. Fibrosis and cardiac function in obesity: a randomised controlled trial of aldosterone blockade. Heart 2013; 99: 320–326. [DOI] [PubMed] [Google Scholar]
- 20. Alaagib N, Sukkar M, Kardash M. The Effects of Salt and Glucose Intake on Angiotensin II and Aldosterone in Obese and Nonobese Patients with Essential Hypertension. Int J Hypertens 2020; 2020: 6017105. [DOI] [PMC free article] [PubMed] [Google Scholar]
- 21. Rosa GB, Cavalet LC, de Melo ABS, Junior MDF, Lopes PR, Cardoso RA, Ferreira LA, Tomé FD, Nagib PRA, Celes MRN, Pedrino GR. High salt intake during puberty leads to cardiac remodelling and baroreflex impairment in lean and obese male Wistar rats. Br J Nutr 2020; 123: 642–651. [DOI] [PubMed] [Google Scholar]
- 22. Berger RCM, Benetti A, Girardi ACC, Forechi L, de Oliveira RM, Vassallo PF, Mill JG. Influence of Long‐Term Salt Diets on Cardiac Ca2 Handling and Contractility Proteins in Hypertensive Rats. Am J Hypertens 2018; 31: 726–734. [DOI] [PubMed] [Google Scholar]
- 23. Kosmala W, Przewlocka‐Kosmala M, Szczepanik‐Osadnik H, Mysiak A, O'Moore‐Sullivan T, Marwick TH. A randomized study of the beneficial effects of aldosterone antagonism on LV function, structure, and fibrosis markers in metabolic syndrome. JACC Cardiovasc Imaging 2011; 4: 1239–1249. [DOI] [PubMed] [Google Scholar]
- 24. Peterson LR, Herrero P, Schechtman KB, Racette SB, Waggoner AD, Kisrieva‐Ware Z, Dence C, Klein S, Marsala JA, Meyer T, Gropler RJ. Effect of obesity and insulin resistance on myocardial substrate metabolism and efficiency in young women. Circulation 2004; 109: 2191–2196. [DOI] [PubMed] [Google Scholar]
- 25. Kosmala W, O'Moore‐Sullivan TM, Plaksej R, Kuliczkowska‐Plaksej J, Przewlocka‐Kosmala M, Marwick TH. Subclinical impairment of left ventricular function in young obese women: contributions of polycystic ovary disease and insulin resistance. J Clin Endocrinol Metab 2008; 93: 3748–3754. [DOI] [PubMed] [Google Scholar]
- 26. Mente A, O'Donnell M, Rangarajan S, Dagenais G, Lear S, McQueen M, Diaz R, Avezum A, Lopez‐Jaramillo P, Lanas F, Li W, Lu Y, Yi S, Rensheng L, Iqbal R, Mony P, Yusuf R, Yusoff K, Szuba A, Oguz A, Rosengren A, Bahonar A, Yusufali A, Schutte AE, Chifamba J, Mann JFE, Anand SS, Teo K, Yusuf S, PURE, EPIDREAM and ONTARGET/TRANSCEND Investigators . Associations of urinary sodium excretion with cardiovascular events in individuals with and without hypertension: a pooled analysis of data from four studies. Lancet 2016; 388: 465–475. [DOI] [PubMed] [Google Scholar]
- 27. Tan KW, Quaye SED, Koo JR, Lim JT, Cook AR, Dickens BL. Assessing the Impact of Salt Reduction Initiatives on the Chronic Disease Burden of Singapore. Nutrients 2021; 13: 1171. [DOI] [PMC free article] [PubMed] [Google Scholar]
- 28. Feng Q, Yuan S, Yang Q, Lu Y, Loos RJF, Li GHY, Fei Y, Tsoi MF, Cheung CL, Cheung BMY. Causal associations between urinary sodium with body mass, shape and composition: a Mendelian randomization study. Sci Rep 2020; 10: 17475. [DOI] [PMC free article] [PubMed] [Google Scholar]
- 29. Vincent MA, Dawson D, Clark AD, Lindner JR, Rattigan S, Clark MG, Barrett EJ. Skeletal muscle microvascular recruitment by physiological hyperinsulinemia precedes increases in total blood flow. Diabetes 2002; 51: 42–48. [DOI] [PubMed] [Google Scholar]
- 30. Commission E . Survey on Member States' implementation of the EU salt reduction framework. Luxembourg: Publications Office of the European Union; 2014. [Google Scholar]
- 31. Piepoli MF, Hoes AW, Agewall S, Albus C, Brotons C, Catapano AL, Cooney MT, Corrà U, Cosyns B, Deaton C, Graham I, Hall MS, Hobbs FDR, Løchen ML, Löllgen H, Marques‐Vidal P, Perk J, Prescott E, Redon J, Richter DJ, Sattar N, Smulders Y, Tiberi M, van der Worp HB, van Dis I, Verschuren WMM, Binno S, ESC Scientific Document Group . 2016 European Guidelines on cardiovascular disease prevention in clinical practice: The Sixth Joint Task Force of the European Society of Cardiology and Other Societies on Cardiovascular Disease Prevention in Clinical Practice (constituted by representatives of 10 societies and by invited experts) Developed with the special contribution of the European Association for Cardiovascular Prevention & Rehabilitation (EACPR). Eur Heart J 2016; 37: 2315–2381. [DOI] [PMC free article] [PubMed] [Google Scholar]
- 32. Foo M, Denver AE, Coppack SW, Yudkin JS. Effect of salt‐loading on blood pressure, insulin sensitivity and limb blood flow in normal subjects. Clin Sci (Lond) 1998; 95: 157–164. [PubMed] [Google Scholar]
- 33. Ogihara T, Asano T, Ando K, Chiba Y, Sekine N, Sakoda H, Anai M, Onishi Y, Fujishiro M, Ono H, Shojima N, Inukai K, Fukushima Y, Kikuchi M, Fujita T. Insulin resistance with enhanced insulin signaling in high‐salt diet‐fed rats. Diabetes 2001; 50: 573–583. [DOI] [PubMed] [Google Scholar]
- 34. Ogihara T, Asano T, Ando K, Chiba Y, Sakoda H, Anai M, Shojima N, Ono H, Onishi Y, Fujishiro M, Katagiri H, Fukushima Y, Kikuchi M, Noguchi N, Aburatani H, Komuro I, Fujita T. Angiotensin II‐induced insulin resistance is associated with enhanced insulin signaling. Hypertension 2002; 40: 872–879. [DOI] [PubMed] [Google Scholar]
- 35. Dickinson KM, Clifton PM, Keogh JB. Endothelial function is impaired after a high‐salt meal in healthy subjects. Am J Clin Nutr 2011; 93: 500–505. [DOI] [PubMed] [Google Scholar]
Associated Data
This section collects any data citations, data availability statements, or supplementary materials included in this article.
Supplementary Materials
Figure S1. Associations of changes at follow‐up in global longitudinal strain (GLS) response to insulin with changes at follow‐up in urine sodium, skeletal muscle perfusion response to insulin and insulin resistance (GIR) in the normotensive overweight/obese insulin resistant population.
Table S1. Associations of daily urine sodium excretion in the studied group.
Table S2. Associations of GIR and skeletal muscle microvascular flow velocity in the studied group.