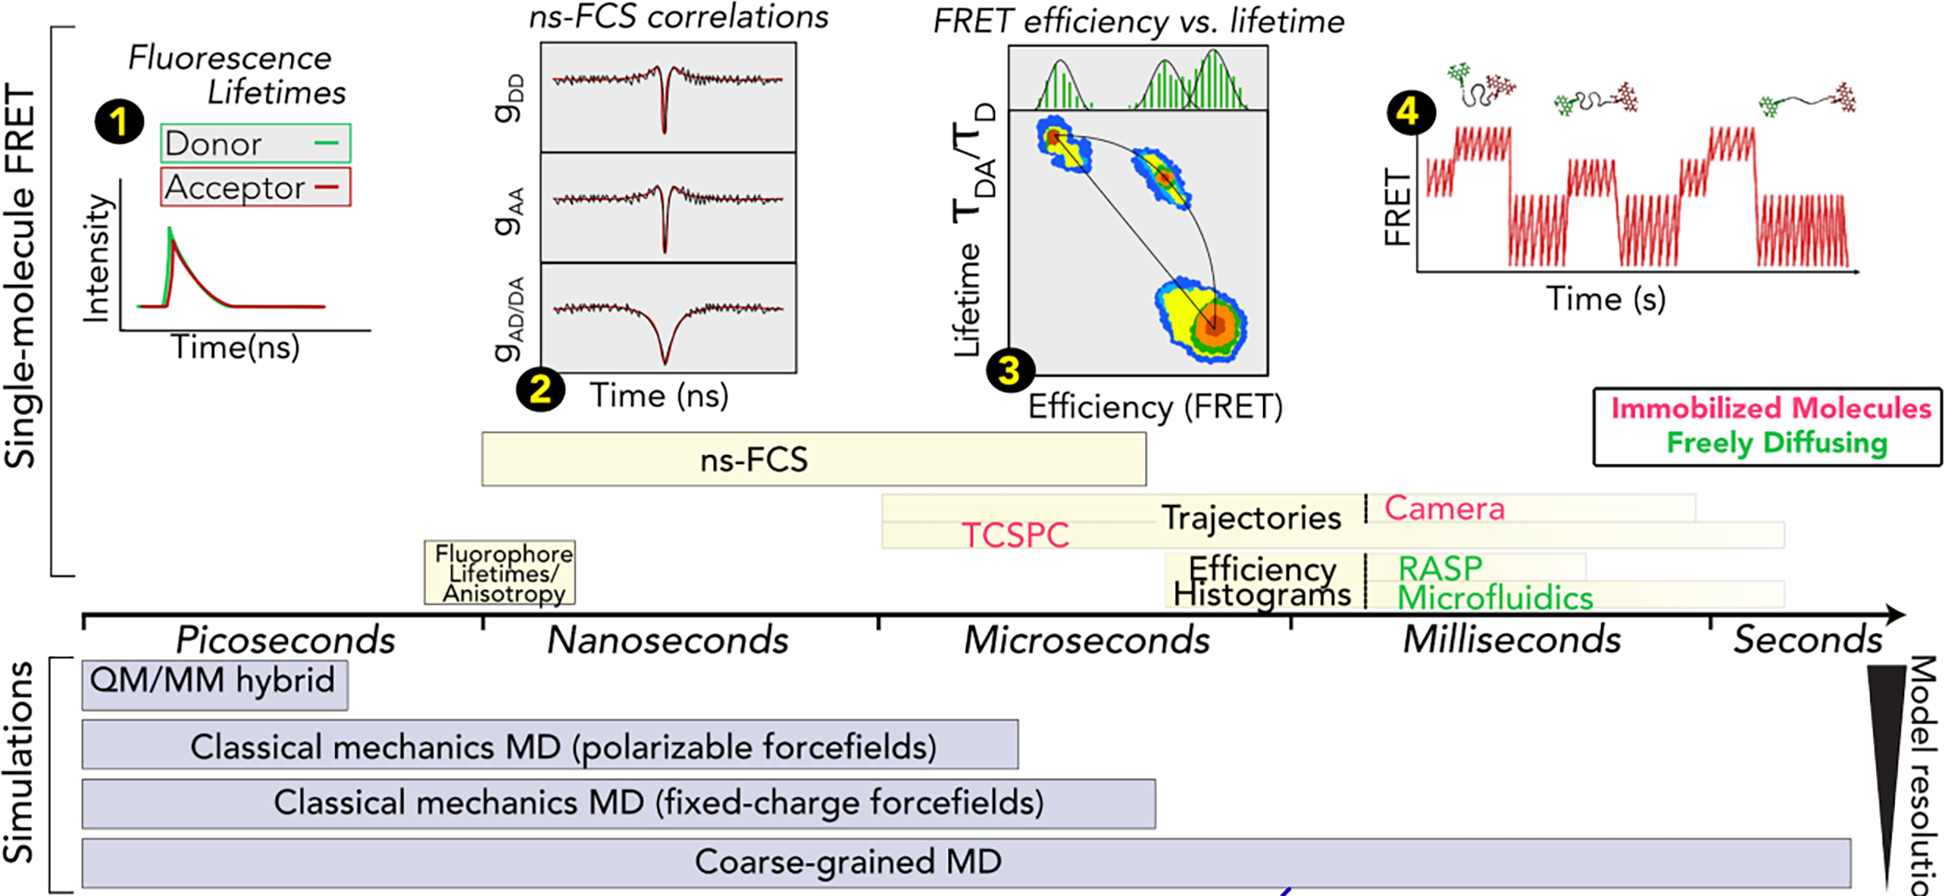
Figure 5. Experiments and simulations inform over a broad range of timescales.

Schematic detailing the different timescales accessible to single-molecule fluorescence spectroscopy and simulations. (1) Time-resolved fluorescence provides access to donor and acceptor lifetimes (which are influenced by the FRET process) and to anisotropies (which reports about tumbling of the dyes and of the overall molecule. (2) The correlate decay in the donor (DD) and acceptor (AA) autocorrelations as well as the anticorrelated rise in the donor-acceptor (AD/DA) cross-correlation reports about protein dynamics. (3) 2D-histogram of donor lifetime in the presence of the acceptor (normalized by the donor lifetime in the absence of the acceptor) vs. transfer efficiency. The diagonal line represents the result for a static configuration of the protein and the curved line represents dynamics exchange in the protein conformational ensemble. (4) Transfer efficiency trajectory of immobilized molecules can reveal slow conformational changes of the protein up to minutes.
