Abstract
We report a case of spinal ependymoma with ZFTA‐YAP1 fusion, occurring in a 5‐year‐old boy who complained of back pain. It was high‐grade ependymoma, developed in the spinal cord at the level of T9‐12. Since ZFTA‐YAP1 fusion‐positive ependymoma has never been reported in the spinal cord, this case is exceptional and worth reporting because the anatomical location, genetics, and epigenetics are important parameters in the classification of the ependymal tumor. This is the first case of spinal ependymoma harboring ZFTA‐fusion to be diagnosed by NGS and Sanger studies to the best of our knowledge.
CONFLICT OF INTEREST
The authors have no conflicts of interest to declare.
AUTHOR CONTRIBUTIONS
Sung‐Hye Park designed and supervised the study. Jae Kyung Won and Sung‐Hye Park reviewed histologic slides, signed all pathological reports, and collected anonymized data for qualitative analysis. Ka Young Lim collected and analyzed clinical, radiological, and pathological data. Kwanghoon Lee performed a DNA methylation analysis. Ji Hoon Phi operated and treated the patients and provided clinical information. Hongseok Yun analyzed NGS data in the sequencing of a brain tumor‐targeted gene panel. Seung‐Hong Choi provided radiological information of the patients. The manuscript was written by Ka Young Lim and Sung‐Hye Park. All authors have reviewed and edited the final manuscript.
ETHICS APPROVAL AND CONSENT TO PARTICIPATE
The institutional review board of our hospital approved this study (IRB No: 2012‐034‐1179) and has therefore been performed in accordance with the ethical standards set out in the 1964 Declaration of Helsinki and its subsequent amendments. As this study is a retrospective review of anonymized electronic medical records, pathology, and NGS data utilizing a brain tumor‐specific somatic gene panel, informed consent was waived from our IRB under the Korean Bioethics and Safety Act.
Ependymoma (EPN) is the third most common pediatric central nervous system tumor, accounting for 6%–12% of pediatric brain tumors [1]. EPNs arise throughout the entire neuraxis, including the supratentorial (ST) region, posterior fossa (PF), and spinal cord (SP). In 2020, the cIMPACT working committee 2 considered a scheme based on molecularly defined subtypes of EPN combined with anatomical sites [2]. Advanced molecular analyses classified EPNs into at least 10 types including spinal EPNs with MYCN amplification [3] and proved that ST, PF, and SP‐EPNs are genetically and epigenetically different diseases [4]. In the supratentorial region, two frequent genetic alterations characterize the molecular subgroups: zinc finger translocation‐associated gene (ZFTA, previous gene name: C11orf95)‐fusion and Yes1‐Associated Transcriptional regulator (YAP1)‐fusion [5]. The former has poor outcomes, whereas the latter has indolent behavior. Specifically, ZFTA‐fusion accounts for over 70% of pediatric ST‐EPNs. The biological mechanism of ZFTA fusion‐positive ST‐EPN (ST‐EPN‐ZFTA) has been studied to develop a targeted treatment [6]. ZFTA partners with various coactivators, including RELA (NFkB), MAML2, MAML3, NCOA1, NCOA2, and CTNNA2 [7, 8]. Although ZFTA fusion‐positive EPN occurs mainly in the supratentorial region, one ZFTA‐RELA fusion‐positive EPN in the cerebellum and one ZFTA‐MAML2 fusion‐positive EPN in the cervical junction have been reported [9]. Although the exact role of ZFTA is unknown, ZFTA‐fusion appears to induce expression of transcripts through aberrant transcription factors, binding, and remodeling chromatin [10]. YAP1 gene fusion is oncogenic and its common fusion partners are MAMLD1, FAM118B, TFE3, SS18, or ZFTA [11, 12]. YAP1 is a major transcriptional coactivator that regulates tissue homeostasis, cell fate, and proliferation and exerts pro‐oncogenic functions, such as proliferative transcription programs, primarily driven by interactions with the TEAD (Transcriptional enhancer factor TEF‐1 also known as TEA domain) transcription factor family [12].
A 5‐year‐old boy, who was previously healthy presented with progressive back pain. Spine magnetic resonance imaging (MRI) revealed approximately 4.9 cm intramedullary solid and cystic lesions involving the T9–T12 level with adjacent spinal cord edema. Brain MRI did not reveal an intracranial tumor or abnormal lesion (Figure 1). The tumor was located in the central area of the spinal cord, with a well‐defined enhancing margin. In addition, a slightly prominent enhancement along with the distal spinal cord surface was suggestive of leptomeningeal seeding. Laminoplasty and gross total removal of the intramedullary tumor were performed. The tumor recurred 8 months after the surgery. Gross total resection of the recurrent tumor with postoperative proton therapy (3960cGy+ boost 900cGy) was given. At the last follow‐up 5 months after the last surgery, there were only nocturia and slight urinary incontinence.
FIGURE 1.
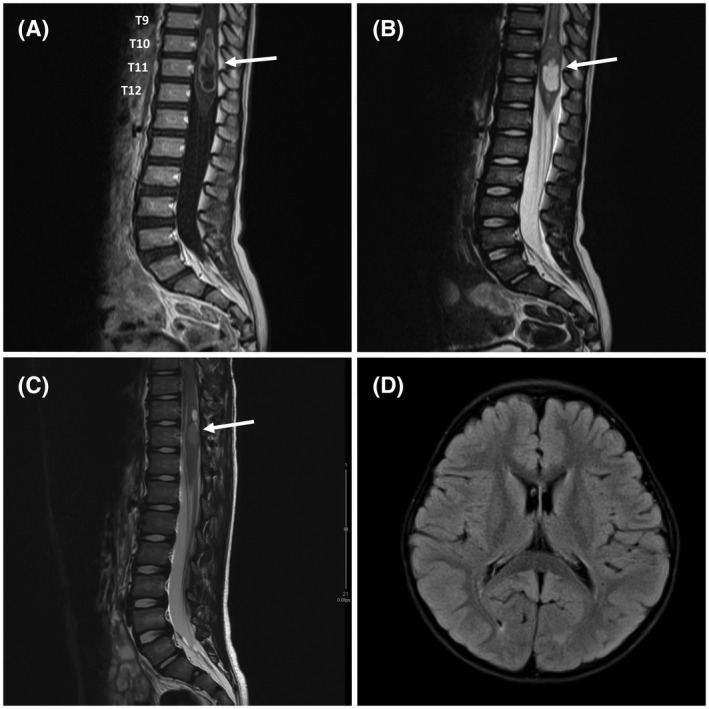
MRI findings of spinal ependymoma–ZFTA‐YAP1 fusion. (A) Sagittal contrast‐enhanced T1WI shows a centrally located tumor (arrow) with well‐defined avid enhancing margin and central cystic or necrotic portion, which has prominent proximal spinal cord edema. Slightly prominent enhancement along with the distal spinal cord surface was also identified, which is suspicious for the leptomeningeal seeding. (B) Sagittal T2WI shows a solid and cystic lesion (arrow) involving the spinal cord at the level of T9–T12. The radiological impression was ependymoma versus astrocytoma. (C) The recurrent tumor was a 1.4 cm hyperintense intramedullary lesion (arrow) at the T11 level of the spinal cord on sagittal T2WI. (D) Axial T2 FLAIR image of the brain shows no remarkable lesions
Histopathologically, primary and recurrent tumors presented conventional histology of ependymoma with increased cellularity, perivascular pseudorosettes, microvascular proliferation, and necrosis (Figure 2). Immunohistochemical examination revealed that the tumor cell was positive for L1CAM and YAP1 (Figure 2).
FIGURE 2.
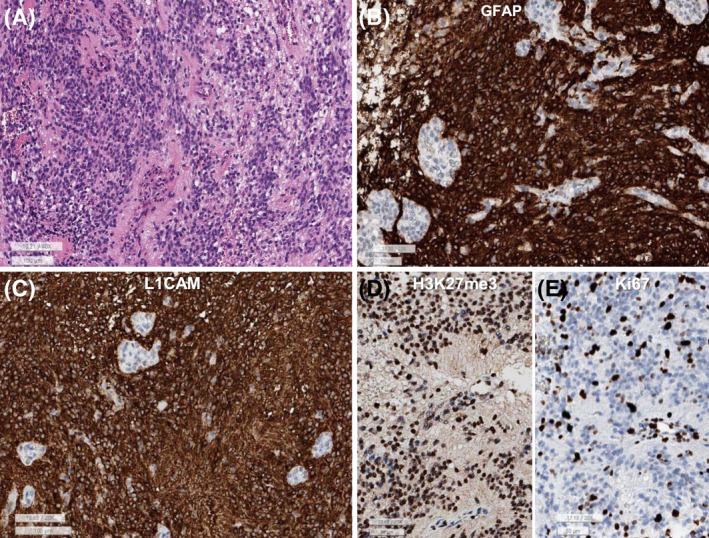
(A) This spinal ependymoma–ZFTA‐YAP1 fusion is composed of sheets of monotonous small round to oval cells with perivascular pseudorosettes and microvascular proliferation. (B) GFAP is diffusely positive in the tumor cells except for endothelial cells of the glomeruloid microvascular proliferation. (C) L1CAM is robust positive in the cytoplasm and membrane of tumor cells. (D) H3K27me3 shows retained expression. (E) Ki‐67 labeling index is high (32.4%) (A: H&E, B: GFAP, C: L1CAM, D: H3K27me3, E: Ki‐67, lower bar sizes: A and C: 100 μm, B, D, and E: 50 μm)
The Ki‐67 labeling index was 32.4% in the initial tumor and 10.4% in the recurrent tumor. H3K27me3 levels did not show any loss. K27M was negative. P16 loss and EZHIP overexpression were not observed.
Both DNA‐ and RNA‐based NGS studies with the customized gene panel (we call “FiRST [Friendly integrated Research‐based Smart Trustworthy”] brain tumor panel), which was approved by the Korea Ministry of Food and Drug Safety, detected the ZFTA‐YAP1 fusion in the brain tumor‐associated gene panel. The ZFTA‐YAP1 fusion was obtained from DNA gene panel sequencing, which was present in cytobands 11q13.1 (exon 2) and 11q22.1 (exon 5). We use the Arriba fusion analysis tool [13, 14]: DNA fusion analysis in DNA sequencing data with FiRST brain tumor panel revealed 20 and 20 split reads in in ZFTA and YAP1, respectively in primary EPN (Figure S1) and 28 and 28 split reads in ZFTA and YAP1 in recurrent EPN (Figure S2). RNA fusion analysis by NGS with FiRST brain tumor panel revealed 305 and 307 split reads in ZFTA and YAP1 respectively in the recurrent EPN (Figure 3), which was reconfirmed by the Sanger sequencing using the forward and backward primer sets (F: TCAAGGTGAGCACCATCAAG, R: GATGCTGAGCTGTGGGTGTA) (Figure 3). The method of Sanger sequencing and additional results are described in Supporting File S1. The final diagnosis was SP‐EPN‐ZFTA‐YAP1 fusion‐positive, WHO grade 3.
FIGURE 3.
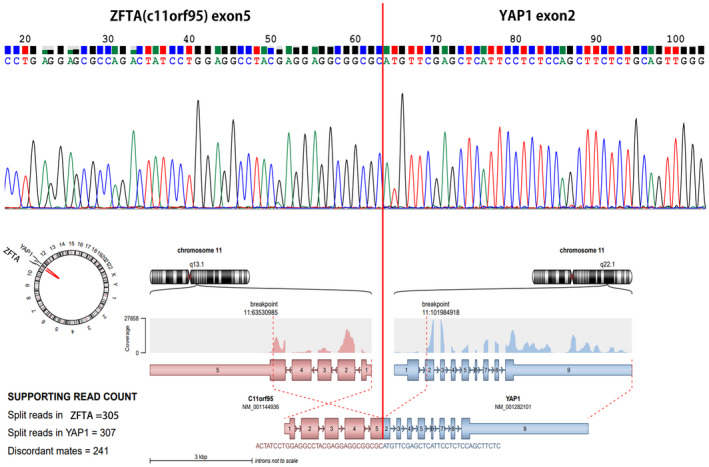
ZFTA‐YAP1 fusion was confirmed by Sanger sequencing using primer set (forward: TCAAGGTGAGCACCATCAAG, backward: GATGCTGAGCTGTGGGTGTA) (upper figure). RNA was extracted from the tumor and converted to complementary DNA (c‐DNA) via reverse transcription‐polymerase chain reaction. ZFTA‐YAP1 RNA fusion plot (lower figure) obtained from the recurrent ependymoma of this patient by NGS study with FiRST brain tumor gene panel
No MYCN amplification was found in NGS with above‐mentioned First brain tumor gene panel, copy number analysis with methyl 850K array chip (Figure S3), and FISH study using Vysis dual‐color LSI probes (N‐MYC [2p24] SpectrumGreen/CEP 2 SpectrumOrange probe).
DNA methylation array analysis was performed in this SP‐EPN using the Infinium MethylationEpic 850K BeadChip array. DNA methylation data analysis was performed using the methylationArrayAnalysis package (version 1.14.0) for R programming (R 4.0.3) [15]. Our sample was analyzed together with a reference cohort of 2801 samples from 91 classes [1]. The 10,000 most variably methylated probes were selected to perform unsupervised nonlinear dimension reduction. The resulting distance matrix was used as the input for t‐distributed stochastic neighbor embedding analysis (t‐SNE; Rtsne package version 0.15). The nondefault parameters were is distance = TRUE, perplexity = 20, and θ = 0.5. Only ependymal tumor clusters were colored on the t‐SNE plot for effective visualization using the ggplot2 package (version 3.3.3). IDAT files were uploaded to either version 11b2 or 11b4 of the online CNS tumor methylation classifier (https://www.molecularneuropathology.org). DNA methylation analysis [16] showed that ZFTA‐YAP1 fusion‐positive SP‐EPN of SNUH (Seoul National University Hospital case) clustered with ST‐EPN‐ZFTA (Figure 4).
FIGURE 4.
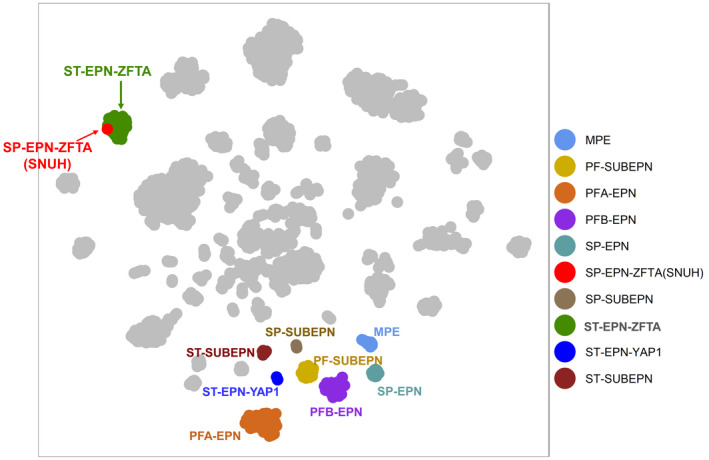
Unsupervised t‐SNE analysis with an overlay on the known ependymal tumor clusters from DKFZ data shows our SP‐EPN–ZFTA (SNUH: presenting case) is belong to the clusters of ST‐EPN–ZFTA fusion‐positive, but apart from the clusters of the SP‐EPN. MPE, myxopapillary ependymoma; PFA‐EPN, posterior fossa group A ependymoma; PFB‐EPN, posterior fossa group B ependymoma; PF‐SUBEPN, posterior fossa‐subependymoma; PN, ependymoma; SP‐EPN, spinal‐ependymoma; SP‐SUBEPN, spinal subependymoma; ST‐EPN‐ZFTA, supratentorial‐ependymoma ZFTA fusion‐positive; ST‐SUBEPN, supratentorial subependymoma; YAP1‐EPN, ST‐ependymoma YAP1‐positive
Our case might be the first case of SP‐EPN harboring a ZFTA‐YAP1 fusion. Unsupervised t‐SNE analysis with an overlay on the known ependymal tumor clusters revealed that our case belonged to ST‐EPN‐RELA (now the same as ZFTA‐fusion‐positive ST‐EPN), not SP‐EPN. Therefore, our case is the first case of ST‐type EPN occurring in the spinal cord. Similar to ST‐EPNs‐ZFTA, this case showed aggressive features with local recurrence within a short time (8 months) after the operation. Both radiological and histopathologic findings suggested a high grade. Initial MRI showed suspicious leptomeningeal seeding. Most importantly, the DNA methylation profile and biological behavior of this case were similar to those of ST‐EPN‐ZFTA, although it was developed in the spinal cord. Our case is a tumor that breaks the dogma that regards ependymoma as a significantly different tumor according to its anatomical loci [4]. The biomechanism of ZFTA‐fusion needs to be determined to realize the goal of targeted therapy. This goal is crucial for EPNs, which are resistant to chemotherapy with maximal surgical resection and radiation therapy as the currently available treatment options.
Supporting information
FIGURE S1 The DNA fusion plot of NGS obtained from the initial ependymoma with DNA gene panel, analysis by Arriba tool. C11orf95: previous gene name of ZFTA
FIGURE S2 The DNA fusion plot of NGS, obtained from the recurrent ependymoma with DNA gene panel, analysis by the Arriba tool. C11orf95: previous gene name of ZFTA
FIGURE S3 Copy number analysis with Illumina Epic 850K array chip revealed no significant copy number aberration, which was obtained by the online CNS tumor methylation classifier (https://www.molecularneuropathology.org). Therefore, no MYCN amplification was present
ACKNOWLEDGMENTS
This study was supported by a grant from the Korea Health Technology R&D Project through the Korea Health Industry Development Institute (KHIDI), funded by the Ministry of Health & Welfare, Republic of Korea (grant number: HI14C1277).
DATA AVAILABILITY STATEMENT
The datasets used and/or analyzed during the current study are available from the corresponding author on reasonable request.
REFERENCES
- 1. Cacciotti C, Fleming A, Ramaswamy V. Advances in the molecular classification of pediatric brain tumors: a guide to the galaxy. J Pathol. 2020;251(3):249–61. [DOI] [PubMed] [Google Scholar]
- 2. Ellison DW, Aldape KD, Capper D, Fouladi M, Gilbert MR, Gilbertson RJ, et al. cIMPACT‐NOW update 7: advancing the molecular classification of ependymal tumors. Brain Pathol. 2020;30(5):863–6. [DOI] [PMC free article] [PubMed] [Google Scholar]
- 3. Ghasemi DR, Sill M, Okonechnikov K, Korshunov A, Yip S, Schutz PW, et al. MYCN amplification drives an aggressive form of spinal ependymoma. Acta Neuropathol. 2019;138(6):1075–89. [DOI] [PMC free article] [PubMed] [Google Scholar]
- 4. Pajtler KW, Witt H, Sill M, Jones DT, Hovestadt V, Kratochwil F, et al. Molecular classification of ependymal tumors across all CNS compartments, histopathological grades, and age groups. Cancer Cell. 2015;27(5):728–43. [DOI] [PMC free article] [PubMed] [Google Scholar]
- 5. Pietsch T, Wohlers I, Goschzik T, Dreschmann V, Denkhaus D, Dorner E, et al. Supratentorial ependymomas of childhood carry C11orf95‐RELA fusions leading to pathological activation of the NF‐kappaB signaling pathway. Acta Neuropathol. 2014;127(4):609–11. [DOI] [PubMed] [Google Scholar]
- 6. Wang J, Wang L, Fu L, Li QC, Qiu XS, Wang EH, et al. Supratentorial ependymoma with YAP1:FAM118B fusion: a case report. Neuropathology. 2021;41:133–8. [DOI] [PubMed] [Google Scholar]
- 7. Lillard JC, Venable GT, Khan NR, Tatevossian RG, Dalton J, Vaughn BN, et al. Pediatric supratentorial ependymoma: surgical, clinical, and molecular analysis. Neurosurgery. 2019;85(1):41–9. [DOI] [PubMed] [Google Scholar]
- 8. Zschernack V, Jünger ST, Mynarek M, Rutkowski S, Garre ML, Ebinger M, et al. Supratentorial ependymoma in childhood: more than just RELA or YAP. Acta Neuropathol. 2021;141(3):455–66. [DOI] [PMC free article] [PubMed] [Google Scholar]
- 9. Keenan C, Graham RT, Harreld JH, Lucas JT Jr, Finkelstein D, Wheeler D, et al. Infratentorial C11orf95‐fused gliomas share histologic, immunophenotypic, and molecular characteristics of supratentorial RELA‐fused ependymoma. Acta Neuropathol. 2020;140(6):963–5. [DOI] [PMC free article] [PubMed] [Google Scholar]
- 10. Kupp R, Ruff L, Terranova S, Nathan E, Ballereau S, Stark R, et al. ZFTA‐translocations constitute ependymoma chromatin remodeling and transcription factors. Cancer Discov. 2021;11(9):2216–29. 10.1158/2159-8290.CD-20-1052 [DOI] [PMC free article] [PubMed] [Google Scholar]
- 11. Ozawa T, Arora S, Szulzewsky F, Juric‐Sekhar G, Miyajima Y, Bolouri H, et al. A de novo mouse model of C11orf95‐RELA fusion‐driven ependymoma identifies driver functions in addition to NF‐kappaB. Cell Rep. 2018;23(13):3787–97. [DOI] [PMC free article] [PubMed] [Google Scholar]
- 12. Szulzewsky F, Arora S, Hoellerbauer P, King C, Nathan E, Chan M, et al. Comparison of tumor‐associated YAP1 fusions identifies a recurrent set of functions critical for oncogenesis. Genes Dev. 2020;34(15–16):1051–64. [DOI] [PMC free article] [PubMed] [Google Scholar]
- 13. Arriba US. Fast and accurate gene fusion detection from RNA‐Seq data 2019. 2019. Available from: https://github.com/suhrig/arriba [Google Scholar]
- 14. Haas BJ, Dobin A, Li B, Stransky N, Pochet N, Regev A. Accuracy assessment of fusion transcript detection via read‐mapping and de novo fusion transcript assembly‐based methods. Genome Biol. 2019;20(1):213. Available from: https://www.ncbi.nlm.nih.gov/pubmed/31639029 [DOI] [PMC free article] [PubMed] [Google Scholar]
- 15. Maksimovic J, Phipson B, Oshlack A. A cross‐package bioconductor workflow for analysing methylation array data. F1000Res. 2016;5:1281. [DOI] [PMC free article] [PubMed] [Google Scholar]
- 16. Capper D, Jones DTW, Sill M, Hovestadt V, Schrimpf D, Sturm D, et al. DNA methylation‐based classification of central nervous system tumours. Nature. 2018;555(7697):469–74. [DOI] [PMC free article] [PubMed] [Google Scholar]
Associated Data
This section collects any data citations, data availability statements, or supplementary materials included in this article.
Supplementary Materials
FIGURE S1 The DNA fusion plot of NGS obtained from the initial ependymoma with DNA gene panel, analysis by Arriba tool. C11orf95: previous gene name of ZFTA
FIGURE S2 The DNA fusion plot of NGS, obtained from the recurrent ependymoma with DNA gene panel, analysis by the Arriba tool. C11orf95: previous gene name of ZFTA
FIGURE S3 Copy number analysis with Illumina Epic 850K array chip revealed no significant copy number aberration, which was obtained by the online CNS tumor methylation classifier (https://www.molecularneuropathology.org). Therefore, no MYCN amplification was present
Data Availability Statement
The datasets used and/or analyzed during the current study are available from the corresponding author on reasonable request.


