Abstract
Gram stain is one of the most common techniques used to visualize bacteria under microscopy and classify bacteria into two large groups (Gram-positive and Gram-negative). However, such an inaccurate classification is unfavorable for bacterial research. For instance, soil-rhizosphere bacteria, Bacillus megaterium (B. megaterium) and Bacillus cereus (B. cereus) have different effects on plants, nonetheless, they are both Gram-positive and difficult to be differentiated. Here, we present a method to precisely classify Gram-positive bacteria via hyperspectral microscopy. The pH-value differences in the intracellular environment of various types of bacteria can lead to different ionization of the auxochrome of crystal violet (CV) molecules during the Gram stain process. Consequently, there is a subtle difference in the absorption peak of Gram-stained bacteria. Harnessing hyperspectral microscopy can capture this subtle difference and enable precise classification. Besides the spectral features, the spatial features were also used to improve the quality of bacterial identification. The results show that the classification accuracy of two species of Gram-positive bacteria, B. megaterium and B. cereus, is up to 98.06%. We believe this method can be used for other Gram-positive bacteria and Gram-negative bacteria, realizing a more elaborate classification for Gram-stained bacteria.
1. Introduction
Gram stain is a microbial staining technique that was first devised by Hans Christian Gram in 1884 [1]. This stain method utilizes the principle of electrostatic interaction between dye and microorganism to realize staining and has the advantages of a simple staining procedure and high staining efficiency [2]. Conventional Gram stain involves the following four steps [3]: primary stain, mordant, decolorization, and counterstain. This method of staining differentiates bacteria into two large groups [4]. One group of bacteria forms a strong electrostatic bond with the dye and is stained purple in the primary stain, while another group of bacteria forms a weak electrostatic bond with the dye, thereby dye-losing after decolorization, following which they are stained pink in the counterstain. Those stained purple are Gram-positive bacteria with the pH values ranging from 1.75 to 4.15, while those stained pink are Gram-negative bacteria with the pH values ranging from 2.07 to 3.65 [5–7]. Therefore, bacteria can be classified as Gram-positive or Gram-negative according to their colors. However, this method is relatively inaccurate and is unfavorable for the subdivision of bacterial species. For instance, both B. megaterium and B. cereus in the soil can be isolated from the roots of plants [8,9]. However, they cannot be classified via Gram stain because these two species of bacteria are Gram-positive and have a similar morphology. Because these two species of bacteria have different effects on plants [10–13], we expect that they can be labeled specifically by staining. Considering that Gram stain is currently one of the most common staining techniques for making bacteria visible [14], its effectiveness will be further enhanced if bacteria can be classified more precisely through Gram stain.
The pH value of the intracellular environment of bacteria affects the electrostatic interaction, thereby affecting the effect of Gram stain [15]. In fact, the slight difference in pH values causes different ionization of the auxochrome of crystal violet (CV) molecules during the Gram stain process, leading to a slight difference in the staining effect [16]. This difference can be used to realize a more precise classification of Gram-stained bacteria. Considering that this slight staining difference is difficult to observe with naked eye or ordinary color cameras, hyperspectral microscopy has been employed in the present study. Hyperspectral microscopic imaging (HMI) is a non-destructive, non-contact, and advanced detection technology [17] that can simultaneously obtain two-dimensional morphological characteristics and one-dimensional spectral characteristics of target objects and form a three-dimensional hyperspectral data cube [18]. At present, HMI technology has been widely used in the identification and analysis in biologies, such as classification of fungi [19,20], detection of nerve fibers [21], identification of microalgae [22], and location or detection of cancerous tissues/cells [23–26]. Because the optical microscope is restricted by the diffraction limit, for small-sized bacteria, the difference between them cannot be observed from the morphology. The HMI technology makes it possible to identify bacteria. In 2013, HMI was used with a k-nearest neighbor (k-NN) classifier to detect and classify non-O157 Shiga toxin–producing Escherichia coli (STEC) serogroups [27]. In 2015, HMI combined with principal component analysis (PCA) was used for the early and rapid identification of Salmonella serotypes [28]. In 2020, HMI coupled with deep learning (DL) frameworks was proposed for the rapid classification of foodborne pathogenic bacteria [29]. In particular, HMI accompanied by a support vector machine (SVM) classifier has already been used for the classification of Gram-stained bacteria [30]. However, they merely used HMI to identify bacteria as Gram-negative or Gram-positive and did not conduct in-depth research on the spectral differences of bacteria that could be either negative or positive.
In this study, we propose a precise classification method for Gram-stained bacteria that can be employed to classify two species of Gram-positive bacteria (B. megaterium and B. cereus). The results show that the transmission spectra of these two species of Gram-stained bacteria are different. By combining the linear discriminant analysis (LDA) algorithm, an accurate classification of these two species of bacteria can be achieved (accuracy 98.06%).
2. System and samples
2.1. Experiment equipment and image acquisition
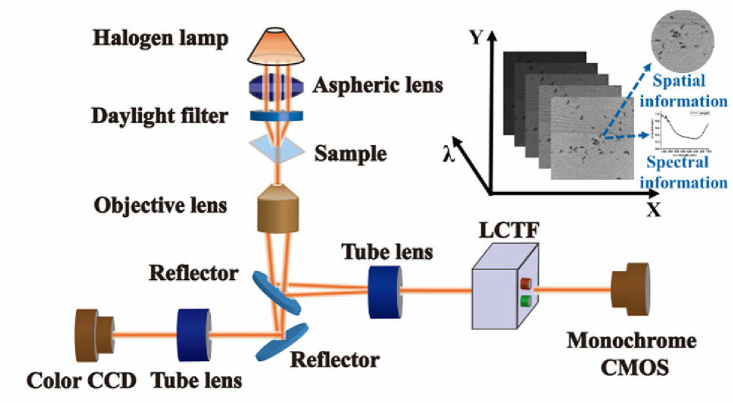
The HMI system used in this experiment is illustrated in Fig. 1. The core components include a halogen lamp with a temperature-color-balancing daylight filter for 3200 K, an infinity-corrected microscope objective (Nikon, Plan Fluor, 150×, N.A. = 0.90), a liquid-crystal tunable filter (LCTF, CRI Inc., VariSpec VIS, Connecticut City, United States) used for narrow-band filtering with a spectral range of 420–720 nm, a 16-bit complementary metal-oxide-semiconductor (CMOS, ORCA-Flash 4.0 LT C11440-42U, Hamamatsu City, Japan) camera with a pixel size of 6.5µm × 6.5µm, and a color charge-coupled device (CCD, Mshot, MC20-C) camera. When the broadband light from the halogen lamp reaches the bacterial sample, one part of it is absorbed, while the other part that passes through the sample is filtered by the LCTF and is subsequently imaged by the CMOS camera. By scanning the slide samples, a series of single-band 512×512 grayscale images that constitute a hyperspectral data cube are obtained. The inset illustrates the three-dimensional information of the sample.
Fig. 1.
Hyperspectral microscopic imaging system and hyperspectral data cube. Inset illustrates the acquisition of spatial and spectral information.
2.2. Experimental samples
The bacterial suspension was provided by the Beijing Beina Chuanglian Biotechnology Institute. The sample preparation steps are as follows. A liquid tube containing 5–10 mL of liquid medium (nutrient broth) was prepared, and 0.5 mL of liquid medium was poured into a lyophilized tube containing bacteria. After approximately 1 min, the liquid medium was completely mixed with the lyophilized powder, and subsequently they were added into the liquid tube and mixed evenly. The bacteria were thereafter cultivated for 3 days in a water-bath thermostatic oscillator at 37 °C (140r/min). Finally, the bacteria were inactivated for 15 min in a high-temperature pressure cooker at 121 °C and 0.25 MPa.
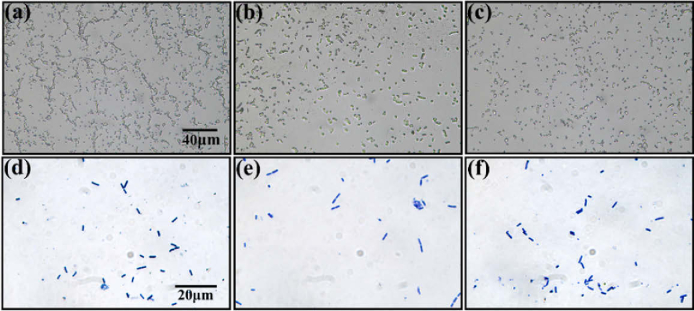
After inactivation, the samples were sent to BersinBio Technology Co., Ltd for Gram staining. First, for the pure sample, the bacteria were directly heat-fixed on slides, while for the mixed samples, two species of pure bacteria were dissolved in 1 mL of phosphate buffer saline (PBS) solution individually; thereafter, 0.5 mL of each were mixed and the mixed bacteria were eventually heat-fixed on slides. Second, we visually selected slides with a low density of bacteria to avoid the influence of the bacterial overlap. For example, the density of bacteria (more than 1000 bacteria in the field of view) on the slide shown in Fig. 2(a) is extremely high for our study, while the density of bacteria (less than 1000 bacteria in the field of view) on the slides shown in Fig. 2(b) and Fig. 2(c) is moderate and appropriate for our study. Finally, all the selected slides were stained by the classical Gram stain method: primary stain with CV solution for 1 min, mordant with iodine-potassium iodide solution for 1 min, decoloring with 95% alcohol for 25 s, counterstain with safranin solution for 1 min, and finally sealing the piece with neutral gum. In this experiment, we prepared 10 slides of B. megaterium, 10 slides of B. cereus, and 10 slides of the bacterial mixture. Because the samples were all Gram-positive bacteria, they were stained purple.
Fig. 2.
The microscopic images of unstained and Gram-stained bacteria. (a) and (d) are B. megaterium, while (b) and (e) are B. cereus. (c) and (f) are the mixtures of B. megaterium and B. cereus. (d)–(f) are taken by the color CCD camera.
3. Method and results
3.1. Transmission spectra acquisition and analysis
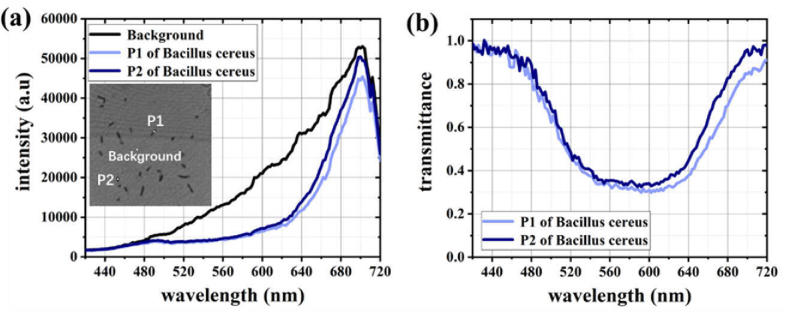
To investigate the staining differences between these two species of bacteria, we obtained the transmission spectra of these samples via hyperspectral microscopy. The scanning spectral range, scanning step size, and exposure time were set at 420–720 nm, 2 nm, and 60 ms, respectively. Figure 3(a) shows the intensity information of the spectra, and the inset is a grayscale image illustrating the target points (bacteria) and background point. The transmittance of a target point in the field of view (FOV) at a certain wavelength is defined by Eq. (1).
| (1) |
where T(λ) represents the transmittance of a target point, and λ represents a certain wavelength. The intensities of the target and background points are represented by I(λ) bacteria and I(λ) background , respectively. The transmission spectrum for the target point was obtained by calculating the transmittance for each wavelength. For example, we acquired the transmission spectra of two target points (P1 and P2 in Fig. 3(a)), as shown in Fig. 3(b).
Fig. 3.
Acquisition and processing of spectra. (a) is the intensity spectrum of samples. Inset is a grayscale image showing the target points (for example, P1 and P2) and background point (for example, Background). (b) is the transmission spectrum of the target points.
The average transmission spectra of these two species of bacteria based on 680 groups of spectral data (340 groups from each species) are shown in Fig. 4. One can see that there is a slight difference in the absorption peaks between B. megaterium and B. cereus. Specifically, the absorption peak of B. megaterium is 592 nm and that of B. cereus is 638 nm.
Fig. 4.
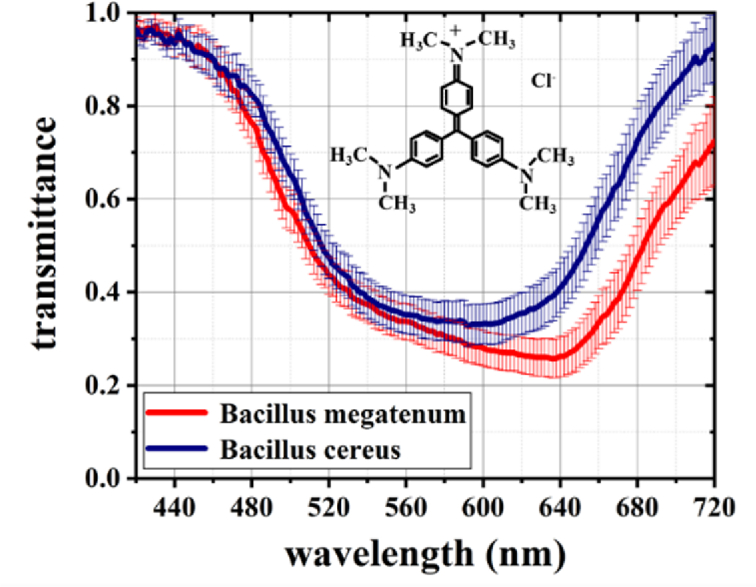
Average spectra of B. megaterium and B. cereus. The error bars on the spectra represent the transmittance difference between the different target points at the same wavelength. The inset is a schematic illustrating the chemical structure of CV.
Because they are Gram-positive bacteria, their staining color is dependent on the primary stain. In this step, the samples were stained with C25H30ClN3 (CV) solution. The CV solution was an alkaline stain. The inset in Fig. 4 shows a schematic of the chemical structure of CV. Triphenylmethane is a chromophore in CV, with an absorption peak at approximately 584 nm [31], based on the principle of complementary color light, triphenylmethane is purple, resulting in the purple staining of bacteria. -N(CH3)2 is an auxochrome in the CV that ionizes in water, generating a positive charge and can electrostatically combine with negatively charged substances (peptidoglycans) in the cell wall. This electrostatic binding between the dye and sample is affected by the pH of the intracellular environment. When the pH value is different, the strength of electrostatic binding is also different, therefore the staining effect of the sample is also different. According to the literature, the pH values of B. megaterium and B. cereus are 1.80 and 3.0, respectively [7]. Consequently, the difference in pH values between them leads to different ionization of the auxochromes that combine with bacteria. The pH of B. megaterium is relatively low, leading to the ionization effect of auxochromes obviously, and it has a stronger electrostatic interaction between B. megaterium and CV. This makes B. megaterium retain more CV after decolorization, and consequently, the red shift of the spectral absorption peak is more obvious. As a result, there was a slight difference in the color of the two species of bacteria after the process of primary stain.
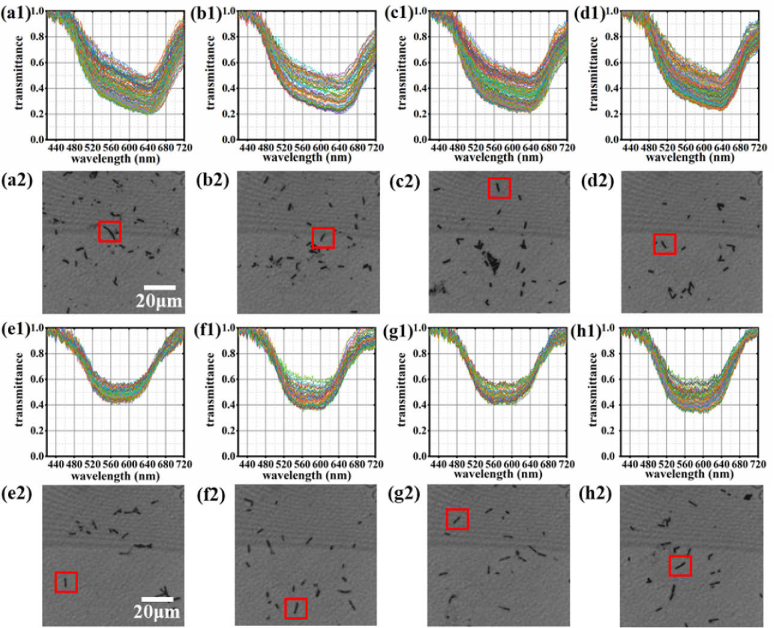
Moreover, we investigated the staining of each spot in a bacterium. Figure 5 shows the spectra of all pixels in a bacterium. It is observed that the spectrum of each spot in a certain bacterium maintains a consistent trend and the position of the absorption peak is stable. The high stability of the spectra enables the improvement of the identification accuracy of bacteria. Moreover, it reflects that the pH values of the bacteria are relatively uniform and stable.
Fig. 5.
Spectral information of several bacteria. (a1) shows the spectra of all pixels in a B. megaterium corresponding to the bacterium in the red box in (a2). (b1)–(d1) are also the spectra of the other three samples of B. megaterium corresponding to the bacteria in the red box in (b2), (c2) and (d2) respectively. (e1) shows the spectra of all pixels in a B. cereus corresponding to the bacterium in the red box in (e2). (f1)–(h1) are also the spectra of the other three B. cereus corresponding to the bacteria in the red box in (f2), (g2) and (h2) respectively.
3.2. Training and testing of the classification prediction model
Machine learning (ML) has been widely used to identify bacteria alongside HMI technology. Therefore, we also utilized ML to identify B. megaterium and B. cereus in our study and further compared and optimized several classification models of ML, such as the decision tree (DT), linear discriminant analysis (LDA), quadratic discriminant analysis (QDA), support vector machine (SVM), naive Bayes (NB), and k-nearest neighbor (k-NN). We obtained two hyperspectral cubes from each pure sample slide, and they were used to extract the original data for training and testing. 35 groups of spectra were extracted from each cube. Therefore, a total of 700 groups of spectra for each kind of bacteria were extracted from 20 pure sample slides. The training set was composed of 340 groups of standard spectra of B. megaterium and 340 groups of standard spectra of B. cereus, and we also used this dataset as a validation set to evaluate different machine learning models. The classification accuracy (ACC), sensitivity (SEN) and specificity (SPEC) of the ML models were calculated in this experiment. ACC is an overall evaluation. SEN is a measure of the proportion of positives identified correctly in all positives, and SPEC is a measure of the proportion of negatives identified correctly in all negatives. In this study, the B. megaterium is the positive samples. These parameters are defined by the formula (2)-(4).
| (2) |
| (3) |
| (4) |
where Nture represents the number of samples identified to be correct and Ntotal represents the total number of samples. TP and TN present the number of true positives and the number of true negatives, while FN and FP present the number of false negatives and the number of false positives, respectively. Corresponding calculation results of each model are shown in Table 1.
Table 1. Classification accuracy of the ML models.
| Model | DT | LDA | QDA | SVM | NB | k-NN |
|---|---|---|---|---|---|---|
| Accuracy (%) | 97.2 | 100 | 99.9 | 99.9 | 95.3 | 99.6 |
| Sensitivity (%) | 97.1 | 100 | 99.7 | 99.7 | 92.9 | 99.1 |
| Specificity (%) | 97.4 | 100 | 100 | 100 | 97.6 | 100 |
According to Table 1, the ACC, SEN and SPEC of the LDA model reach 100%. Therefore, we selected the LDA model for the classification. The test set was composed of 360 groups of standard spectra of B. megaterium and 360 groups of standard spectra of B. cereus. Moreover, there was no overlap between the test set and the training set. Based on the LDA model, we obtained the classification results for this set of data, as shown in Table 2.
Table 2. Classification results obtained using the LDA model based on transmission spectra.
| Predict |
|||
|---|---|---|---|
| B. megaterium | B. cereus | ||
| Actual | B. megaterium | 357 | 3 |
|
| |||
| B. cereus | 11 | 349 | |
Table 2 shows the confusion matrix after cross-testing. Based on the confusion matrix, the sensitivity of B. megaterium and the specificity of B. cereus were calculated to be 99.17%, 96.94%, respectively. Besides, it can be observed that the number of samples identified to be correct is 706, while the number of samples identified to be incorrect is 14, and the total number of both samples is 720. The identification accuracy is up to 98.06%. First, this demonstrates that the spectral characteristics and the difference between the two spectra are stable, owing to the stability of the intracellular pH values of the two species of bacteria. Second, this proves the effectiveness of this method.
3.3. Automatic classification of bacteria
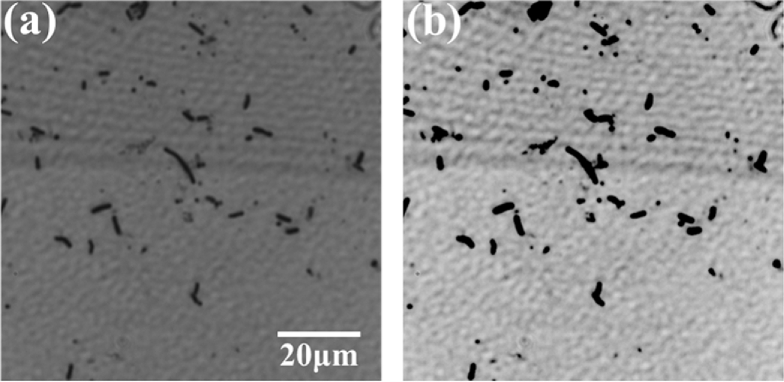
In the identification of the entire image, only the pixels associated with bacteria are needed to be identified. Therefore, we used a binary algorithm to separate target pixels from the background for saving computation and reducing errors. To achieve effective binarization, it was necessary to select an image with a high contrast between the target points and the background. Because the contrast of the spectral image at a wavelength of 628 nm was the highest in all spectral images, it was chosen to be binarized. It was also required to enhance the contrast of the chosen image before binarization. In this study, we selected a minimum gray threshold (Low_In) and a maximum gray threshold (High_In) in the image at 628 nm (Fig. 6(a)). The values between Low_In and High_In were mapped to values between 0 and 1. Values below Low_In and above High_In were clipped. That is, the values below Low_In were mapped to 0 and those above High_In were mapped to 1. Through this method, a contrast-enhanced image was obtained, as shown in Fig. 6(b).
Fig. 6.
Process of contrast enhancement of image. (a) is an original image at 628 nm and (b) is a contrast-enhanced image.
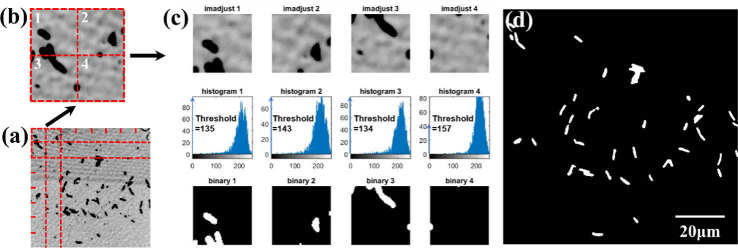
After enhancing the image contrast, the image segmentation method was employed for binarization. The entire image (Fig. 7(a)) was divided into 8 × 8 tiny squares, and Fig. 7(b) shows four of them. The adaptive threshold of each small square was obtained from the gray histogram, as shown in the middle row of Fig. 7(c). This threshold was applied to the binarization of the corresponding small square. If the gray values of the points were lower than this threshold, they were labeled as 1 (targets). If the gray values of the points were higher than this threshold, they were labeled as 0 (background). A binary image is presented in Fig. 7(d). In the classification process, the points labeled as 0 were directly defined as the background, therefore it was not necessary to identify them employing the LDA model.
Fig. 7.
The process of module binarization. (a) is a contrast-enhanced image for image segmentation. (b) are the 4 small images divided from (a). (c) shows each small image and the corresponding gray histogram, and the threshold is obtained from the gray histogram to binarize the image. (d) is a binary image after image segmentation.
Further, we introduced the connected-domain algorithm to mark each bacterium as a connected domain. The LDA model was employed to identify all pixels in each connected domain; if more than half of all target pixels in a certain connected domain was identified as a certain species, then this connected domain (corresponding cell) was identified as this species of bacteria. Figure 8 shows the identification process of the mixed samples of the two bacterial species. The classification results based on the transmission spectra are shown in Fig. 8(d), where B. megaterium and B. cereus are labeled in red and green, respectively.
Fig. 8.
The process of automatic identification of mixed bacteria in FOV. (a) is an original image at 628 nm. (b) is an image of contrast-enhanced. (c) is a binary image. (d) is a pseudo-color image after classification. B. megaterium and B. cereus are labeled in red and green, respectively.
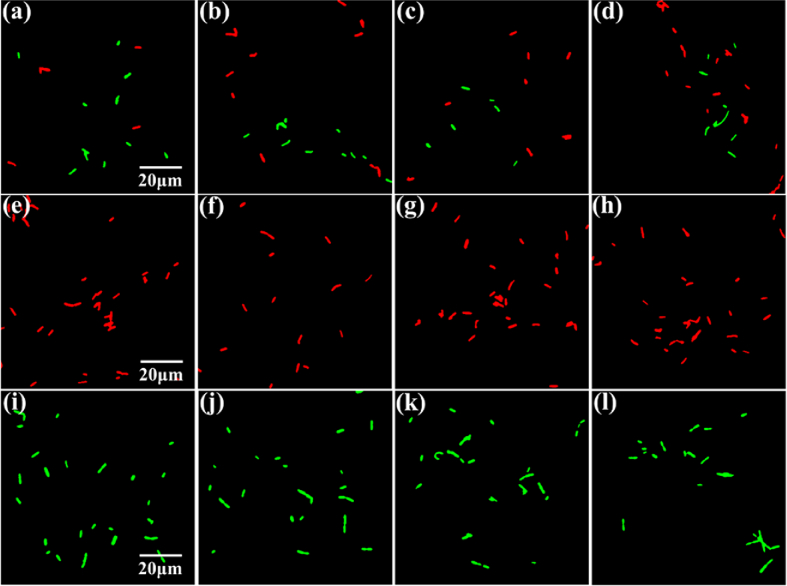
Figure 9(a)–(d) shows the entire image identification effect of the mixed sample in other FOVs. Since both of them are Gram-positive bacteria, it is difficult to distinguish these two kinds of bacteria by conventional microscope and the naked eye. However, the pseudo-color image based on the identification of spectra of them can help us to distinguish these two kinds of bacteria intuitively in the field of view. In addition, to observe the identification effect of the image more intuitively, the slides with only pure species of bacteria were identified, as shown in Fig. 9(e)–(i). One can see that the identification results can be displayed intuitively on the pseudo-color images; the distribution of bacteria in the images can be observed, and the identification result of pure bacteria is highly accurate. Therefore, the proposed method can accurately identify these two Gram-stained positive bacteria, irrespective of it being pure bacteria or a mixture of bacteria. As long as there is a difference in the pH of the two species of bacteria, even if the difference is subtle, an appropriate identification result can be obtained using the HMI system.
Fig. 9.
Automatic identification of pure and mixed bacteria in other FOVs which are independent of training and test set. (a)–(d) are mixed bacteria. B. megaterium is labeled in red, while B. cereus is labeled in green. (e)–(h) are B. megaterium and (i)–(l) are B. cereus.
4. Conclusion
In this study, HMI technology is first used to classify Gram-stained B. megaterium and B. cereus. Although they are both Gram-positive and morphologically similar, a slight difference in the transmission spectrum between them can still be observed. This is because of the difference in acidity and alkalinity of these two species of bacteria that results in a different structure of CV after ionization, causing a color (transmission spectra) difference between them. Based on this, an HMI system that can simultaneously obtain spectral information and spatial information of a sample can be used to identify the two species of bacteria. Combined with the LDA algorithm, the identification accuracy is as high as 98.06%. Moreover, the spatial features were also used to enhance the quality of the identification of the entire image and enable the visualization of the identification results in the field of views. We believe that this method can classify various kinds of Gram-stained bacteria precisely, especially using hyperspectral images with a wide spectral range from visible to near-infrared. It expands the function of Gram-stain and provides a novel approach for the species-identification or subspecies-identification of bacteria.
Funding
National Natural Science Foundation of China10.13039/501100001809 (61935010, 61975069); Guangzhou Science and Technology Project (201903010042, 201904010294); Guangdong Project of Science and Technology Grants (2018B030323017); Key-Area Research and Development Program of Guangdong Province (2020B090922006).
Disclosures
The authors declare no conflicts of interest.
Data availability
Data underlying the results presented in this paper are not publicly available at this time but may be obtained from the authors upon reasonable request.
References
- 1.Gram H. C., “Über die isolierte Färbung der Schizomyceten in Schnitt-und Trockenpräparaten,” Fortschr. Med. 2, 185–189 (1884). [Google Scholar]
- 2.Smith A. C., Hussey M. A., “Gram stain protocols,” As. Med. 1, 14 (2005). [Google Scholar]
- 3.Bartholomew J. W., Mittwer T., “The Gram stain,” Bacteriol. Rev. 16(1), 1–29 (1952). 10.1128/br.16.1.1-29.1952 [DOI] [PMC free article] [PubMed] [Google Scholar]
- 4.Wilhelm M. J., Sheffield J. B., Sharifian Gh M., Wu Y., Spahr C., Gonella G., Xu B., Dai H. L., “Gram’s stain does not cross the bacterial cytoplasmic membrane,” ACS Chem. Biol. 10(7), 1711–1717 (2015). 10.1021/acschembio.5b00042 [DOI] [PubMed] [Google Scholar]
- 5.Beveridge T. J., “Use of the Gram stain in microbiology,” Biotech. Histochem. 76(3), 111–118 (2001). 10.1080/bih.76.3.111.118 [DOI] [PubMed] [Google Scholar]
- 6.Moyes R. B., Reynolds J., Breakwell D. P., “Differential staining of bacteria: Gram stain,” Curr. Protoc. Microbiol. 15(1), 8 (2009). 10.1002/9780471729259.mca03cs15 [DOI] [PubMed] [Google Scholar]
- 7.Harden V. P., Harris J. O., “The isoelectric point of bacterial cells,” J. Bacteriol. 65(2), 198–202 (1953). 10.1128/jb.65.2.198-202.1953 [DOI] [PMC free article] [PubMed] [Google Scholar]
- 8.Kulpreecha S., Boonruangthavorn A., Meksiriporn B., Thongchul N., “Inexpensive fed-batch cultivation for high poly (3-hydroxybutyrate) production by a new isolate of Bacillus megaterium,” J. Biosci. Bioeng. 107(3), 240–245 (2009). 10.1016/j.jbiosc.2008.10.006 [DOI] [PubMed] [Google Scholar]
- 9.Jensen L. B., Baloda S., Boye M., Aarestrup F. M., “Antimicrobial resistance among Pseudomonas spp and the Bacillus cereus group isolated from Danish agricultural soil,” Environ. Int. 26(7-8), 581–587 (2001). 10.1016/S0160-4120(01)00045-9 [DOI] [PubMed] [Google Scholar]
- 10.Martín L., Prieto M. A., Cortés E., García J. L., “Cloning and sequencing of the pac gene encoding the penicillin G acylase of Bacillus megaterium ATCC 14945,” FEMS Microbiol. Lett. 125(2-3), 287–292 (1995). 10.1016/0378-1097(94)00510-X [DOI] [PubMed] [Google Scholar]
- 11.Ortíz-Castro R., Valencia-Cantero E., López-Bucio J., “Plant growth promotion by Bacillus megaterium involves cytokinin signaling,” Plant Signaling Behav. 3(4), 263–265 (2008). 10.4161/psb.3.4.5204 [DOI] [PMC free article] [PubMed] [Google Scholar]
- 12.Guinebretière M. H., Broussolle V., Nguyen-The C., “Enterotoxigenic profiles of food-poisoning and food-borne Bacillus cereus strains,” J. Clin. Microbiol. 40(8), 3053–3056 (2002). 10.1128/JCM.40.8.3053-3056.2002 [DOI] [PMC free article] [PubMed] [Google Scholar]
- 13.Schoeni J. L., Wong A. C., “Bacillus cereus food poisoning and its toxins,” J. Food Prot. 68(3), 636–648 (2005). 10.4315/0362-028X-68.3.636 [DOI] [PubMed] [Google Scholar]
- 14.Coico R., “Gram staining,” Curr. Protoc. Microbiol. 1, A. 3C. 1–A. 3C. 2 (2005). [DOI] [PubMed] [Google Scholar]
- 15.Adams E., “The antibacterial action of crystal violet,” J. Pharm. Pharmacol. 19(12), 821–826 (2011). 10.1111/j.2042-7158.1967.tb09550.x [DOI] [PubMed] [Google Scholar]
- 16.Saeed A., Sharif M., Iqbal M., “Application potential of grapefruit peel as dye sorbent: kinetics, equilibrium and mechanism of crystal violet adsorption,” J. Hazard. Mater. 179(1-3), 564–572 (2010). 10.1016/j.jhazmat.2010.03.041 [DOI] [PubMed] [Google Scholar]
- 17.Cancio L. C., Batchinsky A. I., Mansfield J. R., Panasyuk S., Hetz K., Martini D., Jordan B. S., Tracey B., Freeman J. E., “Hyperspectral imaging: a new approach to the diagnosis of hemorrhagic shock,” J. Trauma 60(5), 1087–1095 (2006). 10.1097/01.ta.0000217357.10617.3d [DOI] [PubMed] [Google Scholar]
- 18.Lu G., Fei B., “Medical hyperspectral imaging: a review,” J. Biomed. Opt. 19(1), 010901 (2014). 10.1117/1.JBO.19.1.010901 [DOI] [PMC free article] [PubMed] [Google Scholar]
- 19.Lu Y., Wang W., Huang M., Ni X., Chu X., Li C., “Evaluation and classification of five cereal fungi on culture medium using Visible/Near-Infrared (Vis/NIR) hyperspectral imaging,” Infrared Phys. Technol. 105, 103206 (2020). 10.1016/j.infrared.2020.103206 [DOI] [Google Scholar]
- 20.Yao H., Hruska Z., Kincaid R., Brown R. L., Bhatnagar D., Cleveland T. E., “Detecting maize inoculated with toxigenic and atoxigenic fungal strains with fluorescence hyperspectral imagery,” Biosyst. Eng. 115(2), 125–135 (2013). 10.1016/j.biosystemseng.2013.03.006 [DOI] [Google Scholar]
- 21.Li Q., Wang Y., Liu H., Chen Z., “Nerve fibers identification based on molecular hyperspectral imaging technology,” IEEE Int. Conf. Comp. Sci. Auto. Eng. (CSAE) 3, 15–17 (2012). [Google Scholar]
- 22.Shao Y. N., Pan J., Jiang L. L., He Y., “Microalgae species identification study with Raman microspectroscopy technology,” Spectrosc. Spectral Anal. 35(7), 1908–1911 (2015). [PubMed] [Google Scholar]
- 23.Ortega S., Halicek M., Fabelo H., Guerra R., Lopez C., Lejeune M., Godtliebsen F., Callico G. M., Fei B., “Hyperspectral imaging and deep learning for the detection of breast cancer cells in digitized histological images,” Medical Imaging 2020: Digital Pathology. International Society for Optics and Photonics 11320, 30 (2020). 10.1117/12.2548609 [DOI] [PMC free article] [PubMed] [Google Scholar]
- 24.Siddiqi A. M., Li H., Faruque F., Williams W., Lai K., Hughson M., Bigler S., Beach J., Johnson W., “Use of hyperspectral imaging to distinguish normal, precancerous, and cancerous cells,” Cancer 114(1), 13–21 (2008). 10.1002/cncr.23286 [DOI] [PubMed] [Google Scholar]
- 25.Kiyotoki S., Nishikawa J., Okamoto T., Hamabe K., Saito M., Goto A., Fujita Y., Hamamoto Y., Takeuchi Y., Satori S., Sakaida I., “New method for detection of gastric cancer by hyperspectral imaging: a pilot study,” J. Biomed. Opt. 18(2), 026010 (2013). 10.1117/1.JBO.18.2.026010 [DOI] [PubMed] [Google Scholar]
- 26.Uhr J. W., Huebschman M. L., Frenkel E. P., Lane N. L., Ashfaq R., Liu H., Rana D. R., Cheng L., Lin A. T., Hughes G. A., Zhang X. J., Garner H. R., “Molecular profiling of individual tumor cells by hyperspectral microscopic imaging,” Transl. Res. 159(5), 366–375 (2012). 10.1016/j.trsl.2011.08.003 [DOI] [PMC free article] [PubMed] [Google Scholar]
- 27.Windham W. R., Yoon S. C., Ladely S. R., Haley J. A., Heitschmidt J. W., Lawrence K. C., Park B., Narrang N., Cray W. C., “Detection by hyperspectral imaging of Shiga toxin–producing Escherichia coli serogroups O26, O45, O103, O111, O121, and O145 on Rainbow agar,” J. Food Prot. 76(7), 1129–1136 (2013). 10.4315/0362-028X.JFP-12-497 [DOI] [PubMed] [Google Scholar]
- 28.Eady M., Park B., Choi S., “Rapid and early detection of Salmonella serotypes with hyperspectral microscopy and multivariate data analysis,” J. Food Prot. 78(4), 668–674 (2015). 10.4315/0362-028X.JFP-14-366 [DOI] [PubMed] [Google Scholar]
- 29.Kang R., Park B., Eady M., Ouyang Q., Chen K., “Single-cell classification of foodborne pathogens using hyperspectral microscope imaging coupled with deep learning frameworks,” Sens. Actuators, B 309, 127789 (2020). 10.1016/j.snb.2020.127789 [DOI] [Google Scholar]
- 30.Park B., Seo Y., Yoon Jr S. C., Hinton A., Windham W. R., Lawrence K. C., “Hyperspectral microscope imaging methods to classify gram-positive and gram-negative foodborne pathogenic bacteria,” Trans. ASABE 58(1), 5–16 (2015). 10.13031/trans.58.10832 [DOI] [Google Scholar]
- 31.Ahmad R., “Studies on adsorption of crystal violet dye from aqueous solution onto coniferous pinus bark powder (CPBP),” J. Hazard. Mater. 171(1-3), 767–773 (2009). 10.1016/j.jhazmat.2009.06.060 [DOI] [PubMed] [Google Scholar]
Associated Data
This section collects any data citations, data availability statements, or supplementary materials included in this article.
Data Availability Statement
Data underlying the results presented in this paper are not publicly available at this time but may be obtained from the authors upon reasonable request.


