Abstract
Nonlinear optical microscopy is a powerful label-free imaging technology, providing biochemical and structural information in living cells and tissues. A possible drawback is photodamage induced by high-power ultrashort laser pulses. Here we present an experimental study on thousands of HeLa cells, to characterize the damage induced by focused femtosecond near-infrared laser pulses as a function of laser power, scanning speed and exposure time, in both wide-field and point-scanning illumination configurations. Our data-driven approach offers an interpretation of the underlying damage mechanisms and provides a predictive model that estimates its probability and extension and a safety limit for the working conditions in nonlinear optical microscopy. In particular, we demonstrate that cells can withstand high temperatures for a short amount of time, while they die if exposed for longer times to mild temperatures. It is thus better to illuminate the samples with high irradiances: thanks to the nonlinear imaging mechanism, much stronger signals will be generated, enabling fast imaging and thus avoiding sample photodamage.
1. Introduction
Since its introduction [1], nonlinear optical microscopy has established itself as the tool of choice in many scientific fields, working in different modalities such as two-photon excited fluorescence, second/third harmonic generation and coherent Raman scattering. Also thanks to new laser sources that have become more and more compact, turn-key, stable, powerful and that generate ultrashort pulses with multi-wavelength outputs at high repetition rates, nonlinear optical microscopes are nowadays capable of directly imaging tissues and probing dynamic cellular processes in a label-free manner, reaching a remarkable spatial and temporal resolution [2,3]. The downside of these technological advances is the high-intensity illumination required, that can lead to phototoxicity. The general term phototoxicity includes all physical and chemical damaging processes that may arise during the interaction between light and biological organisms [4–6] and represents a serious limitation for in vivo biomedical imaging [7–9].
Phototoxic mechanisms can be induced by linear or nonlinear optical processes [10]. In the following, we present a brief overview of photodamage processes, starting from the linear mechanisms triggered at low light intensities and then describing the more destructive nonlinear mechanisms arising at higher and higher intensities. In laser physics, it is common to use the word intensity of radiant energy as the power transferred per unit area ( ). In this manuscript, adhering to the language used in photometry, we will use the term irradiance to refer to the average laser intensity. Linear photodamage is mainly caused by sample heating due to laser irradiation [11], namely photothermal damage, but it may also be associated with photochemical damage [12]. This occurs in particular in pigmented molecules and pigment-rich tissues, such as skin [13–15], which may directly absorb light via single-photon transitions, especially when using visible or UV instead of near-infrared (NIR) radiation, even in the continuous-wave regime. Nonlinear photodamage mechanisms, induced by e.g. multiphoton absorption [16,17], arise using higher light intensities. The most common one is the photochemical damage correlated with the formation of reactive oxygen species (ROS) [18–20] and free radicals [21,22]. The formation of these toxic species is induced by nonlinear excitation of cellular and tissue absorbers, such as porphyrins, flavins and coenzymes as NAD(P)H. Under physiological conditions, cells have different mechanisms to cope with ROS production. However, when excess laser irradiation triggers ROS overproduction, not only cell components, such as proteins, lipids and DNA, begin to oxidize, but also redox homeostasis and cell cycle are disrupted [23]. Besides ROS production, cells may undergo direct DNA photodamage [22,24,25] and, if the irradiance is high enough, namely above for a NIR femtosecond beam, molecular ionization can lead to low-density plasma formation [21,26]. Lastly, when the plasma is no longer confined, optical breakdown occurs with immediate mechanical destructive effects for cells and tissues [27–30].
If the definition of phototoxic mechanisms is straightforward, quantifying phototoxicity during microscopy is a completely different ballgame [31]. In fact, photoxicity depends on many different factors, including sample type, specific sample sensitivity induced by experimental protocols and illumination parameters, both related to the experimental setup (continuous or pulsed source, illumination wavelength, irradiance, etc.) and to illumination protocols (imaging time, stationary or scanned beam, number of 3D planes measured, etc.) [29,32–35]. Assessing the short- and long-term detrimental effects of laser radiation on biological specimens is a non-trivial problem and various methods have been elaborated. Among these, we mention measuring photobleaching and irradiation-induced fluorescence [9,36] and many in vitro mechanism-specific tests to target ROS and free radicals production, DNA strands, changes in methabolic activity and in cell morphology, stress-related proteins, cloning efficiency and level of apoptosis [37–41]. Despite the large number of studies conducted in this area [4,5,31,42,43], there are still many things to understand in order to formulate a general theory of photodamage, due to the enormous variety of parameters and the inability to explore them all.
For reasons of consistency with our work, in the remainder of this introduction we will focus on studies on label-free cultured cells. Among the most relevant results, Nan and coworkers [44] presented the possibility to perform nonperturbative Coherent Anti-Stokes Raman Scattering (CARS) microscopy. They used two pulsed laser beams, pump and Stokes, respectively at 711 nm and 892 nm, with a pulse duration of 2 ps, and they explored the occurrence of linear and nonlinear damage upon variation of pulse energy and average power. They characterized linear damage using low pulse energy (<1 nJ) and high average power, finding the linear damage threshold for average power between 9 mW and 12 mW. On the other hand, for nonlinear damage, they applied high pulse energy (>1 nJ) and average power below 5 mW. After 300 s of scan (100 frames), for 1 MHz of repetition rate they set nonlinear damage threshold for pump pulse energy between 2 nJ and 3 nJ. Repeating the same experiment for 2 MHz of repetition rate, they set nonlinear damage threshold for pump pulse energy between 1.5 nJ and 2.3 nJ. In both cases, the pulse energy of the Stokes was kept constant at 0.5 nJ. Eventually, they identified 1.5 mW (8 MHz, 0.2 nJ) for the pump beam and 0.5 mW (8 MHz, 0.06 nJ) for the Stokes beam as safety condition for nonperturbative CARS microscopy imaging.
Also Fu and colleagues characterized photodamage in CARS microscopy [29], with the aim of producing a guideline to obtain high quality CARS images of biological samples avoiding photodamage. They analyzed the dependence of photodamage rate on excitation power, excitation wavelength, repetition rate. They also characterized the so called ’coherent Raman induced’ photodamage, i.e. the photodamage caused by vibrational absorption in the sample in the presence of Raman resonance. Their results on living cells, employing a pump beam at 704 nm and a Stokes beam at 808 nm, show that for a total average power of 9.24 mW (peak power of 373 W and 101 W for pump and Stokes respectively) cells reported severe damage after 1 minute of exposure. Decreasing the total average power to 2.3 mW (peak power of 92.3 W and 24 W for pump and Stokes respectively), no damage was reported, even after 10 minutes of exposure. In their work on wide-field CARS microscopy, Silve et al. [45] proved the possibility to acquire CARS images of living cells in suspension. For their experiments, they used a pump beam at 625 nm and a Stokes beam at 770 nm, with pulse duration of 4 ns and 3 ns, respectively and 10 Hz of repetition rate. In their configuration, they demonstrated that no damage occurred after exposing the cells to 3000 pulses, with pump and Stokes pulse energy of 1.2 mJ and 0.53 mJ, respectively. In their work on stimulated Raman scattering (SRS) microscopy [46], Freudiger and coworkers accurately optimized pulse parameters for biological samples. Changing pulse duration, they experimentally identified three average power damage thresholds: 25 mW at 180 fs pulses, 80 mW at 1 ps pulses and 280 mW at 6 ps pulses. From these data, they extracted an empirical equation to evaluate the maximum permissible total average power to avoid photodamage, considering a pump beam at 817 nm and a Stokes beam at 1064, and a 1.2 NA objective.
Finally, Waldchen and colleagues [47] presented an extensive work on photodamage of living cells, analyzing three different cell lines and designing ad-hoc experiments to investigate the influence of irradiance, wavelength, light-dose, fluorescence labeling, temperature and reducing agent on the viability of labeled and unlabeled cells. Their experiments clearly showed how shorter irradiation wavelengths cause more damage: exposing unstained cultured cells to cw irradiation for 240 s at the same irradiance, , the survival rate went from 0% to 100% changing the laser wavelength from 488 nm to 514 nm. At 640 nm, the irradiance can go up to , without causing any damage to the irradiated sample. In addition, they proved the insufficiency of the light dose alone to estimate the degree of photodamage.
Here we present an experimental study of photodamage induced by focused ultrashort (130-fs) laser pulses on HeLa cells, under two different illumination configurations and varying laser power, scanning speed and exposure time. The results are presented following a data-driven approach, offering an interpretation of the underlying damage mechanism and providing a predictive model for biologically safe imaging in the range of parameters explored. Analyzing the dependence of the damage on the applied laser power, we mainly obtained photothermal damage, and we confirmed this result also with thermodynamic considerations. From our experiments, we calculated the probability of damaging the sample as a function of the variables examined, and we identified a safety window that can be used for microscopy applications below the 5% damage probability.
2. Materials and methods
2.1. Cell culture, seeding and staining
For our experiments we used HeLa cells, a human cell line derived from cervical cancer cells, which are extensively employed in in-vitro phototoxicity experiments, and in particular in the field of laser microscopy, thanks to their availability, ease of cell manipulation and reproducibility of the results [47,48]. HeLa cells are cultured in Dulbecco’s modified Eagle’s medium (DMEM) supplemented with 10% fetal bovine serum, 1% L-glutamine (2 mM), penicillin (10 units/ml), and streptomycin ( ) at and in 5% atmosphere (Euroclone, Italy). The culture medium is changed every 2-3 days. Cells are seeded in gridded cell-culture Petri dishes (IBIDI, 35 mm -Dish Grid-500). The effective area available for the cell adhesion is . The cells are stored in the incubator until the 100 % confluence condition is reached, then they are ready to be used for our experiments. Just before laser exposure, the cell medium is replaced with a DMEM solution containing a live/dead cell double staining kit consisting of calcein-acetomethoxy (AM) (excitation at 473 nm, emission at 490-590 nm) and ethidium homodimer-1 (excitation at 559 nm, emission at 570-670 nm) (ThermoFisher Scientific, Italy), which are fluorescent dyes able to detect live and dead cells. In particular, the AM derivate of calcein is transported through the cellular membrane into live cells, thus colouring alive cells in green. On the other hand, the ethidium homodimer-1 is a membrane-impermeable fluorescent dye which binds to DNA, so that it enters only into dead cells, colouring them in red. We decided to insert the fluorescent probes before laser irradiation experiments and not after, as their addition requires performing some washing steps to remove the culture medium (DMEM), which often caused the detachment from the Petri dish of many cells that were damaged and stressed by the NIR pulsed illumination, thus inhibiting their count and evaluation. We note that we have not found any evidence in the literature that calcein-AM and ethidium homodimer probes may contribute to phototoxic damage. We have also experimentally verified this result, observing that, for those samples in which we managed to avoid cell detachment from the Petri dish, the damage extent in the two conditions (i.e. adding the fluorescent probes before or after irradiation) was the same.
2.2. Cell irradiation
The cells, stored in the incubator at and in 5% atmosphere, were quickly picked up and brought to the optics laboratory to be exposed to laser light. In the optics laboratory the temperature was kept at to minimize thermal gradients and reduce cell stress. Irradiation experiments were performed employing an ytterbium-doped fiber laser which uses a master oscillator power amplifier (MOPA) architecture (Fidelity HP, Coherent, USA). This laser source emits pulses at 1040 nm wavelength, with repetition rate of 80 MHz, transform-limited duration 130 fs, a negative group delay dispersion variable from 0 to and up to 18 W of output average power. Samples were placed in a home-built inverted microscope setup equipped with white-light Köhler illumination and a CCD camera with 1024x768 pixels (Thorcam, Thorlabs, Germany), with a field of view of 200x266 μ m2, employed to inspect the sample before the measurement and to put it in focus (by adjusting a linear translation stage along the z axis). To focus the laser beam on the sample, we employed two different optical systems: a lens with focal length for the experiments presented in Section 3, using a fixed and rather large ( radius, intended as half width at half maximum (HWHM)) illumination spot, and an objective (Melles Griot 10x, 0.25 NA) for the experiments presented in Section 4., based on raster scanning a smaller ( radius, intended as HWHM) illumination spot. We chose these two illumination configurations with large focal spots on the sample on purpose to avoid the problem related to the vertical position of the laser beam waist with respect to the cell plane. The thin ( ) glass bottom of the Petri dish often presents variations in thickness. Furthermore, due to strains or bending due to gravity, it is not perfectly flat. As a result, it is rather difficult to keep the laser focus on the cells while scanning the sample over large fields of view using a high-numerical aperture objective. Using a low-NA one and a lens with long depth of focus we avoided the problem, obtaining a very good reproducibility. For the latter experiments, in particular, we combined a fast galvanometric mirror (GVS311/M, Thorlabs, Germany) with a slower motorized translation stage (8MFT-75LS05 Standa, Lithuania), moving along two orthogonal directions. In order to prevent distortion phenomena like vignetting, a 4f-relay system was implemented between the galvanometric scanner and the focusing objective.
2.3. Confocal microscopy
After laser exposure, samples were imaged using a confocal microscope (Olympus Fluoview FV10i) equipped with four diode lasers (emission wavelengths 405, 473, 559, 635 nm), an integrated incubator, and with a 10x phase-contrast objective, 0.4 NA (image size 1.2x1.2 mm2). The pinhole was set to 2.5 Airy Unit. Two-colour images were acquired to detect live cells and dead cells. Images were analyzed with the open-source software ImageJ [49], counting live and damaged cells and measuring the extent of the damaged area.
3. Effect of fixed laser beam on cell viability
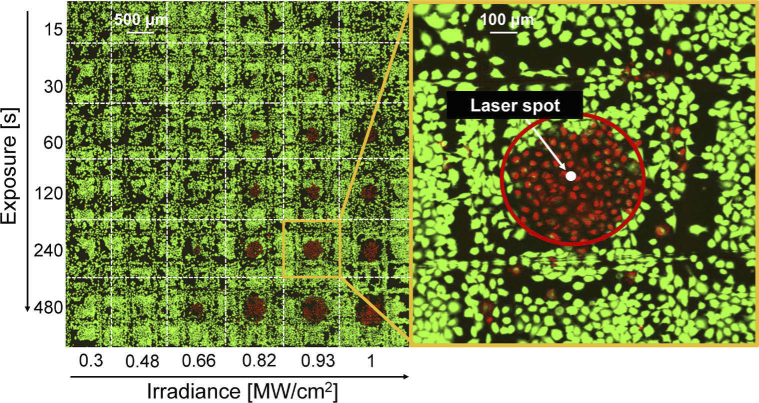
We performed a first set of experiments irradiating the sample with a fixed laser spot with radius (see the white spot in the inset of Fig. 1) and varying both the exposure time , which progressively doubled from 15 s up to a maximum exposure of 8 minutes, and the irradiance , from a minimum of 0.3 MW/cm2 to a maximum of 1 MW/cm2, over a 6x6 matrix of irradiated spots at 1-mm distance from each other. This translates into an average laser power between 2.26 W and 6.97 W, an energy per pulse between 28 nJ and 87 nJ and a peak power in the range of 217-670 kW. As shown in Fig. 1, the damage extends far beyond the area exposed to the laser radiation, so that the particular spatial profile of the laser spot on the sample does not play a significant role. For this reason, in analysis performed in section 3.1 and in section 3.2, we approximated the Gaussian spatial profile with a cylindrical one with the same peak value and with a diameter equal to the Gaussian FWHM. This approximation allows us to consider the irradiance as homogeneous within the laser spot. After laser irradiation, we performed a standard viability assay (as described in Section 2.1.) to determine the ability of cells to maintain a state of survival (see Fig. 1). We note that with this protocol, we are unable to detect any non-lethal damage, such as alteration in metabolism or reproductive behavior, or damage that could lead to delayed death.
Fig. 1.
Image, acquired with the confocal microscope, representative of the experiment. In green are visible alive cells stained with calcein-AM fluorescent dye, while in red dead cells stained with ethidium homodimer-1 fluorescent dye. The image shows the cell survival pattern obtained following a sample irradiation with different parameters of irradiance and exposure time. On the right, the detail of an actual irradiated area (the laser spot in white) and the damaged area.
We see that for short exposures and/or low irradiances no damage occurred. On the other hand, we note that the damaged areas for long exposure times and high irradiances (bottom-right corner) are considerably larger than the irradiated one, and their radius increases with irradiance and exposure time.
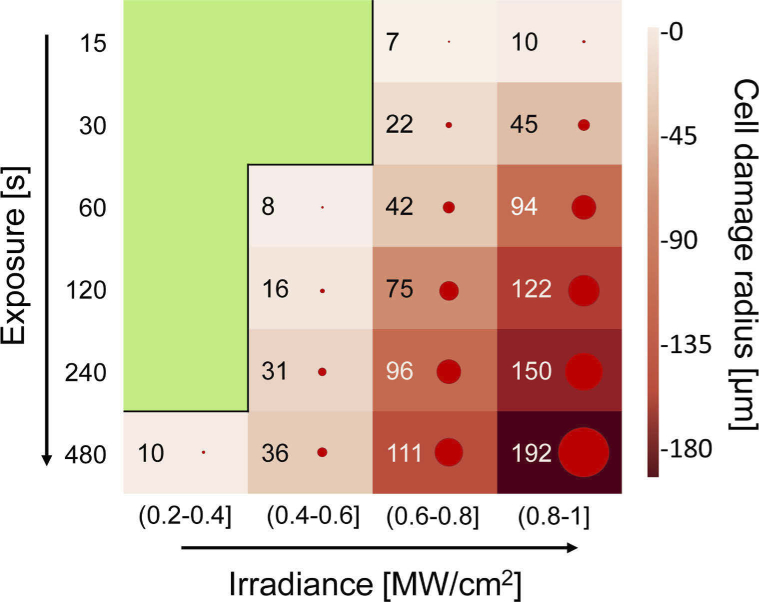
The experiment shown in Fig. 1 was then repeated on 13 different Petri dishes, for a total of 313 irradiated sample points, corresponding to several thousands of cells, that confirmed its very good reproducibility. The average results are summarized in Fig. 2, in which we grouped the irradiance values of the laser in four bins, each of equal width (0.2 MW/cm2). As already noted for the sample of Fig. 1, also for the average results no damage ever occurred for low irradiances and short exposure times (represented by the green area in Fig. 2). For higher irradiances and exposure times the damage radius increases up to an average value of hundreds of microns. Based on these observations, we first analyzed the data to determine the damage threshold as a dichotomous problem (Section 3.1). As a second step, we analyzed the subset of the damaged areas and their spatial extent, to find an empiric formula that links the radius of the circumference that encloses the dead cells to the irradiation parameters (Section 3.2).
Fig. 2.
Average radius of the damaged area for different irradiance ranges and exposure times. The green zone represents the safe zone in which no damage was detected. The red circles, whose numerical values indicate the radius, represent an indication of the damage extent.
3.1. Binary problem for estimating the damage probability
Now we characterize the damage phenomenon observed during the experiment by analyzing the data collected. Let Y be the binary variable that indicates whether or not damage has been observed on the sample irradiated by the laser (Y = 1 if cellular damage radius is greater than zero, Y = 0 otherwise). For this task, we used 301 experimental points out of 313 after outliers removal and we employed a logistic model [50], which is a sigmoidal function with monotonic increase from zero to one, commonly used in statistics as a cumulative distribution function. We computed the probability for the damage to occur as:
| (1) |
In this formula, is the mean, i.e. the position of the sigmoid’s midpoint for which Pr(Y = 1) = 50%, is the logistic growth rate or steepness of the curve, which is inversely proportional to the standard deviation, and the independent variable x depends on both the exposure time and the irradiance with two exponents and as follows:
| (2) |
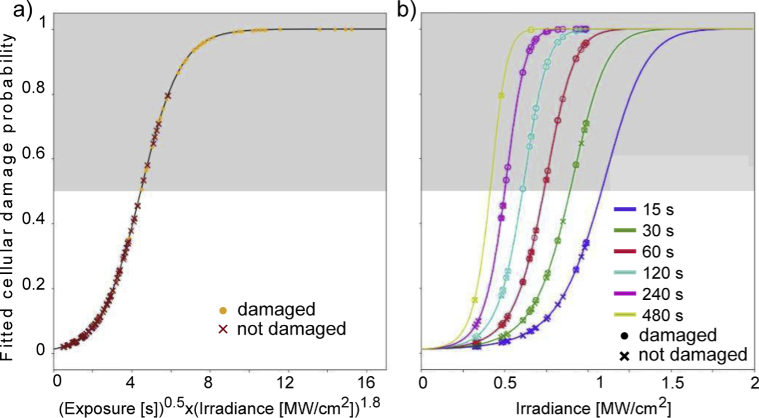
The implemented solution aims to identify the optimal values for the exponents and , together with the mean and the steepness , using the ordinary least squares (OLS) method. We iterated the fitting procedure using different combinations of and values (varying from -10 to +10 in increments of 0.1). Maximal accuracy of the prediction was found for , , resulting in and , as also reported in Table 1. The results of the fitting are shown in Fig. 3(a). The plot includes the regression line, which represents the regression equation related to the response variable written as the probability of a damage, and the experimental points. Figure 3(b) shows the same plot, but splitting the curves for different exposure times, for easier interpretation of the results.
Table 1. Optimal values obtained for coefficients and and exponents and , and accuracy, specificity and sensitivity of the model implemented.
| Coefficients | Exponents | Accuracy | Specificity | Sensitivity |
|---|---|---|---|---|
|
| ||||
Fig. 3.
a) Graphical representation of the damage probability curve depending on the applied irradiance and exposure times in sample points irradiated by a fixed laser. b) Graphical representation of the damage probability curves depending on the applied irradiance in sample points irradiated by a fixed laser for different exposure times.
Logistic regression can be considered as a supervised learning method belonging to the family of classification algorithms: to assign the result of the prediction to the class it belongs to (damage versus no damage), the estimated probability can be used directly as follows:
where 50% is the cut-off probability. To highlight these results, in Fig. 3 we plot the experimental data points using a circle for the damaged points and a cross for those not damaged. Along this line, we coloured the background of Fig. 3 in gray for the top semi-space in which damage is probably occurring (Pr(Y = 1) >= 50%). We see that most of the circles (damaged experimental points) lie in the top gray area, while most of the crosses (non-damaged experimental points) lie in the bottom one, indicating the goodness of the model. Overall, the model presents a very high specificity of (fraction of negative samples correctly identified as such) and a good sensitivity of (fraction of positive samples correctly identified as such).The results are also reported in Table 1.
We can summarize these results, providing a safety rule for the microscopists employing nonlinear optical microscopy to image HeLa cells using ultrashort pulses ( duration) in the near-infrared ( ) spectral region at high ( ) repetition rate. To stay on the safe side, one would like to limit the chances of damage to lower than 5%. Plugging this value into Eq. (1), we obtain x=1.475. Splitting this value using Eq. (2), we obtain the following Table 2, representing the safe working conditions. From the experimental point of view, no sample irradiated using x<=1.475 showed any damage, confirming the proper choice of the safety limit.
Table 2. Safety working conditions to keep the damage probability below 5% in fixed laser beam experiments and in our range of parameters.
| Exposure time | 1 second | 10 seconds | 1 minute | 10 minutes |
|---|---|---|---|---|
| Max irradiance | 1.241 MW/cm2 | 0.655 MW/cm2 | 0.398 MW/cm2 | 0.210 MW/cm2 |
3.2. Continuous problem for estimating the radius of cell damage
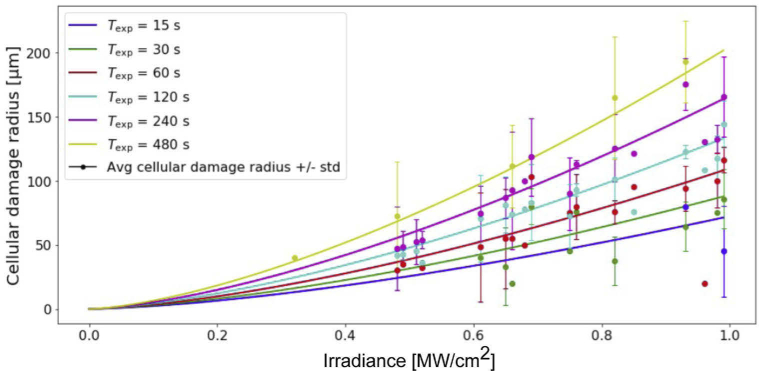
In this second part of the analysis, we provide an empirical formula to link the radius R of the damaged area, assumed to be circular, to the exposure time and the irradiance . To this aim, we limited our dataset to the 155 experimental points out of 313 in which damage occurred to some extent, i.e. after removing the outliers and the green areas in Fig. 2 irradiated with low intensity and for short exposure times. Figure 4 plots the average cellular damage radius R (circles) and its standard variation (error bars) as a function of the irradiance, for various exposure times, as indicated. We observe a nonlinear dependence of R on , so that we expect it to appear in the formula with an exponent larger than 1. On the contrary, we see that the exposure time must be increased by approximately one order of magnitude to double R for a given irradiance, so that we expect a rather mild dependence of the damage radius R on the exposure time , with an exponent smaller than 1. We employed a regression model of this form:
| (3) |
Fig. 4.
Graphical representation of the curves that describe the dimension of the cellular damage radius, depending on the applied irradiance, in sample points irradiated by a fixed laser for six exposure times.
We iterated the fitting procedure using different combinations of the exponents and (varied from -10 to +10 with steps of 0.1). Maximal accuracy of the prediction ( ), using the OLS method, was found for the values of the exponents and (see Table 3), close to the values obtained in the previous section ( , ).
Table 3. Optimal values obtained for coefficient and exponents and , that maximize the coefficient of determination ( value).
| Coefficient | Exponents | |
|---|---|---|
|
| ||
| 0.947 | ||
3.3. Heat generation and diffusion in the samples
We now investigate more in detail the type of damage itself. The observation that the damaged areas in the samples are larger than the region directly irradiated by the laser (Fig. 1), especially for long exposure times, suggests that the damage is spreading, causing the death of cells that have never been illuminated. Such behaviour can be explained in terms of the diffusion of the photoinduced heat. For this reason, in the following we consider photothermal phenomena, occurring when the main effect of the irradiation is the temperature increase.
Cells undergo thermal damage when they reach temperatures around [51]. Such high temperatures can lead to cell death or altered cell behaviour, like impaired cell reproduction [52]. In some cases, photothermal damage may be observed directly through effects such as coagulation, vaporization, carbonization and melting.
There are two main processes to consider when studying photothermal damage: heat generation and heat transport [53]. Neglecting scattering events, the former can be modelled considering that deposition of light energy in the sample follows its absorption, governed by Lambert-Beer’s law. In particular, for a Gaussian beam propagating in the -direction, the intensity within the medium is described by the following equation:
| (4) |
with the vertical coordinate, the standard deviation of the Gaussian-like profile in the radial direction (the radial coordinate being ) and the medium absorption coefficient. To model the experimental conditions, has been set to be the one corresponding to a full width at half maximum of , while absorption has been estimated by considering that in non-pigmented cells cultured in water-based media like DMEM, water constitutes the main light absorber. At our illumination wavelength ( ) the absorption coefficient of DMEM is [54], as set in our simulations. Eventually, regarding the intensity temporal profile , , despite the pulsed excitation used in experiments, the high laser repetition rate ( ) allows one to simulate it as a continuous source. The value for the average intensity , which in this manuscript we call irradiance, has then been expressed as the ratio , with the beam spot area and the average power of the train of pulses, each with energy .
As a result of light absorption, diffusive heat transport is induced. This can be described via a heat source with volume density promoting an increase of temperature across the illuminated medium. From Lambert-Beer’s intensity profile, this heat source is expressed as its derivative in the -direction, namely:
| (5) |
according to the same notation used above, with the Fresnel transmission factor at the air/water interface. The additional term has instead been included in order to account for the transverse spreading of the beam due to diffraction and it acts consistently with the confinement of the beam along the direction of propagation.
Following light absorption, we study heat diffusion by solving the Fourier transport equation using a finite-element method (FEM)-based model employing a commercial software (COMSOL Multiphysics 5.6). The thermal transport problem has been implemented following standard Fourier-like formalism, namely the equation below has been solved for the temperature field :
| (6) |
Here, , and are the density, heat capacity and thermal conductivity of the material, while is the aforementioned heat source. Values of the thermal parameters used in the simulations are referred to water after the study by Park et al. [55], and provided in Table 4. The heat transfer equation is solved across a two-dimensional axisymmetric domain, by virtue of the symmetry of the sample and light excitation. To reproduce the experimental conditions, the system has been studied by defining Infinite Element (IE) domains which surround the physical domain, to simulate an infinitely extended water environment, much larger than the cell region in the sample. Beyond IEs, temperature was fixed to its equilibrium initial value, .
Table 4. Optical and thermal properties of DMEM cell culture medium [56,57].
| Specific heat capacity (Cp) | 4186 (Jkg−1K−1) |
| Density (ρ) | 1000 (kgm−3) |
| Thermal conductivity (κ) | 0.6 (Wm−1K−1) |
| Absorption coefficient (α) | 0.2 (cm−1) |
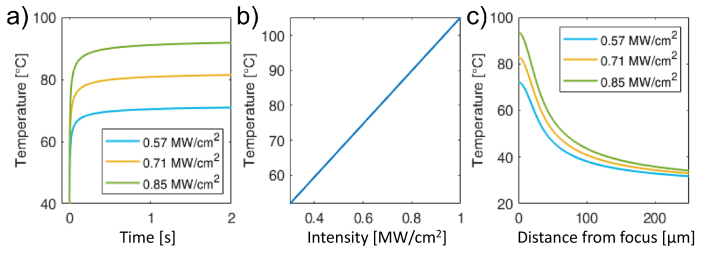
Figure 5(a) plots the calculated temperature, solution of Eq. (6) under the laser spot ( ) as a function of time, for different irradiances. We see that within a relatively short time ( ~500 ms, much shorter than our used exposure times) the peak temperature saturates, reaching an equilibrium value that is then maintained constant during the exposure time. As shown in Fig. 5(b), this peak temperature is linearly dependent on the irradiance and is simply the result of the dynamic equilibrium between the heat input generated by the laser absorption and its output due to diffusion. By analysing the spatial distribution of in the radial coordinate, within less than 2 seconds the thermodynamic equilibrium is reached outside the laser spot. The obtained temperature profile is displayed in Fig. 5(c) for three different irradiances across a region of radius.
Fig. 5.
a) Temperature increase on the sample over time at the coordinate of the laser focal spot ( ), calculated with Eq. (6), for 3 different irradiances. b) Peak temperature reached on the sample calculated using Eq. (6), as a function of irradiance. c) Evolution of the temperature profile in the Petri dish for three different irradiances.
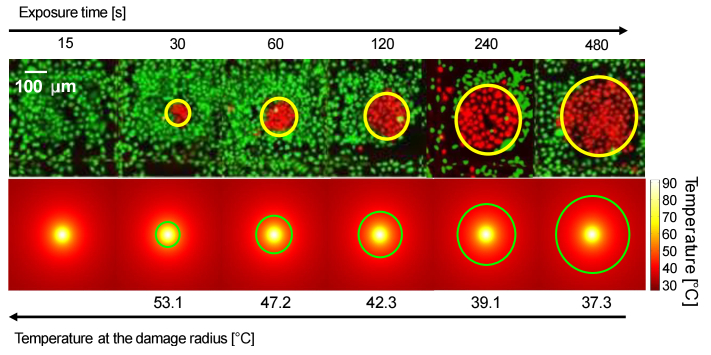
We now employ these results to extract the values of the temperature reached by the dead cells located at the border of the damaged area (i.e. at distance from the laser spot equal to the aforementioned damage radius R). An example of this procedure is shown in Fig. 6. The first row reports the cellular damage (red cells) induced by an irradiance of 0.82 MW/cm2 at different exposure times. We see that, at this laser fluence, for 15-s exposure there is no appreciable damage, while for longer exposure times the damage radius (highlighted in yellow in the figure) increases up to several hundreds of micrometers. The second row depicts, for the same irradiance, the results of the simulations regarding the temperature reached by the cells outside the laser spot. On each of these images, we highlighted in green an isotherm corresponding to the circumference of the damaged areas, obtained from the corresponding experimental images. The corresponding temperatures are reported below the figures. We see that for short exposure times (30 seconds) only those cells that reached temperatures close to die, while for long exposure times (480 seconds) it is sufficient for a cell to reach temperatures around to undergo permanent damage. We validated the results in temperature increase presented here by comparing them with those obtained with the model proposed by Macias-Romero et al. [58]. Their discrepancy is in the range of only 1-7 degrees.
Fig. 6.
Effect of increasing exposure time on cells. In the first row, the experimental damage obtained using an irradiance of 0.82 MW/cm2 and varying exposure time, with the circumferences of the damaged areas highlighted in yellow. In the second row, simulations where the isotherms and relative temperatures, corresponding to the circumferences of the damaged areas, are highlighted in green. The peak temperature at the center of the laser spot is .
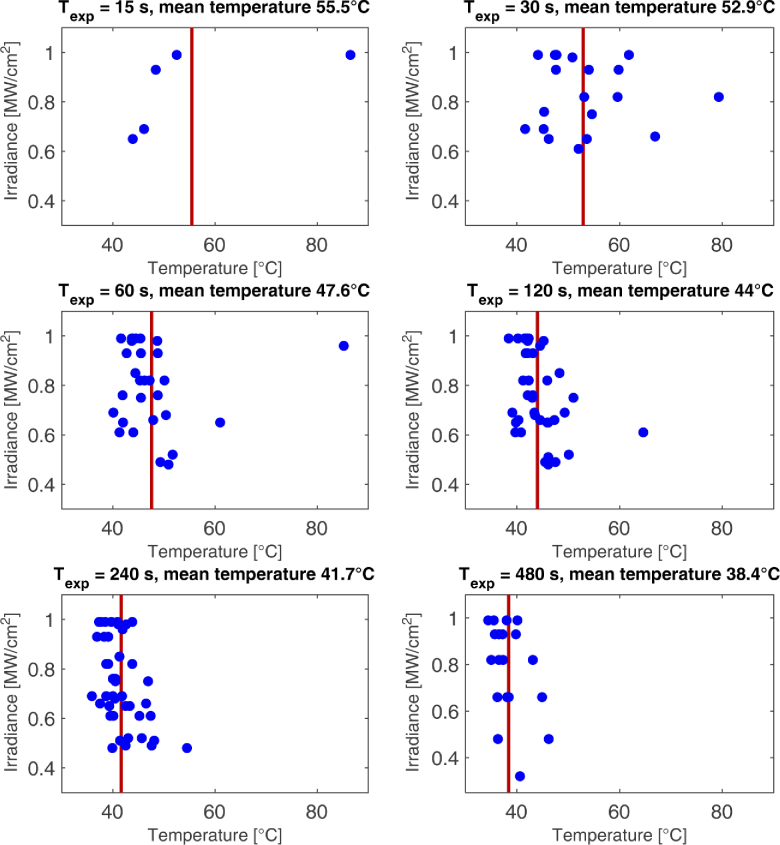
This general behavior was found for all the samples and irradiances. Interestingly, we observe that the radius of the dead cells around the laser focal spot (Eq. (3)) for a given exposure time only depends on the local temperature reached by the sample. To prove this, we repeated the procedure explained for Fig. 6 for all the 155 samples, retrieving the isotherm temperature at the border of the damaged areas for each irradiance. We plotted the results in Fig. 7 (blue dots), in which we grouped them as a function of the exposure time. We see that increasing the irradiance (vertical axis in Fig. 7) will cause higher temperatures on the sample, thus a larger damaged radius R, but the latter will always correspond to the same threshold temperature for cell death for a given exposure time. To highlight this behaviour, we included a red vertical line in Fig. 7 to show the mean isotherm temperature.
Fig. 7.
Scatter plot of the temperatures on the edge of the damaged areas for each sample and irradiance. Each panel represents a single exposure time. The mean isotherm temperature of each group is plotted in red.
4. Effect of scanning laser beam on cell viability
4.1. Methodology
While the previous set of experiments were conducted using a fixed laser illumination with a rather large spot, to simulate wide-field imaging, in this set we tested the effect of a raster scanning imaging modality on cell viability. Some studies [59,60] already proposed various power and irradiance thresholds to avoid tissue damage, and our goal here is to build on those studies to cover a wider range of parameters.
To this aim, we employed the combination of galvanometric mirror and motorized translational stage on two perpendicular axes, as described in Section 2.2. The laser beam followed a serpentine pattern to cover the whole sample area, changing direction after each horizontal scan is completed. In particular, we systematically varied the irradiance between 0.9 MW/cm2 and 6.2 MW/cm2, the scanning speed (0.25 mm/s, 0.5 mm/s and 1 mm/s) and the number of scanned lines (20, 50 and 200) within the same illumination area of 50x50 μm2. In this way, the vertical distance between two consecutive horizontal scans is inversely proportional to the number of scanned lines. Given the irradiance, the laser repetition rate and the numerical aperture of the objective described in section 2.2, this translates into an average laser power between 1 W and 7 W, an energy per pulse between 12.5 nJ and 87.5 nJ and a peak power ranging from 96 kW to 673 kW and a peak power density between 85 and 595 GW/cm2. Considering the scanning beam diameter (d), 12 μm, the number of lines (N) and the vertical dimension of the illumination area, 50 μm, it is possible to define the vertical line density (VLD) as:
| (7) |
With this parameter we consider the fact that scanning lines overlay during scanning. The energy density, also called light dose, is defined as irradiance * exposure time . As exposure time, in this experiment we considered the total time the single cell is illuminated by laser light, and we calculated it in this way:
| (8) |
where is the area of the scanning laser spot and is the scanning speed. As a result, the energy density ranges from 0.04 to 11.2 MJ/cm2.
4.2. Cell counting
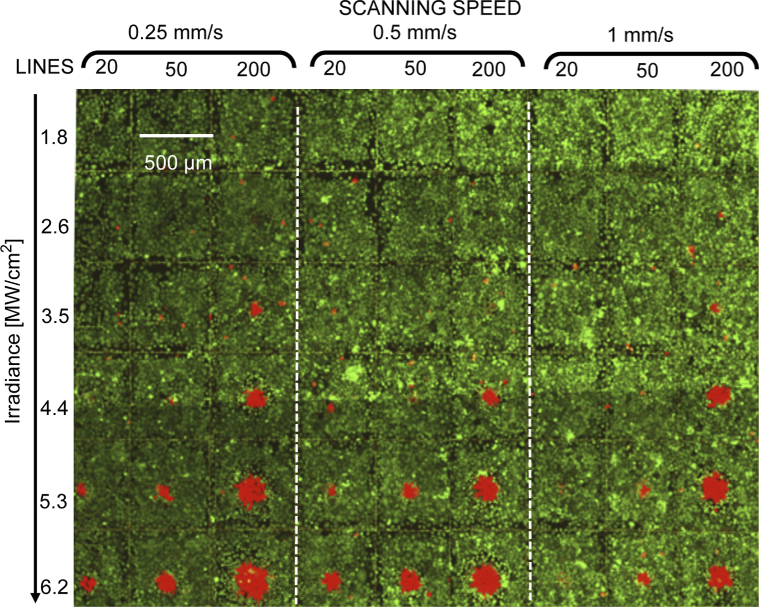
After laser irradiation, the samples were placed in the confocal microscope with incubator described in Sec. 2.3, where images of the scanned areas were taken just after the laser irradiation and after 18 hours. This enabled us to examine the onset of cell death over a longer period and obtain a more reliable result, as radiation-induced apoptosis in some cells may not be immediately visible. In Fig. 8 we report the image of one of the samples (18 hours after the irradiation), showing 54 different irradiated areas varying the irradiance (vertical axis), the scanning speed and the number of scanned lines (horizontal axis). Each 50x50 μm2 area contained an average of 10 cells. We repeated this experiment on three separate samples, obtaining consistent results across more than 1600 cells. We only counted cells in the area actually irradiated by the laser, even if sometimes the damage exceeded this area, such as in the cases of 200 scanned lines lines (third, sixth and ninth columns in Fig. 8) irradiated with the maximum irradiance (last row in Fig. 8).
Fig. 8.
One of the samples used for the experiment, imaged after the laser irradiation with a confocal microscope. The image shows the cell survival pattern obtained following a sample irradiation with different parameters of irradiance, scanning speed and number of scanned lines.
4.3. Data analysis
The goal of this analysis is to find a data-driven law that traces the relationship between the percentage of damaged cells and the experimental variables, i.e. laser power ( ), scanning speed ( ) and number of scanned lines ( ).
Let Y be the percentage of damaged cells over the total in the scanned area. Similarly to the previous section, we modeled Y as a logistic function Y = f(x) (see Eq. (1)), where the independent variable x is dependent on the experimental variables with given exponents , and :
| (9) |
In particular, we identified the optimal values for the exponents for the entire dataset using 187 samples (no outliers detected) by iteratively fitting the data using different combinations of values in the -10 to +10 range (in increments of 0.01). Using the OLS method, the best results that minimize the sum of the squares of the differences between the observed data and those of the curve representing the function itself are reported in Table 5.
Table 5. Optimal values obtained for the exponents and for the coefficients and , that maximize the R-squared value.
| R-squared | |||||
|---|---|---|---|---|---|
| 1.0 | 0.16 | -0.08 | 8.65 ± 0.12 | 0.90 ± 0.12 | 0.79 |
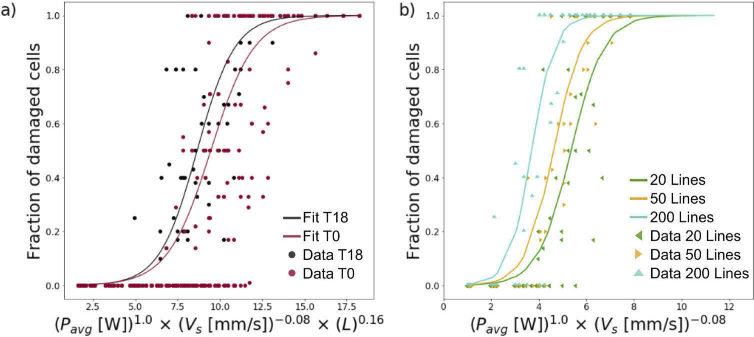
Figure 9(a) plots in black the fitted logistic function with data collected 18 hours after the laser irradiation. We also added in red the result using data collected just after the irradiation. The black curve is left-shifted, meaning that the number of damaged cells increased, and this confirms the inaccuracy of the data collected immediately after irradiation. Only using data collected after 18 hours, to better appreciate the goodness of the procedure for the different number of scanned lines, we also show in Fig. 9(b) a separate scatter plot for 20 (green), 50 (yellow) and 200 (cyan) scanned lines, with the same logistic function, in which the abscissa is now just a function of the average power and the scanning speed. In this way, we clearly see that increasing the number of scanned lines in the same field of view induces higher damage on the cells because they are illuminated several times during the imaging process.
Fig. 9.
a) Logistic functions with , in red obtained with data collected just after the irradiation and in black with data collected after 18 hours. b) Logistic functions with for each value of scanned lines L, with data collected after 18 hours.
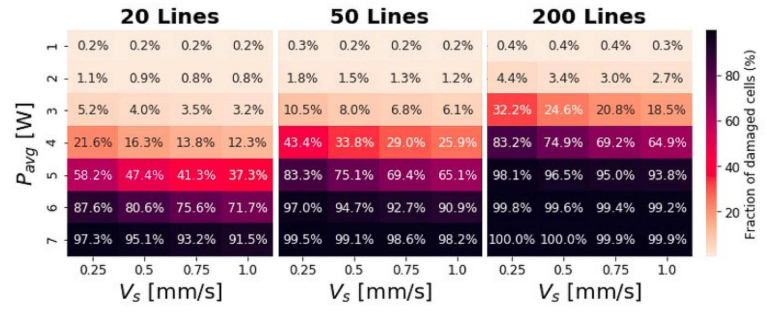
Looking at the optimal values reported in Table 5, we see that the dependence on is almost linear ( ), while there is an inverse dependence on the scanning speed ( ): as expected, the percentage of damaged cells decreases as the speed increases. However, the exponent is very close to zero, as also confirmed looking at the heatmaps in Fig. 10: the percentage of damaged cells changes much more noticeably when the laser power varies (vertical axis) than when the scanning speed varies (horizontal axis).
Fig. 10.
Heatmaps representing values of for any combination of , and L.
As done in Section 3 for fixed laser illumination, valid for wide-field imaging configuration, we provide here an empirical safety rule for the parameters in the raster scanning illumination configuration to keep the damage probability below 5%. In this case, the safety threshold corresponds to x = 5.367. Only one damaged experimental point was reported below this threshold, thus confirming the goodness of the 5% safety limit. Table 6 reports the safe working conditions, splitting the x values using Eq. (9).
Table 6. Maximum power allowed for safety working conditions to keep the damage probability below 5% in scanning laser beam experiments, in our range of parameters.
| VDL | |||
|---|---|---|---|
| 2.4 | 2.975 W | 3.145 W | 3.324 W |
| 6 | 2.569 W | 2.715 W | 2.870 W |
| 24 | 2.058 W | 2.175 W | 2.299 W |
5. Discussion and conclusions
In this work, we explored the photodamage mechanisms induced in live HeLa cells by NIR ultrashort laser pulses, conducting two experiments with different laser exposure methods. In the first experiment, the laser was held fixed on the sample, while the second experiment was conducted under raster-scanning configuration. There is a well known relationship between photodamage rate R and laser power applied: , where is the laser peak power, n is the order of photodamage mechanism, is the laser repetition rate and is the pulse duration [29,61,62]. To analyze our data, since we decided not to vary repetition rate and pulse duration, we chose to evaluate the dependence of damage on average power, without losing generality. In the first experiment we used the irradiance, , which is equivalent to average power since we kept the spot size fixed for the duration of the experiment.
Considering the result of the ’Binary problem for estimating the damage probability’, Subsection 3.1, we obtained 1.8 as exponent for irradiance, while in the ’Continuous problem for estimating the radius of cell damage’, Subsection 3.2, we obtained an exponent of 1.5. In both cases, the exponent is < 2, and this means that the photodamage is mainly caused by a first-order mechanism, therefore photothermal, with some minor contribution from higher-order processes. This conclusion is confirmed also in Subsection 3.3, in which, using a thermodynamic model, it is demonstrated that potentially lethal temperatures are reached in correspondence with the damaged areas. Regarding the contribution from higher-order processes, photochemical damage with ROS formation may be present, also enhanced by heat shock [63,64]. It must be noted that another mechanism comes into play when cells are stressed: the exchange of signals between them. Apoptosis can either be started by the cell itself (intrinsic pathway) or it can be triggered by signals from other cells, that alert their neighbours of a "dangerous" situation (extrinsic pathway) [65]. This might explain why some cells that are not exposed to particularly high temperatures ( , see bottom-right panel in Fig. 7) still start the apoptosis process, mainly for long irradiation exposure (480 s in this case): the infrared laser radiation generates heat, that acts as environmental stressor. In addition, it has been demonstrated that heat shock triggers the death receptor apoptotic pathway and, as already said, ROS production, leading to cell death [66–68]. In addition, considering the theory of Brownian motion, random walk and diffusion, we know that diffusing molecules travel over a distance whose square value increases on average linearly with time [69]. Thus, this hypothesis of exchange and diffusion of signals between cells is also confirmed by the fact that we observed that the radius of the damaged cells depends on the exposure time raised to a power close to 0.5 (see section 3.2).
The main finding of this set of experiments is therefore the fact that cells can withstand high temperatures for a short amount of time, while they will die if exposed for longer periods of time to even mild temperatures. This is a valuable piece of information for microscopists performing nonlinear imaging with ultrashort laser pulses. It provides a clear proof that it is in general more convenient to illuminate the samples with high irradiances: indeed, they provide strong signals (which scale like the second or third power of the irradiance for nonlinear processes such as second-harmonic generation, two-photon excited fluorescence or third-harmonic generation) so that the sample can be imaged in a short amount of time without harm. On the other hand, employing low irradiances would call for much longer imaging times, thus risking to create permanent damage to living cells.
Moving on to the second experiment, the one with the scanning laser beam, we obtained an exponent equal to 1.0 for the average laser power. In this case the linear damage component is even more predominant, and this can be explained considering the different exposure times applied. In the first experiment, the exposure time ranged from 15 s to 480 s, while in the second experiment it ranged from 45 ms to 1.8 s, too short to induce the formation of ROS in this parameters range.
Furthermore, the data-driven approach used to analyze the data, provides a valid tool to evaluate the experimental conditions to be used to avoid damaging the sample, if the same range of parameters are used. The 5% damage probability appears to be a proper safety threshold parameter. In fact in our experiments, photodamage was found only once below this threshold.
Acknowledgements
A.S. thanks Prof. Alessandro Alabastri for the constructive discussions. B.T. thanks Carolina Camassa for help in the experimental measurements and initial data analysis.
Funding
Regione Lombardia10.13039/501100009882 (POR FESR 2014-2020); Horizon 2020 Framework Programme10.13039/100010661 (881603); Horizon 2020 Framework Programme10.13039/100010661 (101016923).
Disclosures
The authors declare no conflicts of interest.
Data availability
Data underlying the results presented in this paper are available in [70].
References
- 1.Denk W., Strickler J., Webb W., “Two-photon laser scanning fluorescence microscopy,” Science 248(4951), 73–76 (1990). 10.1126/science.2321027 [DOI] [PubMed] [Google Scholar]
- 2.Carlton P. M., Boulanger J., Kervrann C., Sibarita J.-B., Salamero J., Gordon-Messer S., Bressan D., Haber J. E., Haase S., Shao L., Winoto L., Matsuda A., Kner P., Uzawa S., Gustafsson M., Kam Z., Agard D. A., Sedat J. W., “Fast live simultaneous multiwavelength four-dimensional optical microscopy,” Proc. Natl. Acad. Sci. 107(37), 16016–16022 (2010). 10.1073/pnas.1004037107 [DOI] [PMC free article] [PubMed] [Google Scholar]
- 3.Zipfel W. R., Williams R. M., Christie R., Nikitin A. Y., Hyman B. T., Webb W. W., “Live tissue intrinsic emission microscopy using multiphoton-excited native fluorescence and second harmonic generation,” Proc. Natl. Acad. Sci. 100(12), 7075–7080 (2003). 10.1073/pnas.0832308100 [DOI] [PMC free article] [PubMed] [Google Scholar]
- 4.Laissue P., Alghamdi R. A., Tomancak P., Reynaud E. G., Shroff H., “Assessing phototoxicity in live fluorescence imaging,” Nat. Methods 14(7), 657–661 (2017). 10.1038/nmeth.4344 [DOI] [PubMed] [Google Scholar]
- 5.Icha J., Weber M., Waters J. C., Norden C., “Phototoxicity in live fluorescence microscopy, and how to avoid it,” BioEssays 39(8), 1700003 (2017). 10.1002/bies.201700003 [DOI] [PubMed] [Google Scholar]
- 6.Daddysman M. K., Tycon M. A., Fecko C. J., “Photoinduced damage resulting from fluorescence imaging of live cells,” in Methods in Molecular Biology, (Springer, 2014), pp. 1–17. [DOI] [PubMed] [Google Scholar]
- 7.Koenig K., Liang H., Berns M. W., Tromberg B. J., “Cell damage by near-IR microbeams,” Nature 377(6544), 20–21 (1995). 10.1038/377020a0 [DOI] [PubMed] [Google Scholar]
- 8.Koenig K., “Multiphoton microscopy in life sciences,” J. Microsc. 200(2), 83–104 (2000). 10.1046/j.1365-2818.2000.00738.x [DOI] [PubMed] [Google Scholar]
- 9.Pestov D., Andegeko Y., Lozovoy V. V., Dantus M., “Photobleaching and photoenhancement of endogenous fluorescence observed in two-photon microscopy with broadband laser sources,” J. Opt. 12(8), 084006 (2010). 10.1088/2040-8978/12/8/084006 [DOI] [Google Scholar]
- 10.Koenig K., “Cell damage during multi-photon microscopy,” in Handbook Of Biological Confocal Microscopy (Springer, 2006), pp. 680–689. [Google Scholar]
- 11.Liu Y., Cheng D., Sonek G., Berns M., Chapman C., Tromberg B., “Evidence for localized cell heating induced by infrared optical tweezers,” Biophys. J. 68(5), 2137–2144 (1995). 10.1016/S0006-3495(95)80396-6 [DOI] [PMC free article] [PubMed] [Google Scholar]
- 12.Sinha R. P., Häder D.-P., “UV-induced DNA damage and repair: a review,” Photochem. Photobiol. Sci. 1(4), 225–236 (2002). 10.1039/b201230h [DOI] [PubMed] [Google Scholar]
- 13.Dalbosco L., Zanini G., D’Amato E., Tessarolo F., Boi S., Bauer P., Haase A., Antolini R., “Photodamage in deep tissue two-photon optical biopsy of human skin,” J. Biophotonics 8(10), 816–825 (2015). 10.1002/jbio.201400083 [DOI] [PubMed] [Google Scholar]
- 14.Paoli J., Smedh M., Wennberg A.-M., Ericson M. B., “Multiphoton laser scanning microscopy on non-melanoma skin cancer: Morphologic features for future non-invasive diagnostics,” J. Invest. Dermatol. 128(5), 1248–1255 (2008). 10.1038/sj.jid.5701139 [DOI] [PubMed] [Google Scholar]
- 15.Masters B., So P., Gratton E., “Multiphoton excitation fluorescence microscopy and spectroscopy of in vivo human skin,” Biophys. J. 72(6), 2405–2412 (1997). 10.1016/S0006-3495(97)78886-6 [DOI] [PMC free article] [PubMed] [Google Scholar]
- 16.Hopt A., Neher E., “Highly nonlinear photodamage in two-photon fluorescence microscopy,” Biophys. J. 80(4), 2029–2036 (2001). 10.1016/S0006-3495(01)76173-5 [DOI] [PMC free article] [PubMed] [Google Scholar]
- 17.Koester H. J., Baur D., Uhl R., Hell S. W., “Ca2 fluorescence imaging with pico- and femtosecond two-photon excitation: signal and photodamage,” Biophys. J. 77(4), 2226–2236 (1999). 10.1016/S0006-3495(99)77063-3 [DOI] [PMC free article] [PubMed] [Google Scholar]
- 18.Koenig K., So P. T. C., Mantulin W. W., Gratton E., “Cellular response to near-infrared femtosecond laser pulses in two-photon microscopes,” Opt. Lett. 22(2), 135 (1997). 10.1364/OL.22.000135 [DOI] [PubMed] [Google Scholar]
- 19.Stennett E. M. S., Ciuba M. A., Levitus M., “Photophysical processes in single molecule organic fluorescent probes,” Chem. Soc. Rev. 43(4), 1057–1075 (2014). 10.1039/C3CS60211G [DOI] [PubMed] [Google Scholar]
- 20.Laloi C., Havaux M., “Key players of singlet oxygen-induced cell death in plants,” Front. Plant Sci. 6, 39 (2015). 10.3389/fpls.2015.00039 [DOI] [PMC free article] [PubMed] [Google Scholar]
- 21.Kong X., Mohanty S. K., Stephens J., Heale J. T., Gomez-Godinez V., Shi L. Z., Kim J.-S., Yokomori K., Berns M. W., “Comparative analysis of different laser systems to study cellular responses to DNA damage in mammalian cells,” Nucleic Acids Res. 37(9), e68 (2009). 10.1093/nar/gkp221 [DOI] [PMC free article] [PubMed] [Google Scholar]
- 22.Botchway S., Reynolds P., Parker A., O’Neill P., “Use of near infrared femtosecond lasers as sub-micron radiation microbeam for cell DNA damage and repair studies,” Mutat. Res. Mutat. Res. 704(1-3), 38–44 (2010). 10.1016/j.mrrev.2010.01.003 [DOI] [PubMed] [Google Scholar]
- 23.Burhans W. C., Heintz N. H., “The cell cycle is a redox cycle: linking phase-specific targets to cell fate,” Free. Radic. Biol. Medicine 47(9), 1282–1293 (2009). 10.1016/j.freeradbiomed.2009.05.026 [DOI] [PubMed] [Google Scholar]
- 24.Shafirovich V., Dourandin A., Luneva N. P., Singh C., Kirigin F., Geacintov N. E., “Multiphoton near-infrared femtosecond laser pulse-induced DNA damage with and without the photosensitizer proflavine,” Photochem. Photobiol. 69(3), 265 (1999). [DOI] [PubMed] [Google Scholar]
- 25.Mari P.-O., Florea B. I., Persengiev S. P., Verkaik N. S., Bruggenwirth H. T., Modesti M., Giglia-Mari G., Bezstarosti K., Demmers J. A. A., Luider T. M., Houtsmuller A. B., van Gent D. C., “Dynamic assembly of end-joining complexes requires interaction between ku70/80 and XRCC4,” Proc. Natl. Acad. Sci. 103(49), 18597–18602 (2006). 10.1073/pnas.0609061103 [DOI] [PMC free article] [PubMed] [Google Scholar]
- 26.Vogel A., Noack J., Huttman G., Paltauf G., “Mechanisms of femtosecond laser nanosurgery of cells and tissues,” Appl. Phys. B 81(8), 1015–1047 (2005). 10.1007/s00340-005-2036-6 [DOI] [Google Scholar]
- 27.Vogel A., Noack J., Nahen K., Theisen D., Busch S., Parlitz U., Hammer D., Noojin G., Rockwell B., Birngruber R., “Energy balance of optical breakdown in water at nanosecond to femtosecond time scales,” Appl. Phys. B 68(2), 271–280 (1999). 10.1007/s003400050617 [DOI] [Google Scholar]
- 28.Vogel A., Venugopalan V., “Mechanisms of pulsed laser ablation of biological tissues,” Chem. Rev. 103(2), 577–644 (2003). 10.1021/cr010379n [DOI] [PubMed] [Google Scholar]
- 29.Fu Y., Wang H., Shi R., Cheng J.-X., “Characterization of photodamage in coherent anti-stokes raman scattering microscopy,” Opt. Express 14(9), 3942 (2006). 10.1364/OE.14.003942 [DOI] [PubMed] [Google Scholar]
- 30.Kalies S., Kuetemeyer K., Heisterkamp A., “Mechanisms of high-order photobleaching and its relationship to intracellular ablation,” Biomed. Opt. Express 2(4), 805 (2011). 10.1364/BOE.2.000805 [DOI] [PMC free article] [PubMed] [Google Scholar]
- 31.Tosheva K. L., Yuan Y., Pereira P. M., Culley S., Henriques R., “Between life and death: reducing phototoxicity in super-resolution microscopy,” Preprints (2019). [DOI] [PMC free article] [PubMed]
- 32.Ryu I. S., Camp C. H., Jin Y., Cicerone M. T., Lee Y. J., “Beam scanning for rapid coherent raman hyperspectral imaging,” Opt. Lett. 40(24), 5826 (2015). 10.1364/OL.40.005826 [DOI] [PMC free article] [PubMed] [Google Scholar]
- 33.Magidson V., Khodjakov A., “Circumventing photodamage in live-cell microscopy,” in Methods in Cell Biology (Elsevier, 2013), pp. 545–560. [DOI] [PMC free article] [PubMed] [Google Scholar]
- 34.Harzic R. L., Riemann I., Koenig K., Wullner C., Donitzky C., “Influence of femtosecond laser pulse irradiation on the viability of cells at 1035, 517, and 345nm,” J. Appl. Phys. 102(11), 114701 (2007). 10.1063/1.2818107 [DOI] [Google Scholar]
- 35.Chen I.-H., Chu S.-W., Sun C.-K., Cheng P.-C., Lin B.-L., “Wavelength dependent damage in biological multiphoton confocal microscopy: A micro-spectroscopic comparison between femtosecond Ti:sapphire and Cr:forsterite laser sources,” Opt. Quantum Electron. 34(12), 1251–1266 (2002). 10.1023/A:1021303426482 [DOI] [Google Scholar]
- 36.Galli R., Uckermann O., Andresen E. F., Geiger K. D., Koch E., Schackert G., Steiner G., Kirsch M., “Intrinsic indicator of photodamage during label-free multiphoton microscopy of cells and tissues,” PLoS One 9(10), e110295 (2014). 10.1371/journal.pone.0110295 [DOI] [PMC free article] [PubMed] [Google Scholar]
- 37.Stockley J. H., Evans K., Matthey M., Volbracht K., Agathou S., Mukanowa J., Burrone J., Káradóttir R. T., “Surpassing light-induced cell damage in vitro with novel cell culture media,” Sci. Rep. 7(1), 849 (2017). 10.1038/s41598-017-00829-x [DOI] [PMC free article] [PubMed] [Google Scholar]
- 38.Richmond D., Jost A. P.-T., Lambert T., Waters J., Elliott H., “Deadnet: Identifying phototoxicity from label-free microscopy images of cells using deep convnets,” arXiv Prepr. arXiv1701.06109 (2017).
- 39.Dobrucki J. W., Feret D., Noatynska A., “Scattering of exciting light by live cells in fluorescence confocal imaging: phototoxic effects and relevance for FRAP studies,” Biophys. J. 93(5), 1778–1786 (2007). 10.1529/biophysj.106.096636 [DOI] [PMC free article] [PubMed] [Google Scholar]
- 40.Hoebe R. A., Oven C. H. V., Gadella T. W. J., Dhonukshe P. B., V. Noorden C. J. F., Manders E. M. M., “Controlled light-exposure microscopy reduces photobleaching and phototoxicity in fluorescence live-cell imaging,” Nat. Biotechnol. 25(2), 249–253 (2007). 10.1038/nbt1278 [DOI] [PubMed] [Google Scholar]
- 41.Dixit R., Cyr R., “Cell damage and reactive oxygen species production induced by fluorescence microscopy: effect on mitosis and guidelines for non-invasive fluorescence microscopy,” The Plant J. 36(2), 280–290 (2003). 10.1046/j.1365-313X.2003.01868.x [DOI] [PubMed] [Google Scholar]
- 42.Kiepas A., Voorand E., Mubaid F., Siegel P. M., Brown C. M., “Optimizing live-cell fluorescence imaging conditions to minimize phototoxicity,” J. Cell Sci. 133, jcs242834 (2020). 10.1242/jcs.242834 [DOI] [PubMed] [Google Scholar]
- 43.Débarre D., Olivier N., Supatto W., Beaurepaire E., “Mitigating phototoxicity during multiphoton microscopy of live drosophila embryos in the 1.0–1.2 µm wavelength range,” PLoS One 9(8), e104250 (2014). 10.1371/journal.pone.0104250 [DOI] [PMC free article] [PubMed] [Google Scholar]
- 44.Nan X., Potma E. O., Xie X. S., “Nonperturbative chemical imaging of organelle transport in living cells with coherent anti-stokes raman scattering microscopy,” Biophys. J. 91(2), 728–735 (2006). 10.1529/biophysj.105.074534 [DOI] [PMC free article] [PubMed] [Google Scholar]
- 45.Silve A., Dorval N., Schmid T., Mir L., Attal-Tretout B., “A wide-field arrangement for single-shot CARS imaging of living cells,” J. Raman Spectrosc. 43(5), 644–650 (2012). 10.1002/jrs.4051 [DOI] [Google Scholar]
- 46.Freudiger C. W., Yang W., Holtom G. R., Peyghambarian N., Xie X. S., Kieu K. Q., “Stimulated raman scattering microscopy with a robust fibre laser source,” Nat. Photonics 8(2), 153–159 (2014). 10.1038/nphoton.2013.360 [DOI] [PMC free article] [PubMed] [Google Scholar]
- 47.Waeldchen S., Lehmann J., Klein T., van de Linde S., Sauer M., “Light-induced cell damage in live-cell super-resolution microscopy,” Sci. Rep. 5(1), 15348 (2015). 10.1038/srep15348 [DOI] [PMC free article] [PubMed] [Google Scholar]
- 48.Minamikawa T., Murakami Y., Matsumura N., Niioka H., Fukushima S., Araki T., Hashimoto M., “Photo-induced cell damage analysis for single- and multifocus coherent anti-stokes raman scattering microscopy,” J. Spectrosc. 2017, 1–8 (2017). 10.1155/2017/5725340 [DOI] [Google Scholar]
- 49.https://imagej.nih.gov/ij/index.html.
- 50.Berkson J., “Application of the logistic function to bio-assay,” J. Am. Stat. Assoc. 39(227), 357–365 (1944). 10.2307/2280041 [DOI] [Google Scholar]
- 51.Thomsen S., “Pathologic analysis of photothermal and photochemical effects of laser-tissue interactions,” Photochem. Photobiol. 53(6), 825–835 (1991). 10.1111/j.1751-1097.1991.tb09897.x [DOI] [PubMed] [Google Scholar]
- 52.Schulman N., Hall E. J., “Hyperthermia: Its effect on proliferative and plateau phase cell cultures,” Radiology 113(1), 209–211 (1974). 10.1148/113.1.209 [DOI] [PubMed] [Google Scholar]
- 53.Niemz M. H., Laser-Tissue Interactions (Springer, 2002). [Google Scholar]
- 54.Silva D. F. T., Mesquita-Ferrari R. A., Fernandes K. P. S., Raele M. P., Wetter N. U., Deana A. M., “Effective transmission of light for media culture, plates and tubes,” Photochem. Photobiol. 88(5), 1211–1216 (2012). 10.1111/j.1751-1097.2012.01166.x [DOI] [PubMed] [Google Scholar]
- 55.Park B. K., Yi N., Park J., Kim D., “Thermal conductivity of single biological cells and relation with cell viability,” Appl. Phys. Lett. 102(20), 203702 (2013). 10.1063/1.4807471 [DOI] [Google Scholar]
- 56.Khosroshahi M. E., Applications of Biophotonics and Nanobiomaterials in Biomedical Engineering (CRC Press, 2017). [Google Scholar]
- 57.Touloukian Y. S., Powell R. W., Ho C. Y., Klemens P. G., “Thermophysical properties of matter - the TPRC data series. Volume2. Thermal conductivity - nonmetallic solids,” (1971).
- 58.Macias-Romero C., Zubkovs V., Wang S., Roke S., “Wide-field medium-repetition-rate multiphoton microscopy reduces photodamage of living cells,” Biomed. Opt. Express 7(4), 1458 (2016). 10.1364/BOE.7.001458 [DOI] [PMC free article] [PubMed] [Google Scholar]
- 59.Douthwright S., Sluder G., “Live cell imaging: assessing the phototoxicity of 488 and 546 nm light and methods to alleviate it,” J. Cell. Physiol. 232(9), 2461–2468 (2017). 10.1002/jcp.25588 [DOI] [PubMed] [Google Scholar]
- 60.Frigault M. M., Lacoste J., Swift J. L., Brown C. M., “Live-cell microscopy - tips and tools,” J. Cell Sci. 122(6), 753–767 (2009). 10.1242/jcs.033837 [DOI] [PubMed] [Google Scholar]
- 61.Koenig K., Becker T. W., Fischer P., Riemann I., Halbhuber K.-J., “Pulse-length dependence of cellular response to intense near-infrared laser pulses in multiphoton microscopes,” Opt. Lett. 24(2), 113 (1999). 10.1364/OL.24.000113 [DOI] [PubMed] [Google Scholar]
- 62.Arkhipov S. N., Saytashev I., Dantus M., “Intravital imaging study on photodamage produced by femtosecond near-infrared laser pulses in vivo,” Photochem. Photobiol. 92(2), 308–313 (2016). 10.1111/php.12572 [DOI] [PMC free article] [PubMed] [Google Scholar]
- 63.Fedyaeva A. V., Stepanov A. V., Lyubushkina I. V., Pobezhimova T. P., Rikhvanov E. G., “Heat shock induces production of reactive oxygen species and increases inner mitochondrial membrane potential in winter wheat cells,” Biochemistry (Moscow) 79(11), 1202–1210 (2014). 10.1134/S0006297914110078 [DOI] [PubMed] [Google Scholar]
- 64.Slimen I. B., Najar T., Ghram A., Dabbebi H., Mrad M. B., Abdrabbah M., “Reactive oxygen species, heat stress and oxidative-induced mitochondrial damage. a review,” Int. J. Hyperthermia 30(7), 513–523 (2014). 10.3109/02656736.2014.971446 [DOI] [PubMed] [Google Scholar]
- 65.Elmore S., “Apoptosis: a review of programmed cell death,” Toxicol. Pathol. 35(4), 495–516 (2007). 10.1080/01926230701320337 [DOI] [PMC free article] [PubMed] [Google Scholar]
- 66.Hsu Y.-L., Yu H.-S., Lin H.-C., Wu K.-Y., Yang R.-C., Kuo P.-L., “Heat shock induces apoptosis through reactive oxygen species involving mitochondrial and death receptor pathways in corneal cells,” Exp. Eye Res. 93(4), 405–412 (2011). 10.1016/j.exer.2011.06.005 [DOI] [PubMed] [Google Scholar]
- 67.Gu Z. T., Wang H., Li L., Liu Y. S., Deng X. B., Huo S. F., Yuan F. F., Liu Z. F., Tong H. S., Su L., “Heat stress induces apoptosis through transcription-independent p53-mediated mitochondrial pathways in human umbilical vein endothelial cell,” Sci. Rep. 4(1), 4469 (2015). 10.1038/srep04469 [DOI] [PMC free article] [PubMed] [Google Scholar]
- 68.Gu Z. T., Li L., P. Zhao F. W. U., Yang H., Liu Y. S., Geng Y., Zhao M., Su L., “Heat stress induced apoptosis is triggered by transcription-independent p53, Ca2+ dyshomeostasis and the subsequent Bax mitochondrial translocation,” Sci. Rep. 5(1), 11497 (2015). 10.1038/srep11497 [DOI] [PMC free article] [PubMed] [Google Scholar]
- 69.Sen P. N., “Time-dependent diffusion coefficient as a probe of geometry,” Concepts Magn. Reson. 23A(1), 1–21 (2004). 10.1002/cmr.a.20017 [DOI] [Google Scholar]
- 70.Talone B., “Additional data - phototoxicity induced in living HeLa cells by focused femtosecond laser pulses,” Zenodo, 2021. 10.5281/zenodo.5708281. [DOI] [PMC free article] [PubMed]
Associated Data
This section collects any data citations, data availability statements, or supplementary materials included in this article.
Data Citations
- Talone B., “Additional data - phototoxicity induced in living HeLa cells by focused femtosecond laser pulses,” Zenodo, 2021. 10.5281/zenodo.5708281. [DOI] [PMC free article] [PubMed]
Data Availability Statement
Data underlying the results presented in this paper are available in [70].


